REPORT: Eviction Filings Continued Dramatic Decline Through 2019
A new report from the NYU Furman Center shows that eviction filings in New York City continued their dramatic decline over the last two years and are down nearly 30 percent from 2013. Researchers point to a strengthening economy and state and local policies protecting renters as likely factors contributing to the drop. They also note the possibility of a spike in filings later this summer due to the economic shock of COVID-19. At the neighborhood level, areas with disproportionate shares of Black and Hispanic residents see 2019 filing rates nearly seven times higher than those in whiter areas. At the extreme, in the most impacted zip codes, nearly one in four households face the prospect of eviction.
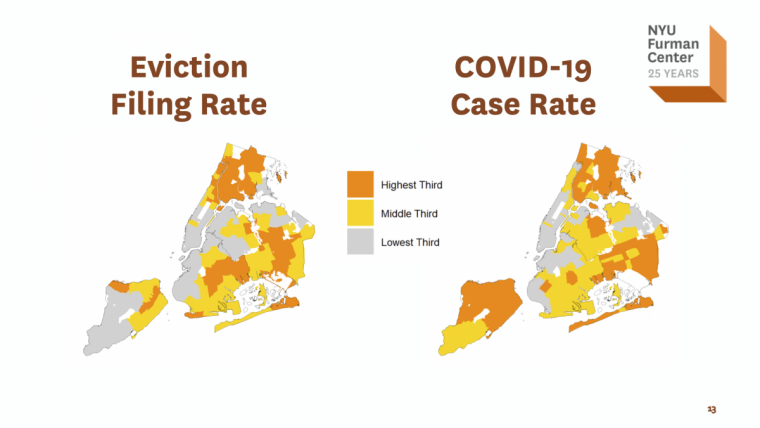
The areas with the highest filing rates for 2019 were concentrated in the Bronx, eastern Queens, and eastern Brooklyn, with a few areas also in northern Manhattan and northern Staten Island. Conversely, the areas with the lowest filing rates were mostly located in lower Manhattan, western Brooklyn, western Queens, and lower Staten Island; none were in the Bronx. Strikingly, the share of the population that is Black in the areas with the highest filing rates (40.6%) was almost eleven times the share in areas with the lowest filing rates (3.9%) and almost twice the share in the city as a whole (21.9%). Similarly, although less dramatic, the share of the population that is Hispanic in the highest filing areas (39.6%) was over twice the share in the lowest filing areas (18.9%).
In addition to its Focus on Eviction Filings, the State of New York City’s Housing and Neighborhoods release also contains citywide analysis and findings related to renters, homeowners, and construction across the five boroughs. It concludes with a detailed statistical reference guide for each of New York City’s 59 Community Districts, available at furmancenter.org/neighborhoods.
LAUNCH EVENT: To mark the launch of the report, the NYU Furman Center is hosting a virtual event, By the Numbers: Focus on Eviction on Tuesday, June 16, 2019 at 1:00pm ET.
At the event an expert panel will discuss the data on New York City eviction filing trends between 2010 and today, and explore how cities can prepare to address the challenges faced by renters, landlords, and housing courts when eviction moratoria end.
Panelists will include:
- Maria Torres-Springer, Vice-President for U.S. Programs, Ford Foundation (Moderator)
- Ira Goldstein, President of Policy Solutions, The Reinvestment Fund, Philadelphia, PA
- Adriene Holder, Attorney-in-Charge, Civil Practice, The Legal Aid Society, New York City
- Linda Mandolini, President, Eden Housing, Hayward, CA
STATE OF NEW YORK CITY EVICTION FILINGS KEY FINDINGS
National
- Filing rates declined each year in New York City as well as in all three of the other cities examined (Chicago, Philadelphia, and Washington, D.C.) from 2013 through 2019.
Citywide
- The reductions in New York City filings were large: eviction filings decreased by about one third in New York City between 2013 and 2019, with the largest annual decrease occurring between 2018 and 2019.
- Although all five boroughs experienced a decrease in filing rate since 2016, the Bronx has consistently had a filing rate almost twice as high as the other boroughs’ filing rates.
ZIP Code Level
- There were large disparities in filing rates across ZIP Code areas, with areas in the top third experiencing filing rates almost seven times the filing rates of those in the lowest third.
- Disparities in filing rates vary by race and income: a much greater share of residents of the areas with the highest filing rates were Black and Hispanic2 than in the areas with the lowest rates, and residents in areas with higher filing rates were more economically disadvantaged.
Trends
- While eviction filing rates fell in nearly all ZIP Code areas, seven areas experienced increases in their eviction filing rates, four of which had higher than average filing rates already.
- In the aggregate, the third of areas that experienced the largest declines in filing rates between 2013 and 2019 had higher average filing rates at the start of the period than other areas.
- Areas that experienced the largest absolute declines in filing rates from 2013 to 2019 had populations that were disproportionately Black and Hispanic and had lower incomes.
- Despite large declines, we nevertheless see considerable persistence in filing rate ranking: nearly all of the ZIP Code areas in the top third of filing rates in 2013 remained there in 2019.