State of the City 2022
In this section, we examine what the recent administrative and census data tell us about long- and short-term changes in New York City’s rental market. While more reliable and comprehensive data has a noticeable lag, a frustration for a market that moves as fast as New York City’s has recently, we have some data through 2022. Data show us that as of the end of 2022, eviction filings have been steadily increasing since the eviction moratorium ended, but still remain below pre-pandemic levels. Housing code violations issued by the Department of Housing Preservation and Development were higher than pre-pandemic levels for two years in a row. A survey put out by the Census during the pandemic shows us that the share of New York City tenants with arrears slightly decreased between 2021 and 2022. However, the survey is somewhat limited by low sample sizes. With that, the survey shows that while there is no data available to compare rent arrears to pre-pandemic levels, New York City renters reported a 4.6 percentage point decrease in rent arrears between 2022 and 2021. Other important housing data lags but still offers valuable insight. While increases in median gross rent outpaced median renter household income (indexed to 2007) overall between 2007 and 2019, the difference was closing in the later half of the 2010s. A decline in renter incomes in 2021 and a continued increase in rents in the same year expanded that gap however—this may be a function of actual income declines for renter households, or, a compositional shift in renter households, as a function of higher income households that exited the city during the pandemic.
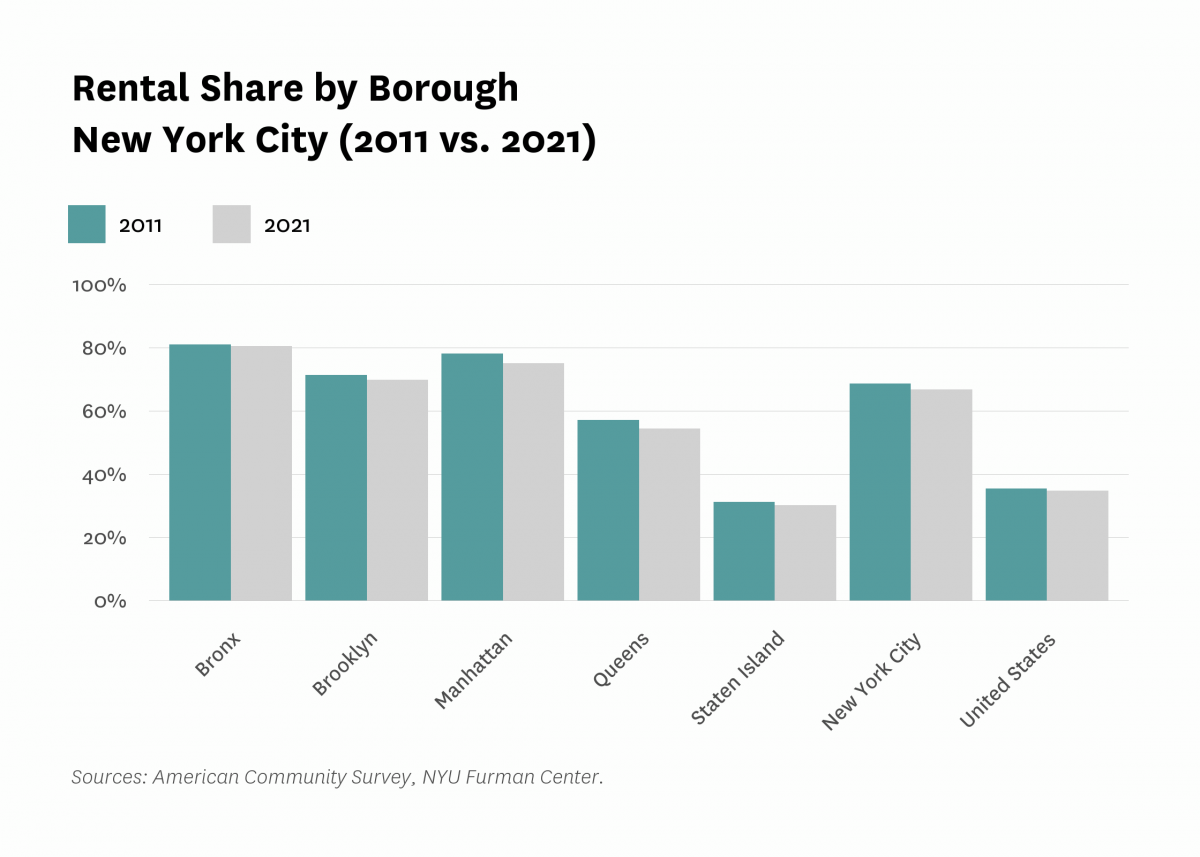
The overall share of New York City households who rent declined between 2011 to 2021 at double the national rate.
The share of households that live in rental units in New York City decreased by 2 percentage points from 2011 to 2021 (from 68.7% to 66.7%, respectively). While this decrease mirrors nationwide trends, its magnitude is about twice that of the nationwide decrease of 0.8 percentage points. The Bronx, the borough with the highest share of renters, had the smallest decrease in rental share (from 81.0% to 80.4%). Meanwhile, Staten Island, the borough with the lowest share of renters, experienced a decline in rental share in line with the national average (with a decrease of 0.9 percentage points). The borough that experienced the largest decline in the share of rental households was Manhattan (the possibility that these were higher income renters who disproportionately left the market could help explain the overall decline in renter income), where the rate of households in rental units went from 78.1 percent in 2011 to 75.0 percent in 2021. While these trends show that a slightly lower share of households were renters in 2021 compared to 2011, the movement has not been dramatic. New York City remains a majority-renter city: two-thirds of households in New York City are renter households.
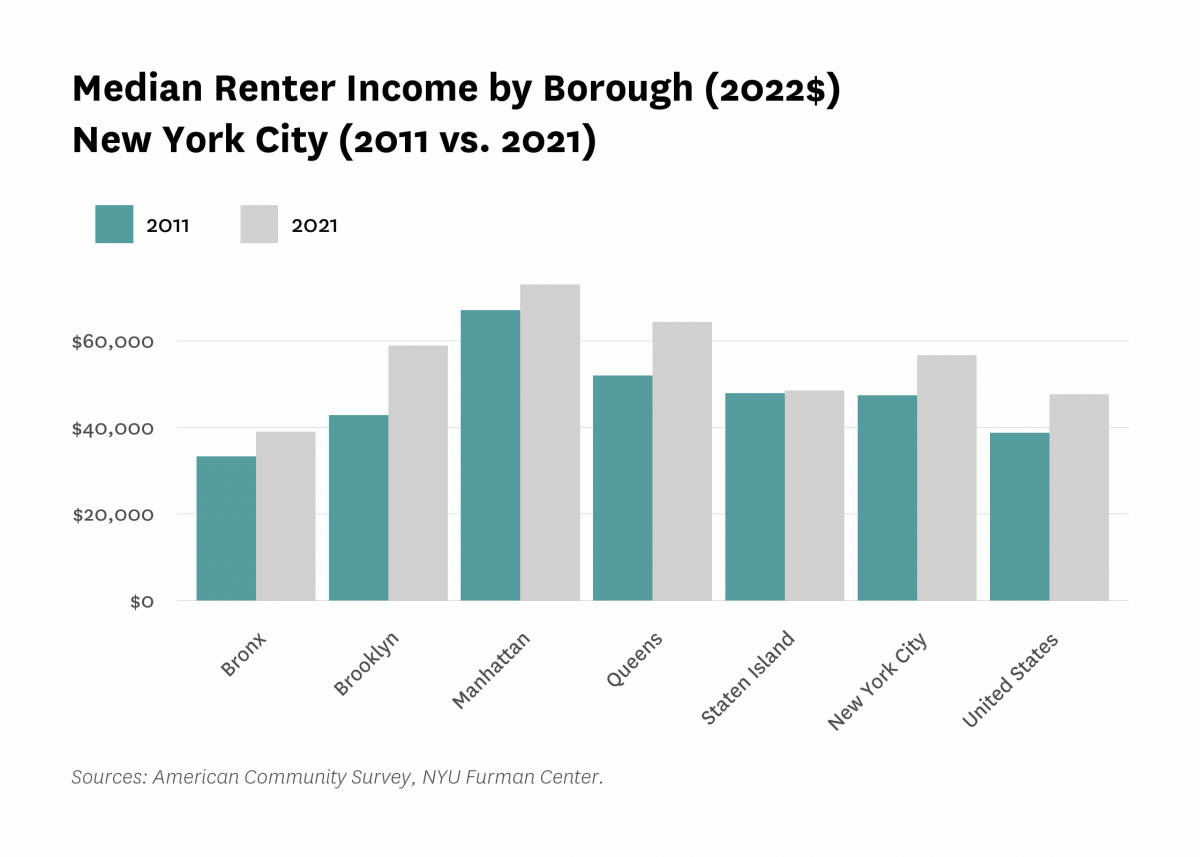
New York City’s median renter household income increased 19.4 percent between 2011 and 2021, with the largest increase of all boroughs taking place in Brooklyn.
In a 10-year period, New York City median renter household real income (2022$) increased by 19.4 percent ($9,187), an increase from the 2011 level in real terms. This is a smaller percent change than on the national level: from 2011 to 2021, the national median renter income increased by 23 percent. Among New York City boroughs, Brooklyn experienced the largest percent change while Staten Island experienced the smallest (37.5% and 1.2%, respectively).
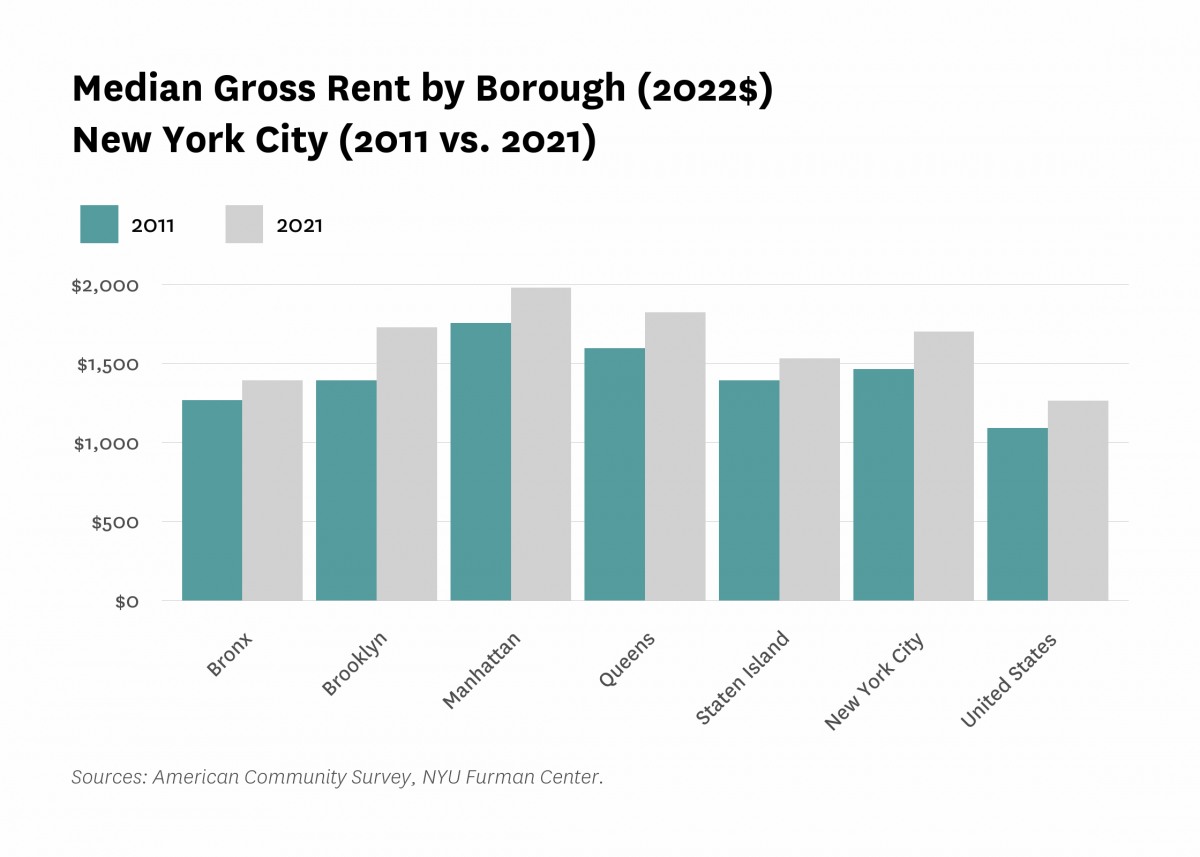
Between 2011 and 2021, the increase in New York City’s median gross rent slightly outpaced the increase at the national level.
“Gross rent” refers to the legal rent charged on a lease prior to any concessions, plus estimated electricity and heating costs. In New York City, the median gross rent increased by 16.2 percent between 2011 and 2021, compared to 15.9 percent nationwide. Manhattan remains the borough with the highest median gross rent, but Brooklyn saw the highest rate of increase: median rents increased from $1,393 in 2011 to $1,727 in 2021 (24%). The Bronx remains the borough with the lowest median gross rent, and experienced a rate of increase similar to that in Staten Island over the past decade (10 percent and 9.9 percent, respectively).
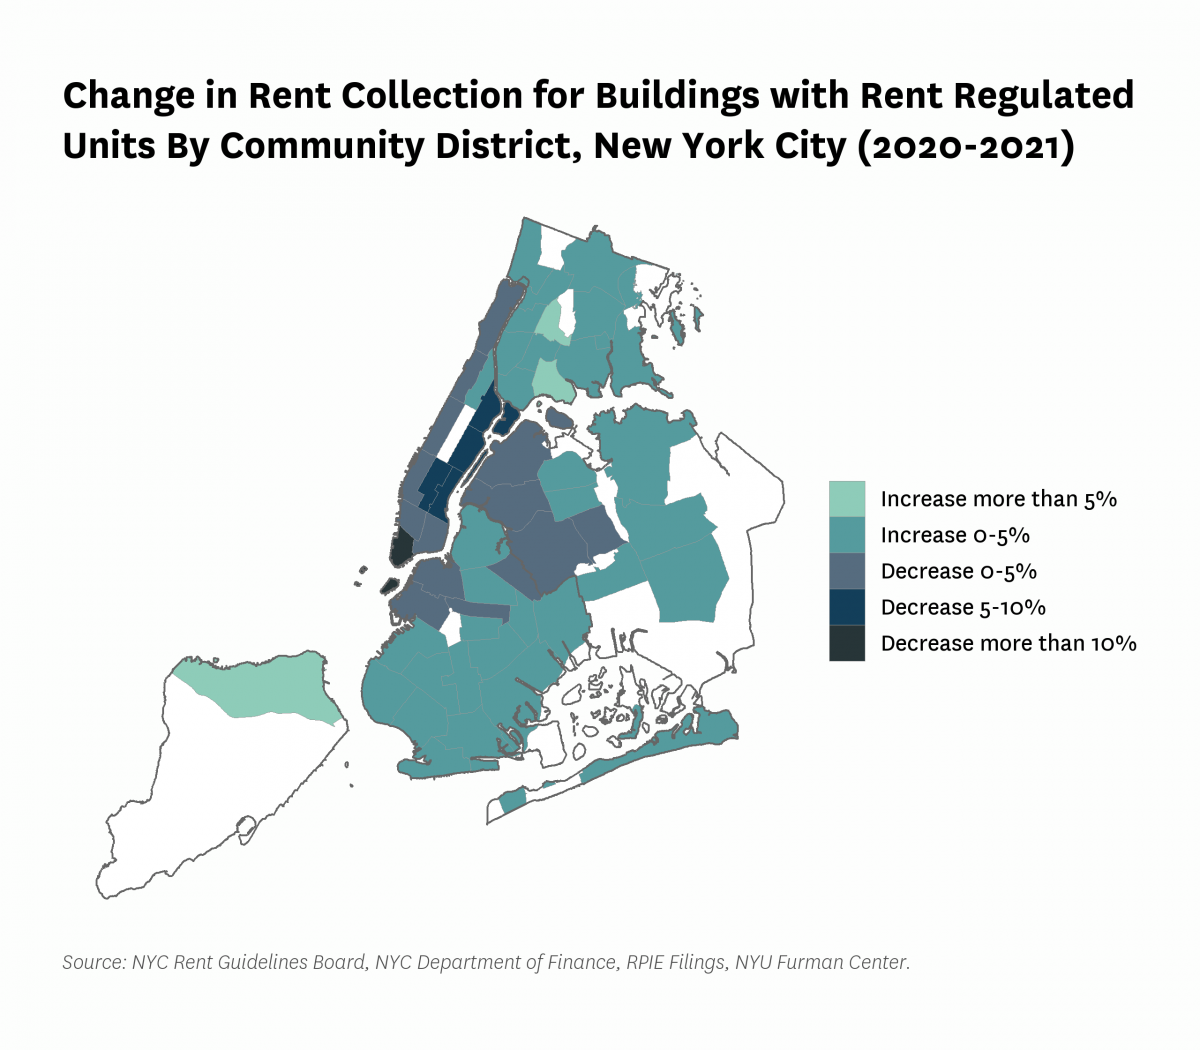
Between 2020 and 2021, building owners reported that collected rent in buildings with at least one rent regulated unit decreased in Manhattan, but increased in many areas of the outer boroughs.
The pandemic and economic shutdown dramatically impacted New York City’s rental market in 2020 and 2021. Data from the recently released 2023 Rent Guidelines Board Income and Expense study (which examines 2021 data) shows that between 2020 and 2021, collected rent in buildings with at least one rent regulated unit decreased across most areas in Manhattan and increased across many areas in Brooklyn, the Bronx, Queens, and Staten Island. This shows a continuation of trends identified in last year’s report (which was based on data from 2019 to 2020). The RGB looks at trends in buildings with at least one rent regulated unit - perhaps confusingly, this includes buildings in which the share of rent regulated units is so low that the building operates like a fully market rate rental, as well as newly constructed buildings with rent levels at the market rate. As a result, these geographic differences are more likely indications of where the market experienced declines in rent collections as a result of market-rate tenants being more likely to leave higher cost areas during the pandemic, with rent collections declining in suit. At the same time, rental income in properties in other sections of the city did not appear to be as affected, at least for the median property. It is impossible to discern whether that is a function of lower prevalence of vacancy upon turnover in those areas of the city, relative to core-Manhattan, or that pandemic-era government financial support played a role in ensuring that low- and moderate-income renters could keep up with payments. With collected rents decreasing by 10.6 percent between 2020 and 2021, the Financial District saw the greatest decrease in collected rents within buildings with at least one rent regulated unit. Belmont/East Tremont, St. George/Stapleton, and Hunts Point/Longwood saw the highest increases in collected rent (7.6%, 5.2% and 5.1%, respectively).
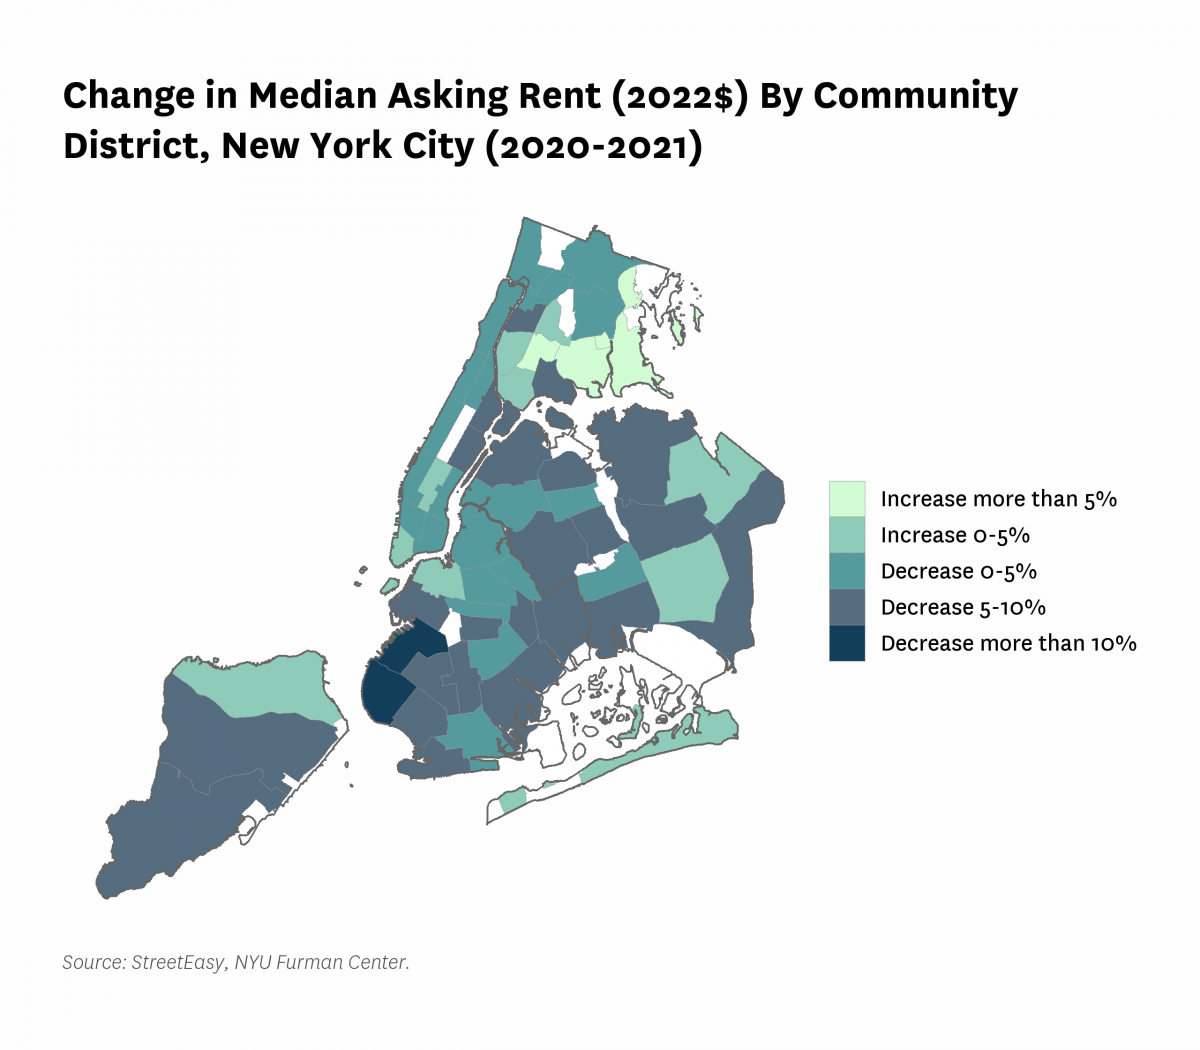
According to StreetEasy data, the median asking rent decreased in most community districts between 2020 and 2021, with a notable cluster of community districts in the Bronx that experienced an increase in median asking rent.
“Asking rent” refers to the rent building owners quote when advertising units available on the market. Among New York City’s 59 community districts, only 13 experienced increases in median asking rents between 2020 to 2021. Of these 13, six are located in the Bronx. The community districts with the three greatest increases in median asking rent from 2020 to 2021 are all located in the Bronx: Throgs Neck/Co-op City, Parkchester/Soundview, and Morrisania/Crotona (with increases of 12.9%, 9.8%, and 7.0%, respectively). These data are not necessarily representative of the full range of New York City’s market because they only cover the types of apartments listed on StreetEasy. For that reason they should be interpreted with caution.
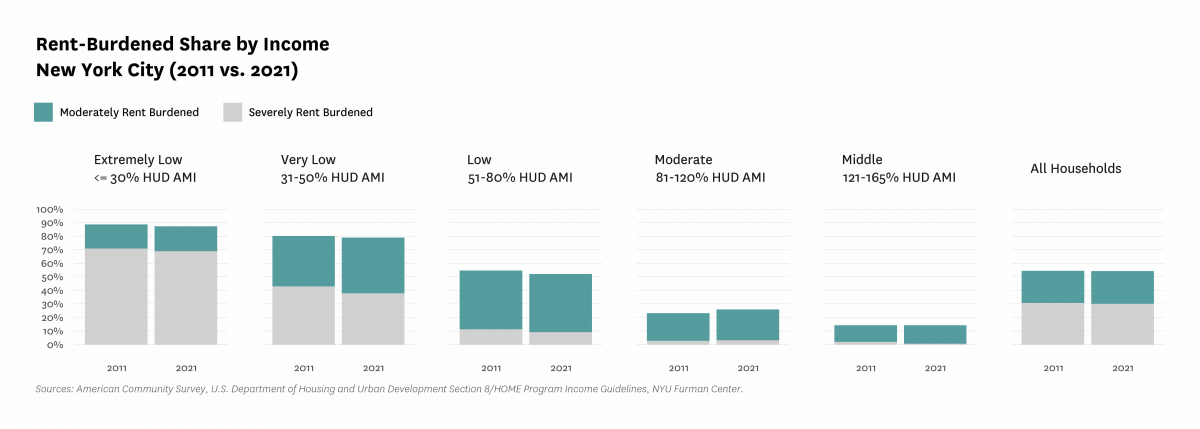
The share of New York City households that were rent burdened remained fairly constant between 2011 and 2021.
A household is considered “moderately rent burdened” if the household spends thirty percent or more of their income on rent, and “severely rent burdened” if the household spends fifty percent or more of their income on rent. The share of New York City households that were rent burdened stayed fairly constant - going from 54.5 percent in 2011, to 54.1 percent in 2021. When we break out households by income, we find that extremely low-income households consistently make up the highest shares of households that experience rent burden, while middle income households consistently experience the lowest share of the groups measured. Very low-income households (31-50% AMI) saw the largest percentage point change in rent burden from 2011 to 2021, with a 4.0 percentage point increase in the share of those with moderate rent burden and a 5.1 percentage point decrease in the share of those experiencing severe rent burden.
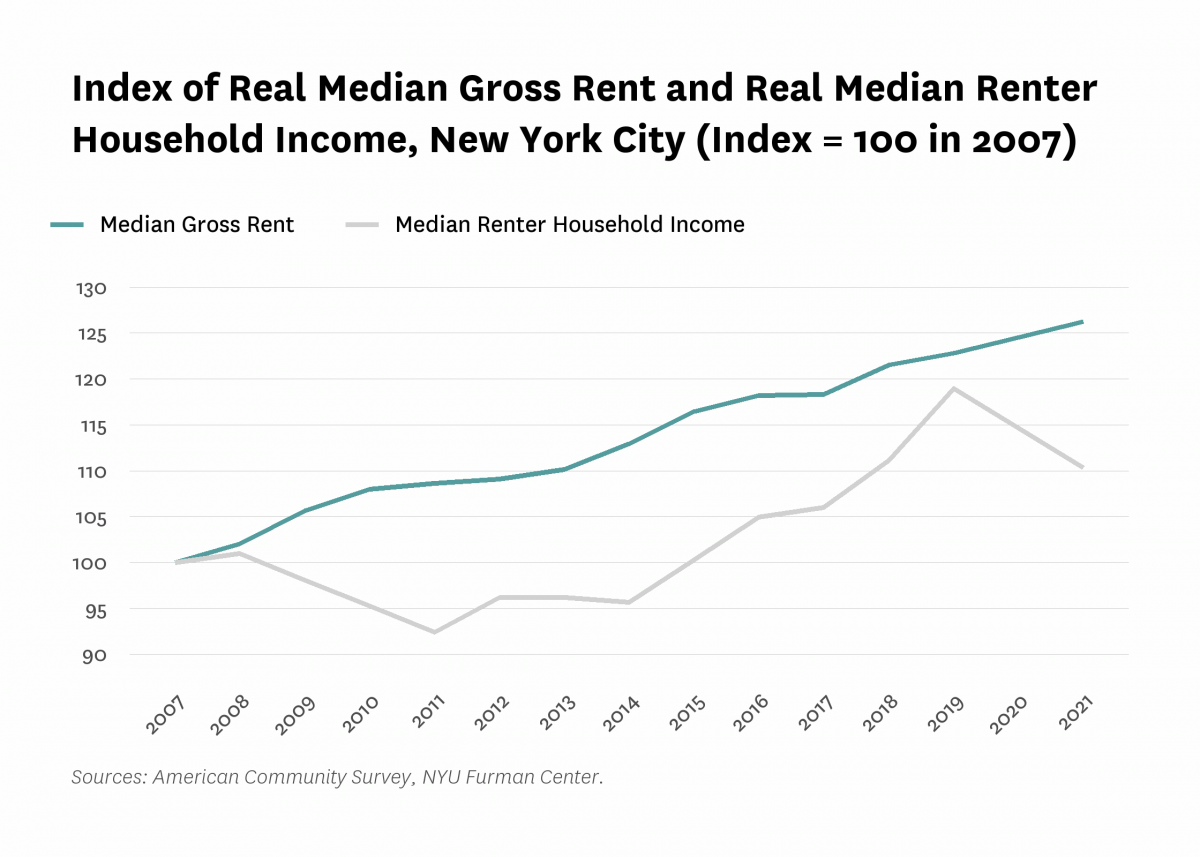
Real median renter household income plummeted after 2019, reversing a five-year trend of real median renter household income growing faster than median gross rent.
Between 2014 and 2019, the gap in growth between median gross rent and median renter household income gradually closed, with the growth of median renter household income having outpaced the rent growth. This trend broke after 2019. Real median renter household income decreased from 119 percent of its 2007 level in 2019 to 110 percent of its 2007 level in 2021. During the same period, median gross rent rose at a similar rate as that of the previous decade. The reason for steep income declines could be a shift in the composition of renters (with incomes falling because of higher income renters leaving the city during the pandemic–see discussion above of disproportionately large decrease of renters in Manhattan), or, it could be that incomes for renters declined overall.
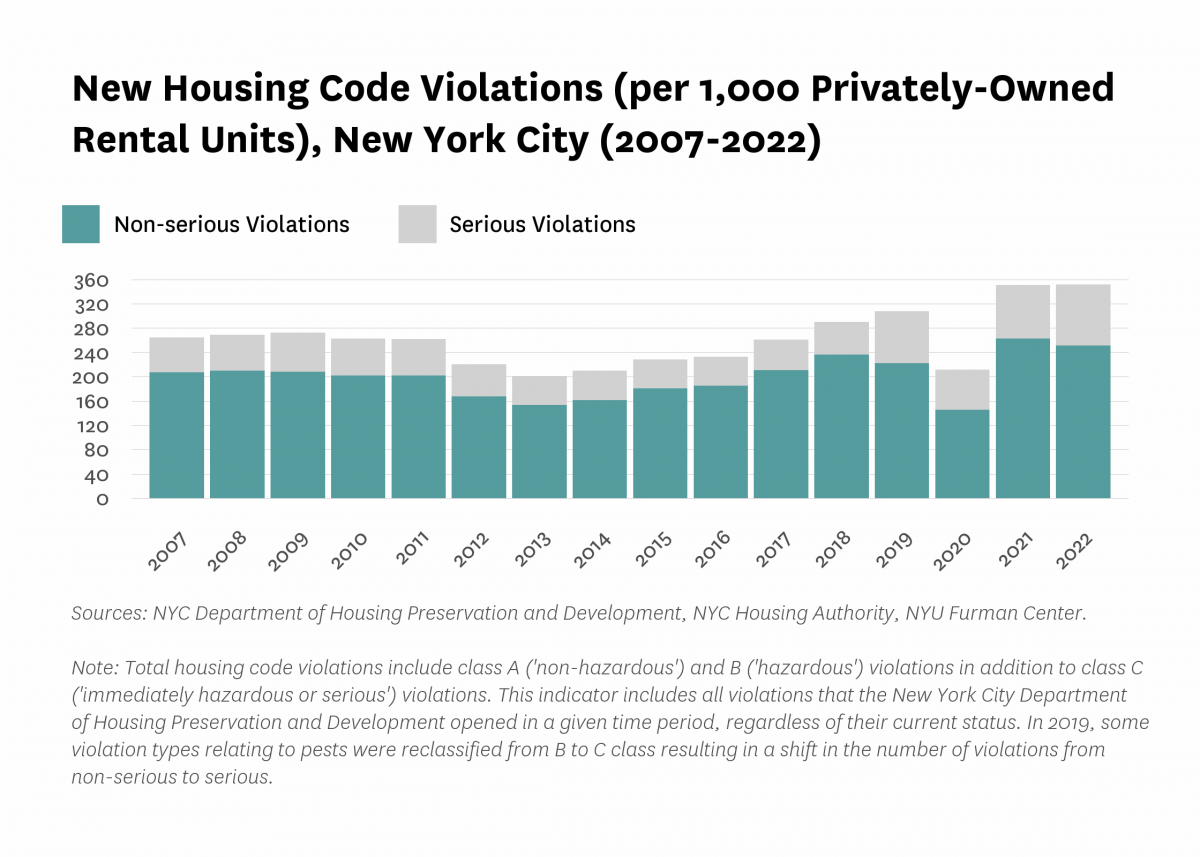
The record-high number of housing code violations issued by the Department of Housing Preservation and Development issued in 2021 persisted into 2022.
The rate of new housing code violations remained similar between 2021 and 2022, going from 351.0 violations per 1,000 privately-owned rental units in 2021 to 351.8 violations per 1,000 privately-owned rental units in 2022. Serious housing code violations–defined as violations that are immediately hazardous or serious–increased between 2021 to 2022 (from 88 per 1,000 privately-owned rental units to 100.1 per 1,000, respectively). The notably low numbers of housing code violations in 2020 may be due in part to the impact of the pandemic and concerns about transmission during housing code inspections. While last year we noted that it was unclear if 2021 was a year of HPD catching up on violations that normally would have been given in 2020, 2022’s data shows that the high level has sustained.
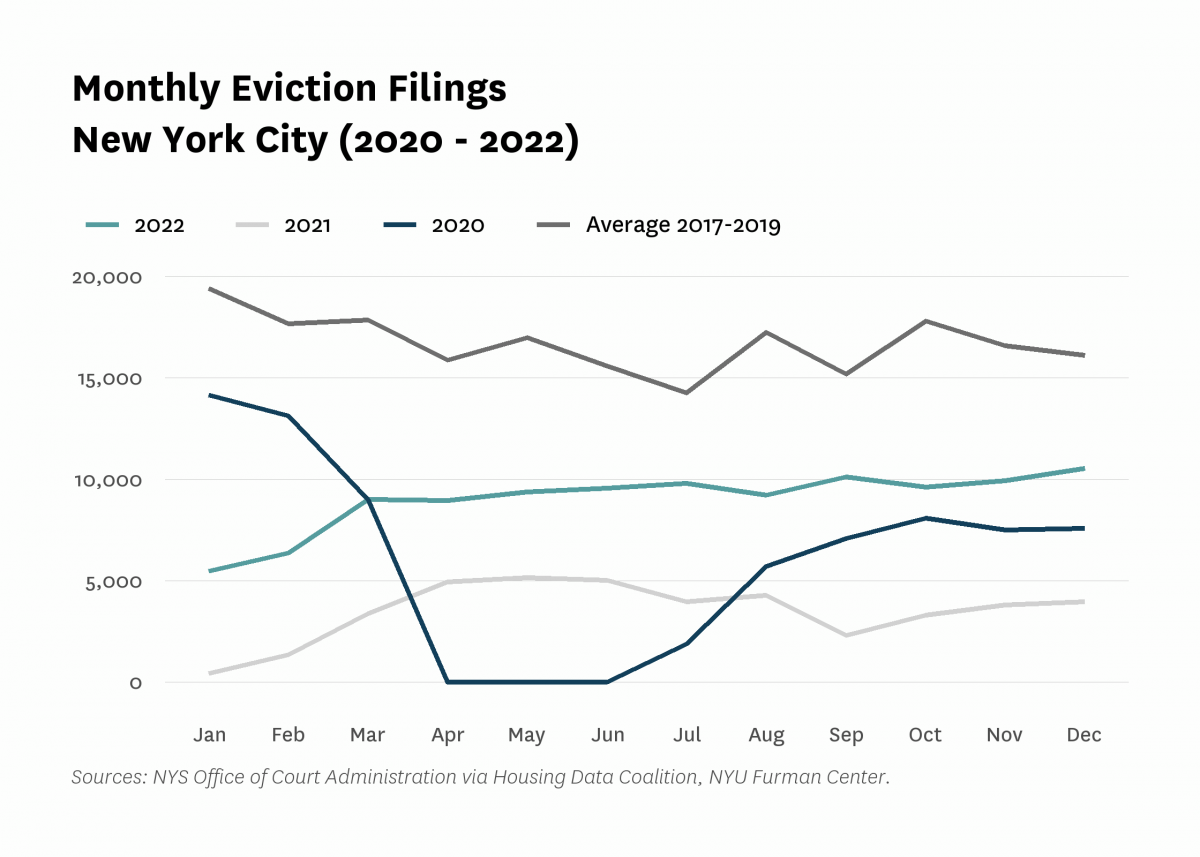
Monthly eviction filings in 2022 remained below pre-pandemic levels, but were above 2020 and 2021 levels.
By the end of January 2022, COVID-era eviction moratoria from state and federal sources such as the Governor’s Executive Order 202.8, New York’s COVID-19 Emergency Eviction and Foreclosure Prevention Act, and the nationwide eviction moratorium mandated by the Centers for Disease Control had ended. Monthly eviction filings in 2022 are thus higher than 2021 and most of 2020. Still, 2022 monthly eviction filings remain consistently lower than the average monthly evictions seen between 2017 and 2019. For a detailed timeline of the various eviction moratoria affecting eviction in New York City, see our eviction tracker.
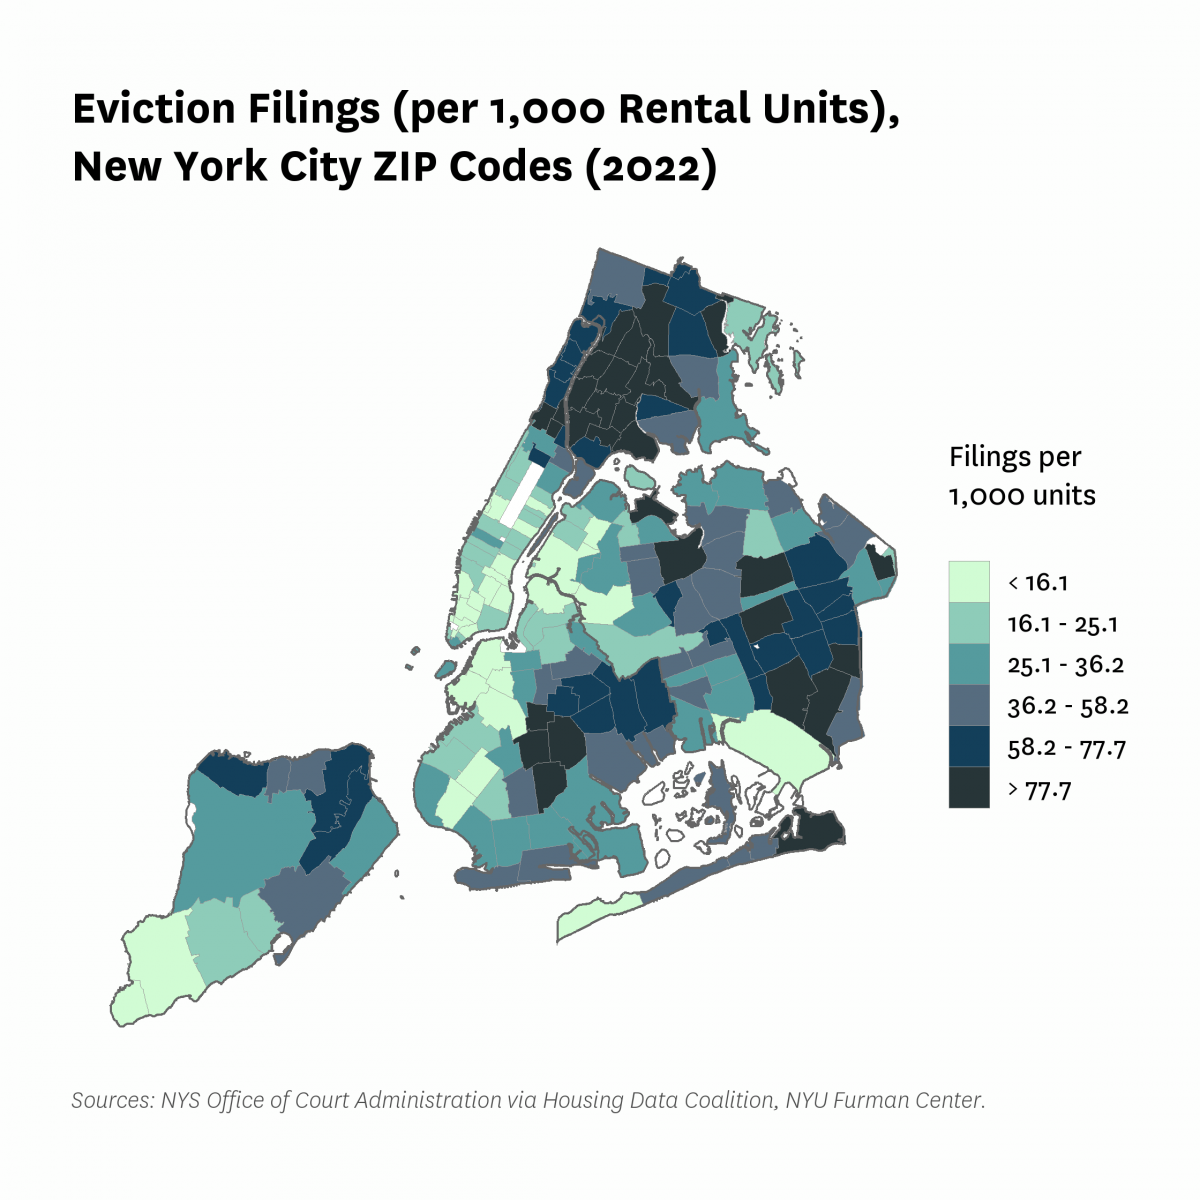
The Bronx, eastern Queens, and central Brooklyn experienced the highest rates of eviction filings in 2022.
Rates of eviction filing ranged widely throughout New York City in 2022, from rates as low as 0 eviction filings per 1,000 units in places including the Rockaway Peninsula to 200.6 eviction filings per 1,000 units near Springfield Gardens, Rochdale, and South Jamaica. Large portions of the Bronx experienced high rates of eviction filings, as well as Brooklyn neighborhoods in and near Flatbush and Queens neighborhoods in and near Jamaica.
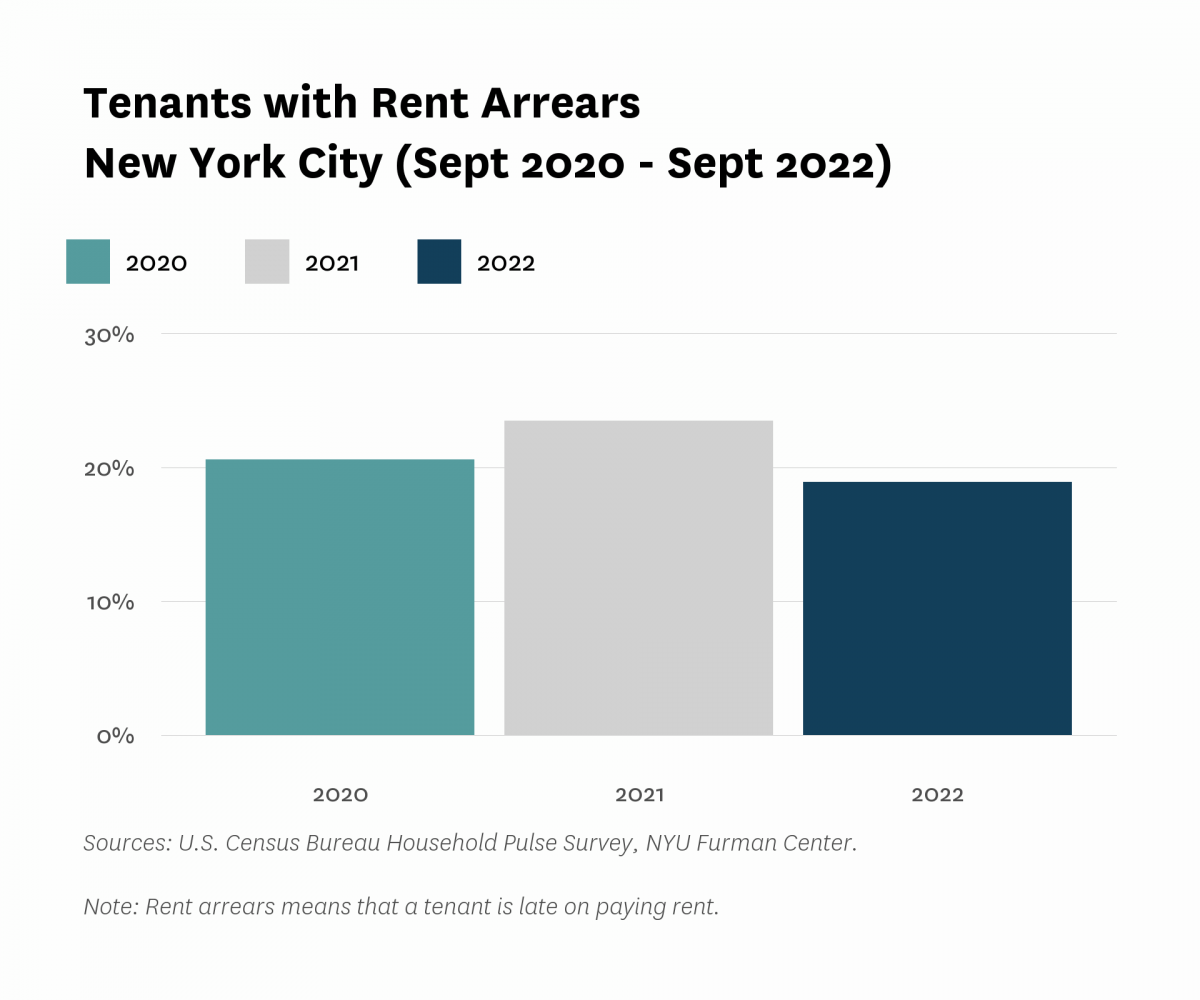
In 2022, the percent of households with rental arrears appeared to be below 2020 and 2021 levels.
Citywide, 19 percent of renters reported arrears in the U.S. Census Bureau's Household Pulse Survey in 2022. This share represents a 4.6 percentage point decrease from 2021 levels, and a 1.7 percentage point decrease from 2020 levels. The Pulse Survey is a new Census product that started in response to the pandemic, and thus cannot provide data to offer a pre-pandemic baseline comparison. It is worth noting that the sample size of this survey is relatively small - for that reason, it might be interpreted that shares of tenants reporting rent arrears have not changed all that much year over year.
All content © 2005 – 2024 Furman Center for Real Estate and Urban Policy | Top of page | Contact Us