Rental Assistance Need in Five of New York’s Mid-Sized Cities
The NYU Furman Center is working to help small and mid-sized cities across the country to examine their local housing challenges. If you would like assistance with duplicating this analysis in your city of under 500,000 residents please reach out to our Executive Director matthew.murphy@nyu.edu to discuss how we can help.
All code and data for our analysis of rental assistance need are available on GitHub.
Analyses of housing and urban policy often overlook renters in small and mid-sized cities. In this post, we pay special attention to this population by examining the impact of COVID-19 on renters in Albany, Buffalo, Rochester, Syracuse, and Yonkers, five critical regional anchors in New York State. We estimate the rental assistance need of renters who work in vulnerable occupations in these mid-sized cities.[1]
In our analysis, we find the following:
- We estimate that 33,700 renter households across Albany, Buffalo, Rochester, Syracuse, and Yonkers had at least one member lose their job due to the economic crisis.
- In aggregate, these renters owe $36.2 million in monthly rent.
- In each city, nearly one in three renter households was paying more than 50 percent of their income towards rent before the COVID-19 pandemic hit, leaving them with little room to save for emergencies.
- A large share of renter households in these cities reside in buildings with four or fewer units, whose owners are unlikely to be able to weather long periods of nonpayment.
- Standard Unemployment Insurance benefits are not sufficient to cover COVID-related income losses for renters. We estimate that on top of standard Unemployment Insurance benefits, renters in these five cities would need a total of $18.3 million in monthly rental assistance to help them cover rent and stay in their homes.
We estimate that 33,700 renter households across the five cities lost their job due to the economic crisis, likely leading to increased rates of non-payment on the $36.2 million in monthly rent this population owes.
Of the five cities we analyzed, Albany’s renter households were most vulnerable to job loss due to the crisis, with a total of 5,400 households (18%) estimated to lose $13.8 million in monthly wages (Table 1). We estimate that 3,600 of these households (or 12% of renter households in Albany) have been able to claim $4.8 million in monthly Unemployment Insurance benefits. However, the remaining 1,600 affected Albany households (or 6% of renter households in Albany) experiencing COVID-related job losses lost $2 million in monthly wages, but did not claim UI benefits. As shown in Table 1, some amount of enhanced UI benefits would go a long way to helping renters make up lost wages, but not all renters are able to claim these benefits.
Table 1
| Estimated renter households with lost income due to job loss | |||||
|---|---|---|---|---|---|
| Estimated number of households to have or have not received UI benefits | |||||
| Renter Households | Share of All Renter Households | Total Lost Wages (Monthly) | Total Standard UI Benefits (Monthly) | Total Standard and $300/week Enhanced UI Benefits (Monthly) | |
| UI Recipient Households | |||||
| Albany | 3.6K | 12.4% | $11.8M | $4.8M | $9.4M |
| Buffalo | 6.8K | 10.7% | $22.4M | $8.5M | $17.1M |
| Rochester | 4.7K | 8.9% | $14.6M | $5.9M | $11.7M |
| Syracuse | 3.0K | 9.4% | $9.4M | $3.9M | $7.6M |
| Yonkers | 5.2K | 11.8% | $20.5M | $7.2M | $13.8M |
| Total | 23.3K | 10.5% | $78.8M | $30.2M | $59.5M |
| UI Non-Recipient Households | |||||
| Albany | 1.6K | 5.5% | $2.0M | $0.0 | $0.0 |
| Buffalo | 3.3K | 5.3% | $4.4M | $0.0 | $0.0 |
| Rochester | 2.6K | 4.8% | $2.9M | $0.0 | $0.0 |
| Syracuse | 1.4K | 4.3% | $1.7M | $0.0 | $0.0 |
| Yonkers | 1.5K | 3.4% | $3.1M | $0.0 | $0.0 |
| Total | 10.4K | 4.7% | $14.2M | $0.0 | $0.0 |
Low-income households are the most vulnerable to falling behind on rent. We estimate that close to 10,000 renter households with pre-COVID incomes below 80 percent of Area Median Income (AMI) across the five cities have lost $50 million in monthly wages and are only receiving about $17 million in unemployment benefits (Table 2). As not all households receive UI benefits, we estimate that about 2,000 low-income renter households across the five cities have lost a total of $8 million in monthly wages, but do not receive any unemployment insurance benefits.
Table 2
| Estimated renter households (with pre-COVID incomes below 80% AMI) with lost income due to job loss | ||||
|---|---|---|---|---|
| Estimated number of households to have or have not received UI benefits | ||||
| Renter Households below 80% AMI with job loss | Total Lost Wages (Monthly) | Total Standard UI Benefits (Monthly) | Total Standard and $300/week Enhanced UI Benefits (Monthly) | |
| UI Recipient Households | ||||
| Albany | 1K | $7M | $3M | $4M |
| Buffalo | 3K | $15M | $5M | $9M |
| Rochester | 2K | $9M | $3M | $6M |
| Syracuse | 1K | $6M | $2M | $4M |
| Yonkers | 2K | $13M | $4M | $6M |
| Total | 10K | $50M | $17M | $30M |
| UI Non-Recipient Households | ||||
| Albany | 293 | $1M | $0 | $0 |
| Buffalo | 778 | $3M | $0 | $0 |
| Rochester | 554 | $1M | $0 | $0 |
| Syracuse | 266 | $875K | $0 | $0 |
| Yonkers | 475 | $2M | $0 | $0 |
| Total | 2K | $8M | $0 | $0 |
In each city, nearly one in three renter households were paying more than 50 percent of their income towards rent when the pandemic hit.
Many renters hit by COVID-related job losses were already rent burdened prior to the crisis. Over 30 percent of renter households were severely rent burdened (paying more than half of their incomes on rent) prior to the pandemic (Table 3). There is variation between cities: Buffalo and Syracuse had the lowest share of renter households that were severely rent burdened at 30 percent; Yonkers had the highest share at 37 percent. The high rates of severe rent burden are likely driven by a high number of households with incomes too low to afford the existing rental housing across all five cities. These households are particularly susceptible to housing instability resulting from income loss due to COVID-19.
Table 3
| Estimated number of renter households by pre-COVID rent burden and income | |||||||
|---|---|---|---|---|---|---|---|
| Total Population | Renter Households | Renter Share of Households | Number of Renter Households Severely Rent Burdened (Pre-COVID) | Share of Renter Households Severely Rent Burdened (Pre-COVID) | Number of Renter Households with Incomes Below 80% AMI (Pre-COVID) | Share of Renter Households with Incomes Below 80% AMI (Pre-COVID) | |
| Albany | 94.7K | 29.3K | 64.4% | 9.5K | 32.3% | 21.5K | 73.3% |
| Buffalo | 247.0K | 63.4K | 57.9% | 18.7K | 29.5% | 45.7K | 72.1% |
| Rochester | 196.0K | 53.1K | 62.6% | 17.4K | 32.9% | 40.2K | 75.7% |
| Syracuse | 127.3K | 32.0K | 59.3% | 9.5K | 29.9% | 23.0K | 71.9% |
| Yonkers | 196.4K | 43.9K | 55.4% | 16.4K | 37.4% | 33.1K | 75.4% |
| Total | 861.5K | 221.6K | 59.4% | 71.5K | 32.3% | 163.4K | 73.7% |
COVID-19 has caused a dramatic increase in unemployment. We find that in each of the cities, at least 15 percent of renters with employment income lost their job because of COVID-19 (Table 4). The scale is large – when comparing employment by industry in February 2020 to August 2020, we estimate that 11,000 wage earning renters lost income in Buffalo, while 7,900 lost income in Rochester, 7,600 in Yonkers, 5,800 in Albany, and 4,800 in Syracuse.
Table 4
| Estimated Number of Renters by Wage Earning Status | ||||
|---|---|---|---|---|
| Renter Population | Number of Wage Earning Renters | Number of Wage Earning Renters Estimated to Lose Income Due to Job Loss | Share of Wage Earning Renters Estimated to Lose Income Due to Job Loss | |
| Albany | 59.6K | 33.7K | 5.8K | 17.2% |
| Buffalo | 143.0K | 68.0K | 11.0K | 16.2% |
| Rochester | 116.9K | 52.8K | 7.9K | 15.0% |
| Syracuse | 78.5K | 29.2K | 4.8K | 16.4% |
| Yonkers | 102.0K | 48.9K | 7.6K | 15.5% |
| Total | 500.0K | 232.7K | 37.1K | 15.9% |
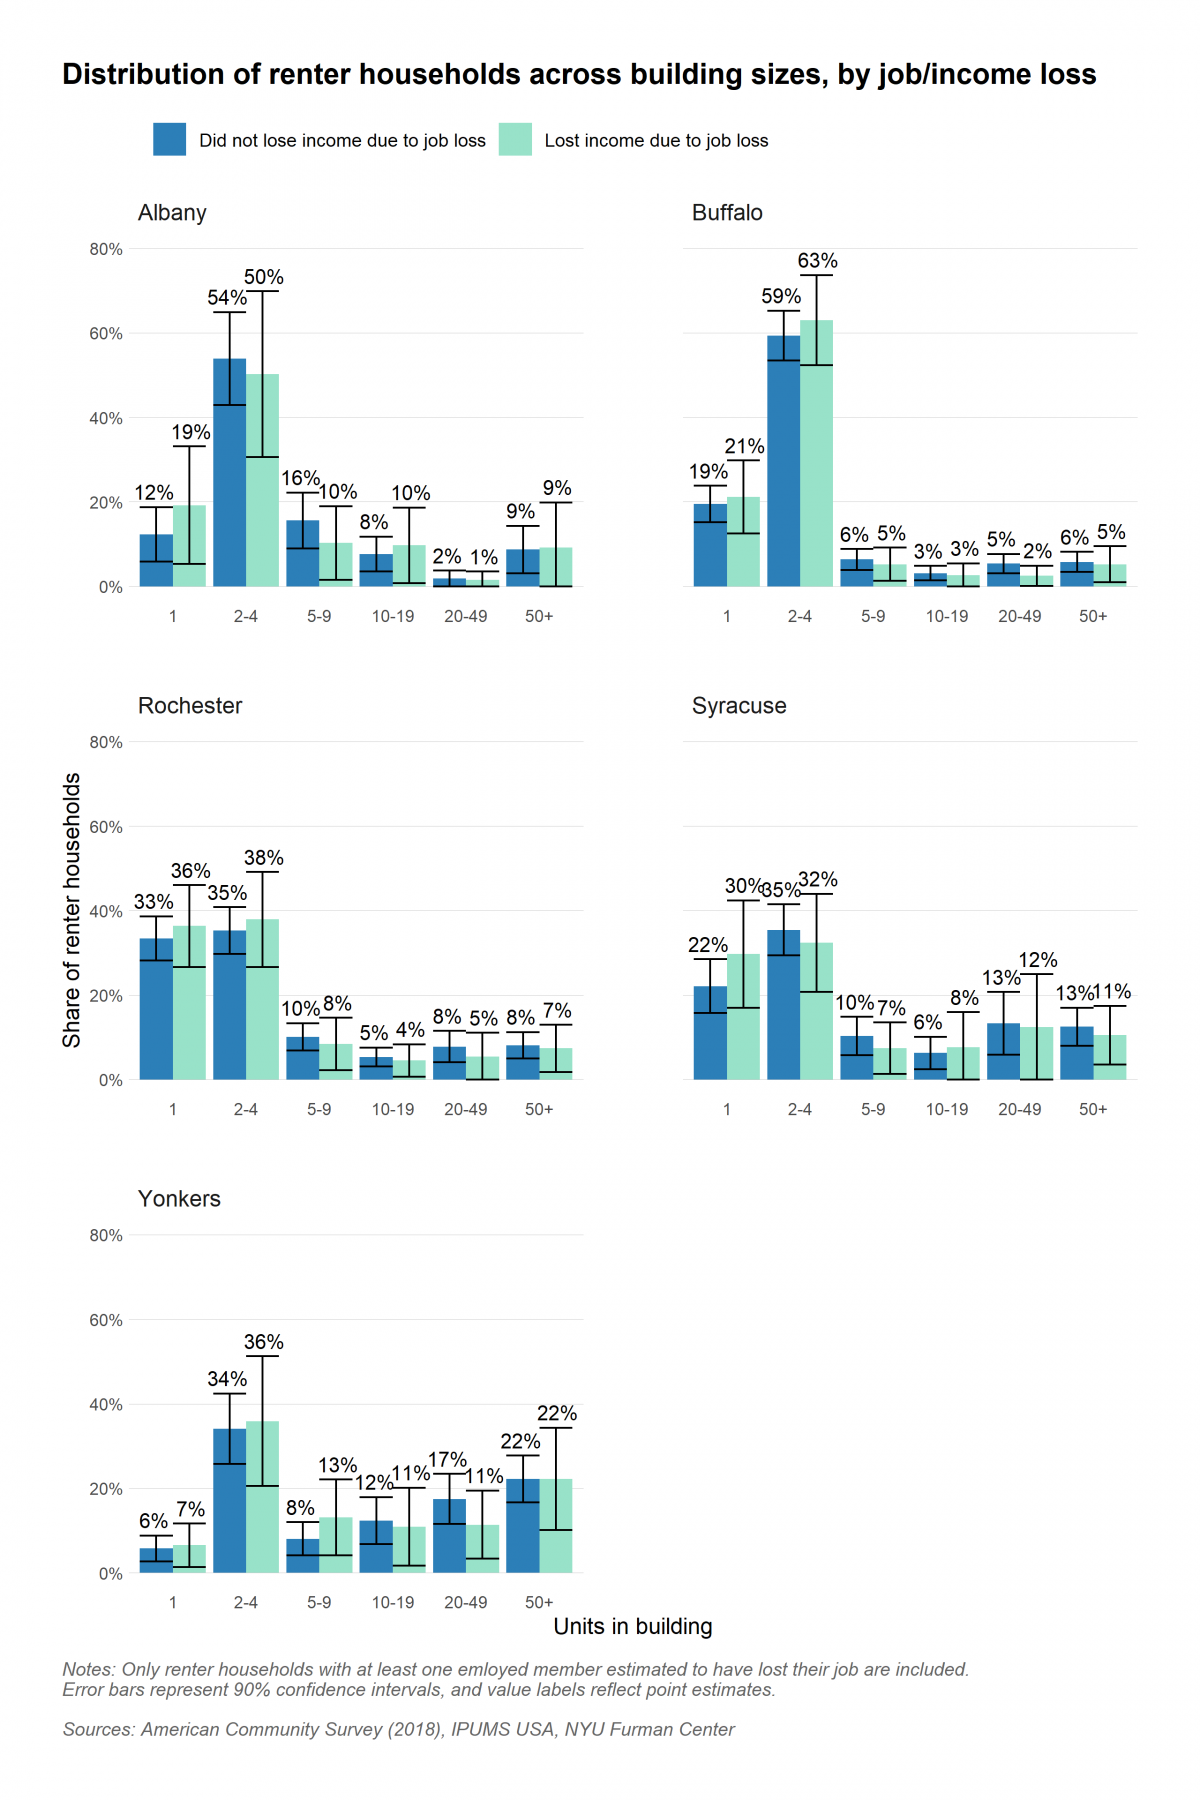
Rent shortfalls will acutely affect smaller properties, as a large share of renter households in these cities reside in buildings with four or fewer units.
Overall lost income is likely to translate to a reduced ability to pay rent, putting a strain on property owners as well. Our analysis shows that many, if not most, renters in these cities live in smaller multifamily buildings. In Albany and Buffalo, at least half of renter households live in small multifamily buildings (between 2 and 4 units) (Figure 1). In Yonkers, Syracuse, and Rochester, at least a third of renter households live in buildings with between two and four units. Furthermore, a substantial minority of vulnerable renters in each city, with the exception of Yonkers, rent single family homes.[2]
Smaller buildings tend to be owned by smaller-scale landlords who are less able to weather long periods of non-payment. Further, owners of smaller buildings are more likely to be people of color than owners of larger buildings, raising concerns that the current crisis will exacerbate existing racial and ethnic disparities in property ownership and wealth, echoing the disparate impacts of the 2008 foreclosure crisis.
Figure 1:
Our model shows that households affected by COVID-related job losses and living in smaller properties would need rental assistance to get back to their pre-COVID rental burden or a 30 percent rental burden, whichever is higher. Across the five cities, 23,000 of the 33,700 total rental households affected by lost income live in properties with four or fewer units (Table 5). That population pays a total of $25.1 million in rent each month, likely to smaller-scale landlords, and would require a total of $12 million in rental assistance each month, even after accounting for standard UI benefits.
Table 5
| Estimated rental assistance need for households in 1-4 unit properties with lost income due to job loss | |||||||
|---|---|---|---|---|---|---|---|
| Renter Households in 1-4 Unit Properties | Total Rent (Monthly) | Average Rent (Monthly) | Total Lost Wages (Monthly) | Rental Assistance Need - No UI Benefits (Monthly) | Rental Assistance Need - Standard UI Benefits (Monthly) | Rental Assistance Need - Standard Plus $300/week Enhanced UI Benefits (Monthly) | |
| Albany | 4K | $4.5M | $1,192 | $10.2M | $3.2M | $2.4M | $932.1K |
| Buffalo | 9K | $8.1M | $942 | $20.8M | $4.8M | $3.3M | $1.3M |
| Rochester | 5K | $5.2M | $989 | $12.2M | $3.1M | $2.6M | $1.0M |
| Syracuse | 3K | $2.7M | $977 | $6.5M | $1.8M | $1.4M | $487.8K |
| Yonkers | 3K | $4.5M | $1,569 | $8.8M | $3.0M | $2.0M | $859.9K |
| Total | 23K | $25.1M | $1,075 | $58.6M | $16.0M | $11.7M | $4.6M |
Standard Unemployment Insurance benefits are not enough to help renters experiencing COVID-related job loss afford their rent. We estimate that on top of standard UI benefits, renters in these five cities need a total of $18.3 million in monthly rental assistance to help maintain housing stability.
With only standard UI benefits available, households in the five cities collectively need about $18.3 million per month to get back to their previous rent burden or a 30 percent burden, whichever is higher (Table 6). Even with UI benefits, there would still be a need for further rental assistance. We estimate that to bring households in Yonkers to their previous rent burden or a 30 percent burden, for example, when incorporating replacement income from standard UI and enhanced $300 per week benefits, an additional $2.4 million would still be needed monthly. Most of those additional funds would go towards households that do not, or are unable to, claim benefits.
Table 6
| Estimated rental assistance need for households with lost income due to job loss | |||
|---|---|---|---|
| Separated by target rent-to-income ratio | |||
| No UI Benefits (Monthly) | Standard UI Benefits (Monthly) | Standard Plus $300/week Enhanced UI Benefits (Monthly) | |
| Higher of pre-COVID rent-to-income ratio or 30% rent-to-income ratio | |||
| Albany | $4.1M | $3.2M | $1.2M |
| Buffalo | $5.8M | $4.2M | $1.7M |
| Rochester | $4.2M | $3.4M | $1.4M |
| Syracuse | $2.8M | $2.2M | $929.6K |
| Yonkers | $7.2M | $5.3M | $2.4M |
| Total | $24.0M | $18.3M | $7.6M |
Restricting rental assistance to households with pre-COVID incomes below 80 percent of their local area median decreases the cost of assistance significantly. The cost of providing rental assistance with standard UI benefits in Albany drops by 79 percent when restricting to households that were low-income before the crisis, but it only drops by 64 percent in Syracuse (Table 7).
Table 7
| Estimated rental assistance need for households with lost income due to job loss | |||
|---|---|---|---|
| Separated by pre-COVID income level | |||
| No UI Benefits (Monthly) | Standard UI Benefits (Monthly) | Standard Plus $300/week Enhanced UI Benefits (Monthly) | |
| All households | |||
| Albany | $4.1M | $3.2M | $1.2M |
| Buffalo | $5.8M | $4.2M | $1.7M |
| Rochester | $4.2M | $3.4M | $1.4M |
| Syracuse | $2.8M | $2.2M | $929.6K |
| Yonkers | $7.2M | $5.3M | $2.4M |
| Total | $24.0M | $18.3M | $7.6M |
| Households with pre-COVID income below 80% AMI | |||
| Albany | $1.1M | $685.4K | $386.6K |
| Buffalo | $2.0M | $1.0M | $568.5K |
| Rochester | $1.3M | $885.2K | $474.1K |
| Syracuse | $1.1M | $792.7K | $426.1K |
| Yonkers | $2.4M | $1.6M | $1.0M |
| Total | $7.8M | $4.9M | $2.9M |
Conclusion
COVID-19 and the ensuing economic crisis has affected every community in New York State. Mid-sized cities are no exception, and the lower-income and rent-burdened households that call those cities home are at particular risk of homelessness due to the economic consequences of the pandemic. Their landlords, typically owners of small buildings, are also vulnerable to nonpayment. The data show that a substantial amount of rental assistance is needed to stabilize renters and their landlords in cities across the state.
Methods: Estimating the need for rental assistance in five mid-sized New York cities.
In the analysis above, we estimate income losses and the need for rental assistance by measuring job loss by industry. To do so, we rely on the Bureau of Labor Statistics' Current Employment Statistics to estimate unemployment by industry, closely approximating the methodology of Strochak et al.[3] We then apply these job losses to Census Bureau microdata to simulate job loss and access to UI at the individual level in each of the five cities. Not every person who loses their job or a substantial number of work hours and income is able to receive UI. Some workers are ineligible due to income, employment type, or immigration status, while others may never apply or experience difficulty navigating the application process and ultimately are unable to successfully apply. Drawing on an analysis by James Parrott and Andrew Stettner, we assume that 67 percent of households that experience job loss claim UI benefits. Our full code for this analysis is available for review on GitHub.
We consider how different levels of UI benefits on the total rental assistance shape need at the local level. The CARES Act expanded eligibility for UI benefits, extended coverage of base UI benefits from 26 to 39 weeks in New York State, and added a flat supplement of $600 per week to base UI payments, which expired at the end of July. More recently, the Lost Wages Assistance program allocated a limited amount of federal disaster funds to provide a $300 weekly supplement to jobless workers who already qualify for at least $100 in UI benefits. The New York State Department of Labor estimated that at least 2.1 million New Yorkers are eligible for these payments, and FEMA approved and released six weeks of retroactive funding to New York before the program funding was exhausted. In this analysis, we estimate the rental assistance need under $300/week benefits, base UI benefits, and no UI benefits (once benefit terms expire).
Correction: the original version of this post included Public Use Microdata Areas that covered marginal areas of Rochester and Syracuse when calculating figures for those cities. This post has been updated to restrict the level of geographic analysis to more closely reflect the cities’ boundaries.
[1] In two previous analyses, we examined the scope of the problem facing renters and landlords in New York State and in New York City. We identified the renter households most vulnerable to job loss due to the pandemic, examined the types of housing in which they live, and calculated the magnitude of the rent shortfall for those households with and without enhanced Unemployment Insurance (UI) benefits.
[2] Due to sample size, the difference in the distribution of vulnerable and less vulnerable households is not significant in any city reviewed.
[3] In our previous analyses, we relied on publicly available data on New York State UI claims from the height of the crisis. However, UI claims do not adjust for workers that stop receiving unemployment, an increasingly important issue as New York State has continued to reopen. In this iteration of our analysis, we instead use data from the Bureau of Labor Statistics’ Current Employment Statistics (CES) program for New York State, and compare employment levels from February 2020 to August 2020 to estimate the scale of COVID-related job loss by industry through August. We then use 2018 ACS data to estimate a ratio of renter unemployment to overall unemployment by industry. Using this ratio, we adjust our unemployment estimates to account for the fact that renters are more likely to be unemployed than homeowners within the same industry. This updated approach only captures job loss, whereas UI claims also capture workers experiencing significantly reduced hours of employment. However, it better allows us to estimate the scope of current job loss given the fact that many employees have returned to work since the peak of the state’s unemployment.