COVID-19 and the Rental Market
The economic fallout from the COVID-19 pandemic has led to unprecedented job losses around the United States. Over 30 million Americans have filed for unemployment over the last six weeks. Our previous analysis of professions most vulnerable to immediate job loss from the pandemic and the associated public health response found that about 1,405,000 (or 34 percent) of New York City wage earners may be at immediate risk of lost income—that does not include those indirectly affected as the economic shock and decreased demand spread through the economy. Such massive income shocks will make it difficult for many New Yorkers to afford rental payments, and could ultimately pose a threat to housing stability without a robust policy response.
If renters do not receive adequate income support, whether through unemployment insurance, rental assistance, or another emergency program, they are less able, and therefore less likely to pay rent in accordance with their lease. With less rental revenue, many landlords may not be able to keep up maintenance, keep building staff employed, or make mortgage payments. A surge of tenants may face eviction after New York’s eviction moratorium expires. Thus, housing market interventions may be necessary supplements to ongoing interventions in the labor market; without them, what began as a public health crisis, and has become a labor market crisis, could soon also become a housing market crisis.
To shed light on how the potential non-payment of rent may be felt in the housing market, this analysis examines the housing stock occupied by renters in especially economically vulnerable professions. It also assesses which New York City neighborhoods are most vulnerable to non-payment of rent and the characteristics of the renters and housing stock in those neighborhoods.
As this analysis shows, all types of rental housing face the possibility of serious disruption, with smaller buildings and buildings in lower-income neighborhoods at greater risk. Renters in more economically-vulnerable professions are more likely than renters in less economically vulnerable professions to live in small buildings, particularly in 2-4-unit buildings. They struggle with higher rates of rent burdens, and tend to live in the neighborhoods where many other lower-income households face higher rates of rent burdens. Low-Income Housing Tax Credit buildings and rent-stabilized units are somewhat more common in these at-risk neighborhoods, while public housing is spread more evenly across higher-risk and lower-risk parts of the city.
But no neighborhood, and no type of housing, is likely to be unaffected. Any response limited to one type of building, one subsidy stream, or one type of neighborhood will miss large shares of the affected population and housing. Data examining the geography of the impact, the characteristics of buildings and owners most likely to face financial distress, and the makeup of vulnerable households is crucial as leaders grapple with this looming crisis.
Background and Methodology
This analysis focuses on renters rather than homeowners, as the most immediate housing impacts in New York City are likely to be concentrated among renters. As an earlier Furman Center analysis found, the majority of households with at least one member working in a more economically vulnerable profession were renters. More than 85 percent of households with one member in a more economically vulnerable occupation and with household income below $50,000 were renters. At the same time, as the Urban Institute has noted, federal relief to date has provided mortgage forbearance to 70 percent of homeowners with a mortgage, while the relief to renters has provided more limited benefits and to a smaller share of households. Given that renters are more vulnerable, we foresee greater immediate impacts in the rental market than the homeownership market.
Building off our earlier analysis, our predictions for economic vulnerability do not take into account either the distribution of federal assistance—whether through expanded unemployment insurance, the Paycheck Protection Program, or direct stimulus spending—or second-order economic disruption stemming from the overall decline in economic activity. These predictions, for now, look only at which households are most likely to suffer from job losses directly connected to the pandemic.
We identify the size of the buildings where households live using 2018 American Community Survey data, the most recent data available for this analysis. We also examine variation across neighborhoods. For this analysis, we classified New York City Sub-Borough Areas (SBAs), also referred to as PUMAs, into three categories based on the proportion of renter households with members in vulnerable industries:
- Highly Economically Vulnerable SBAs: 60% or more of renter households contain at least one member in a more vulnerable occupation,
- Moderately Economically Vulnerable SBAs: 40% to 60% of renter households contain at least one member in a more vulnerable occupation, or
- Less Economically Vulnerable SBAs: less than 40% of renter households contain at least one member in a more vulnerable occupation.
The largest number of New Yorkers live in moderately economically vulnerable SBAs: around 3 million. Around 1.9 million people live in the less economically vulnerable SBAs, while roughly 1.4 million New Yorkers live in highly economically vulnerable SBAs.
Reviewing SBAs according to these categories, we examine the housing characteristics of each group. We examine data on rental prices, including the proportion of renters in each category of neighborhood that are rent burdened and the median gross rent. We also examine the number of rent stabilized properties in SBAs with higher or lower vulnerable renter household shares. Finally, we examine the prevalence of certain types of subsidized housing in each neighborhood vulnerability category. For this analysis, we count all residential units within properties that have a subsidy, regardless of whether individual units receive government subsidies. The subsidy program categories are not mutually exclusive.
You can find our occupation categorization here, and all of the data and code for this analysis are available on our GitHub. Again, we invite your advice and feedback.
Findings
Renters in more vulnerable occupations live in all sizes of buildings, but are more likely to live in small buildings
As interventions into the housing market become necessary, targeting those interventions properly requires understanding the housing circumstances of those affected. Public policy will, in effect, be allocating losses between tenants, landlords, lenders, and the government; one important factor in making that decision is what losses building owners are able to sustain. Similarly, policymakers will have to decide whether to route assistance through tenants or landlords, a question that turns in part on the size and sophistication of affected owners.
Our analysis shows that more economically at-risk renters live in all sizes of building. However, more-at-risk renters are more likely to live in smaller buildings. Most notably, 26 percent of vulnerable renters live in 2-4-unit properties, as compared to just 20 percent of other renters. At the other extreme, only 28 percent of more vulnerable renters live in buildings with 50 or more units as compared to 37 percent of other renters.
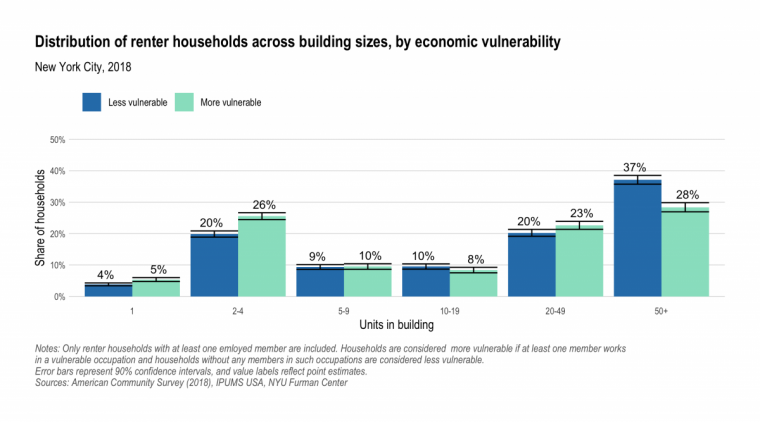
These data show that more-vulnerable renters disproportionately live in smaller buildings—though, as with the general population, substantial shares live in large buildings as well. All sizes of building are likely to see substantial impacts in the coming months, but small building owners appear especially vulnerable to lost rental income.
More vulnerable renters are more rent burdened, while paying lower rents
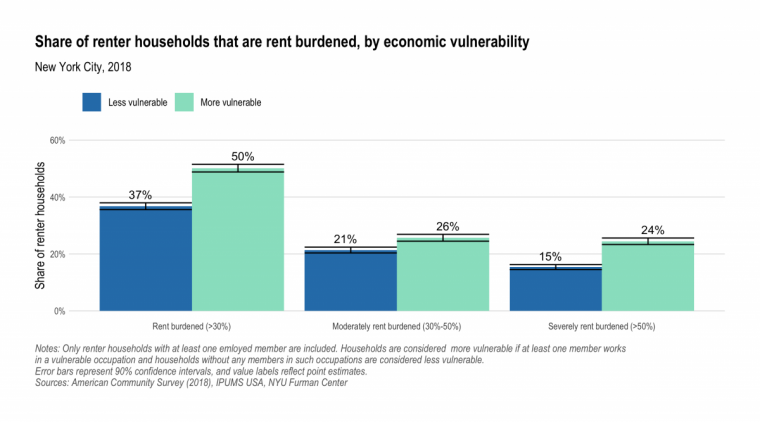
Renter households with one more economically vulnerable member were already more likely to face difficult housing market conditions. Fifty percent of more vulnerable renter households were rent burdened before the current crisis, paying more than 30 percent of their income towards rent. Only 37 percent of less vulnerable households were similarly rent burdened. More vulnerable households were also substantially more likely to be severely rent burdened, paying more than half of their income towards rent (24 percent of more vulnerable households vs 15 percent of less vulnerable households).
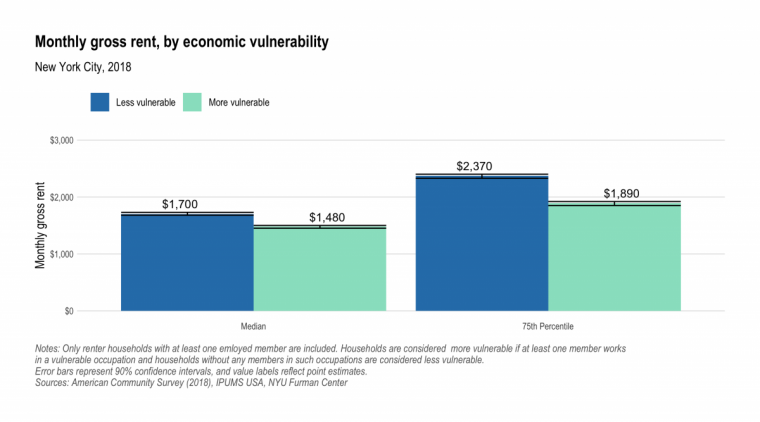
These rent burdens exist despite more vulnerable households paying lower absolute rents. More vulnerable renter households pay a median gross rent of $1,480 per month, as compared to $1,700 among less vulnerable households. The gap is larger at the 75th percentile: $1,890 vs. $2,370.
COVID’s impact on renters will be felt citywide—with neighborhoods with high pre-existing rent burdens likely to be hardest-hit
All neighborhoods are likely to see serious disruption to their rental markets, but some neighborhoods have many more households with members employed in more economically-vulnerable professions.
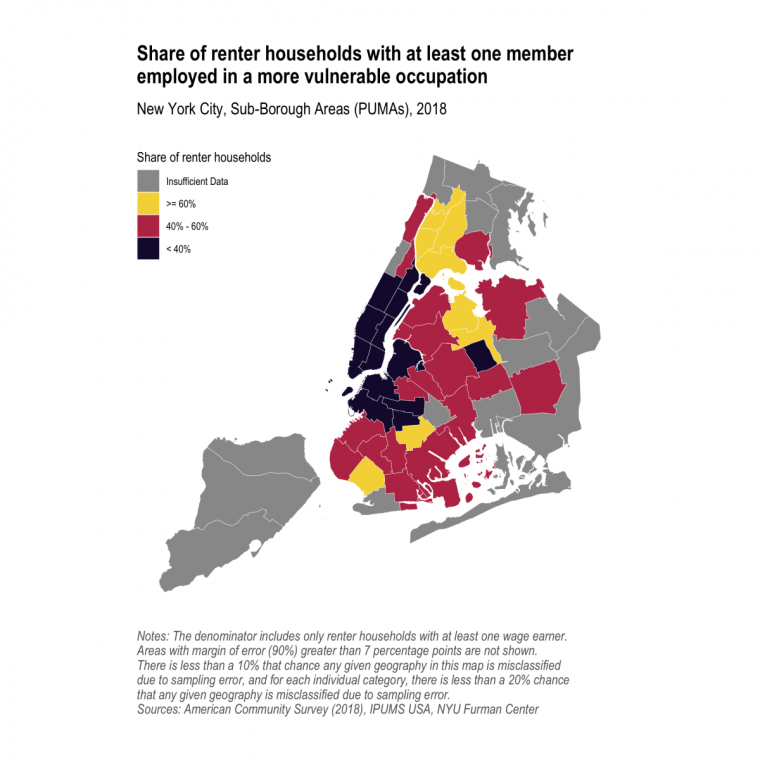
The neighborhoods with the largest shares of more economically vulnerable households are concentrated in the South Bronx and in Northern Queens, as well as a few parts of Brooklyn. Most of the neighborhoods with the smallest shares of more vulnerable households are located in Manhattan below 125th Street and in Northwest Brooklyn.
These locations map onto existing housing market inequalities. The neighborhoods with the most economically vulnerable households had more rent burdened households than neighborhoods with fewer at-risk households (60 percent of households rent burdened compared to 44 percent). Those neighborhoods also had lower median gross rents ($1,870 compared to $1,242). Put differently, these neighborhoods were home to many service-sector workers who were already struggling to pay rent, even in lower-rent neighborhoods.
Understanding these disparities may indicate that, in the long run, specific place-based interventions could be required. The foreclosure crisis of the last recession taught us much about the ripple effects of financially distressed housing. Foreclosures can reduce property values and increase crime in the surrounding neighborhood—and concentrated foreclosures can do so to a still-greater extent. As rental non-payment leads to landlords falling behind on their mortgages, some areas may see neighborhood-wide effects that last well beyond the pandemic. These could be compounded by the current crisis’s serious consequences for small businesses, especially those owned by people of color. Targeted interventions may be needed to respond to—and ideally prevent—location-specific economic disruptions.
However, despite these inequalities, no neighborhood is likely to avoid serious issues with rent non-payment altogether. The areas with the lowest share of renter households in economically-vulnerable jobs still had 15, 20, or 25 percent of renter households with one more-vulnerable member, and neighborhoods like East Harlem or Crown Heights, with just under 40 percent of renter households having one more-vulnerable member, can still be classed as relatively low-vulnerability. Job losses on this scale could substantially affect the rental market, even as other neighborhoods face greater challenges still.
Public housing, Low-Income Housing Tax Credit (LIHTC) housing, and rent-stabilized housing are prevalent across all neighborhoods. A higher share of rental housing in more at-risk areas is LIHTC or rent-stabilized when compared to less at-risk areas, while public housing is more evenly distributed.
Properly structuring a rental market intervention requires an assessment of the regulatory status of the affected housing stock. The options available, and the interests at stake, may differ based on whether the non-payment of rent is concentrated in particular developments already bound up in relationships with government agencies. In this section we highlight the distribution of public housing and LIHTC housing—the two largest portfolios of federally financed or assisted housing—as well as rent-stabilized housing in the areas of focus.
Each of these programs adjusts rents differently in response to changes in tenant income. In public housing, rents adjust up or down along with incomes, whereas in LIHTC housing, rents are not tied to income after initial tenant move-in. In rent-stabilized housing, rents do not adjust based on individual tenants’ income, but the Rent Guidelines Board may consider overall affordability in setting annual, citywide rent adjustments. Thus, each program allocates the burden of lost tenant income differently between landlords and tenants. Additionally, public housing receives ongoing federal operating subsidies, while LIHTC and rent-stabilized housing do not.
All areas contained similar proportions of residential units in public housing. While 5.7 percent of residential units in highly vulnerable neighborhoods were NYCHA units, 5.0 percent and 5.1 percent of units were NYCHA units in moderately and less vulnerable neighborhoods, respectively. In contrast, highly vulnerable neighborhoods had a higher share of total units in properties financed by the Low-Income Housing Tax Credit (5.5 percent of rental units compared to 3.4 percent of rental units). Finally, the share of all housing units that are rent stabilized is greatest in highly vulnerable neighborhoods. We estimate that about 41 percent of housing units in highly vulnerable neighborhoods are rent stabilized, compared to just 24 percent in less vulnerable neighborhoods, and 25 percent in moderately vulnerable neighborhoods.
The non-payment of rent due to COVID-related economic disruption is not likely to be limited to market-rate apartments or to particular subsidy programs. While additional data would be necessary to determine whether the individual households facing job losses lived in these subsidized or regulated forms of housing, as opposed to living in neighborhoods with higher concentrations of such housing, these data indicate that any rental market interventions will need to be coordinated with multiple existing regulatory schemes, and informed by an understanding of specific program rules.
Conclusion
The impact of the COVID crisis on New York City’s labor market has been unprecedented. Even with existing federal relief efforts, many renters will likely struggle to pay their rent in the months moving forward, which will bring this economic crisis into the housing market. This analysis shows that different neighborhoods and different types of buildings are at risk of greater rates of rent non-payment. In particular, the renters most likely to see economic disruption from the COVID crisis tend to live disproportionately in smaller buildings, where owners may have fewer resources to weather long periods of non-payment.
Additionally, renters most likely to see economic disruption pay lower rents and face higher rent burdens. They also live in neighborhoods with lower rents, higher rent burdens, and more properties supported by the LIHTC program or that are rent-stabilized. Without an adequate intervention, these areas could face additional long-run challenges, as evictions and foreclosures may contribute to compounding harms at the neighborhood scale.
However, the economic disruption from COVID is so broad, and New York City’s rental housing stock so diverse, that no neighborhood and no sector of the housing market is likely to be spared. Conversely, there is no sector of the rental housing market in which COVID-related job losses will be so disproportionately concentrated that it poses a natural target for assistance. Rather, any intervention limited to one housing program’s portfolio, or targeted at one class of building, may be too narrow an instrument.
These data suggest that designing a building-based approach that is workable for all of New York’s many kinds of housing may prove challenging, as tailored approaches for each of the city’s specific building types might prove necessary. Policymakers should prioritize flexibility in designing any housing market response to the COVID crisis, whether tenant-based or project-based