2019 Data on New York City’s Housing Stock
During 2019, the City of New York permitted the highest number of housing units since 2008, with the exception of a spike in 2015. Despite this recovery, permitted production was short of pre-recession levels. While permit activity increased, builders completed fewer units in 2019 compared to 2018, but this overall level was higher than completions in the first half of the decade. Of the 24,566 new units completed in 2019, more than half were located in six Sub-Borough Areas in Manhattan, Queens, and Brooklyn. New units added made up less than one percent of the city’s housing stock. The City also designated five historic districts in 2019, extending protections to the highest number of lots since 2015.
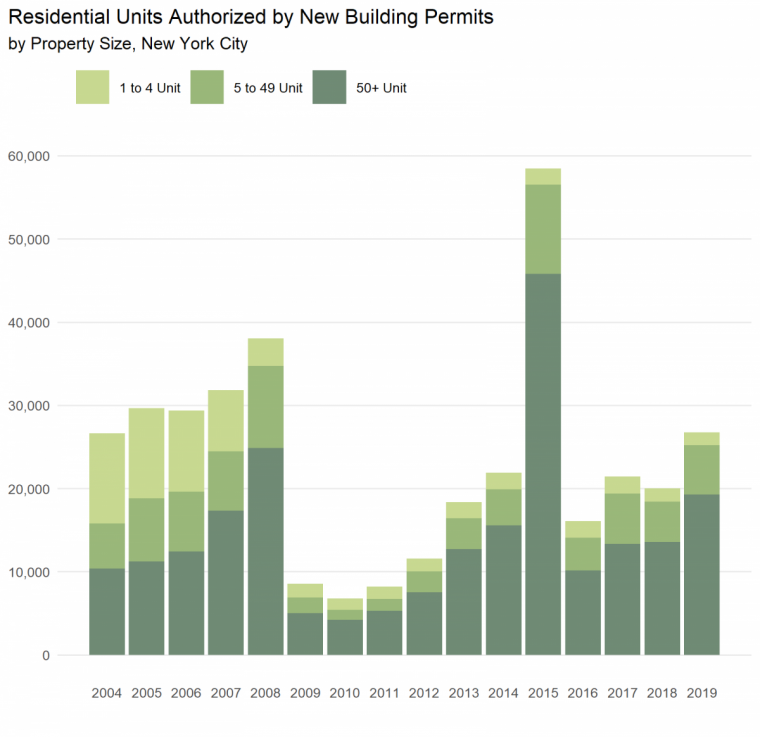
The number of residential units authorized by new building permits increased in 2019.
The number of housing units authorized by new building permits in New York City increased by 33.7 percent between 2018 and 2019. Of the building types, the number of permits issued for one- to four-units fell (-3.4% to 1,542), and continue to remain well below pre-2008 levels. The number of units authorized in new buildings with 5 to 49 units increased (+23.3% to 5,975), as did the number of units for buildings with 50 or more units (+41.8% to 19,245). New buildings with 50 or more units continue to account for the majority (71.9%) of new units authorized by new building permits, up 4.1 percent from 2018. The overall number of units permitted in 2019 is 70.4 percent of what it was in the pre-recession peak in 2008. Some permits that would have been filed for later may have been applied for in 2015, when legislation authorizing the 421-a tax exemption expired, causing the number of units permitted to spike that year.
Sources: New York City Department of Buildings, NYU Furman Center
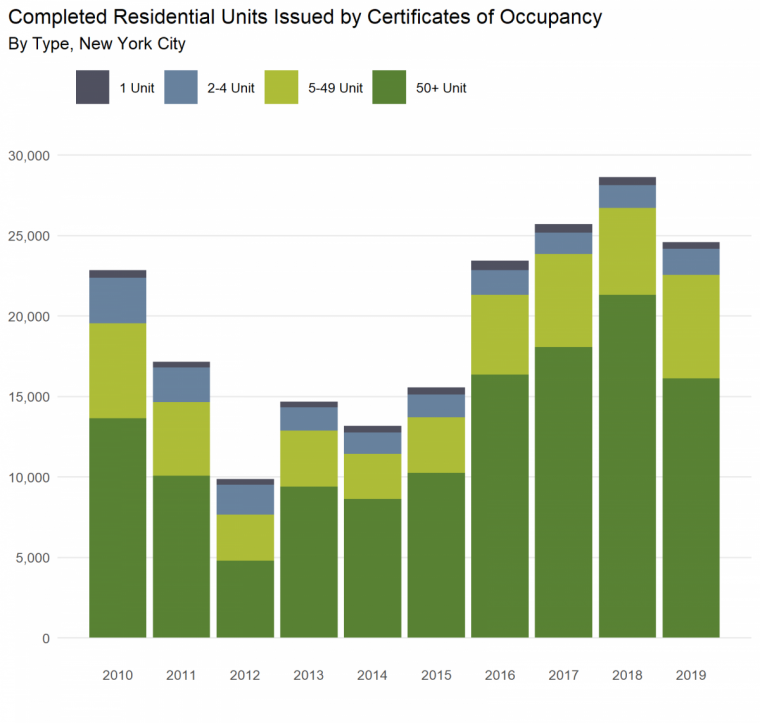
The number of units completed in 2019 declined compared to 2018, but remained above pre-2017 levels.
Between 2018 and 2019, the number of new units that received a certificate of occupancy decreased by 14.2 percent to 24,566, reversing a trend of increases between 2012 and 2018. The majority of new units authorized for occupancy were in 50+ unit buildings (65.6%). Certificates of occupancy were issued for 408 single-family homes, (a decrease of 22.1%). Certificates of occupancy were also issued for 1,611 units in 2-4 unit buildings (an increase of 14.9%), and 6,453 units in 5-49 unit buildings (a decrease of 19.0%).
The relatively high number of residential units completed post-2015 is likely related to the high number of units authorized by new building permits in 2015. Facing the expiration of the 421-a tax exemption, many developers accelerated their plans in order to be grandfathered under the then-existing tax incentive program The increase in the number of units coming onto the market beginning in 2016 is likely a byproduct of the 2015 spike in new building permits, as buildings started in 2015 were completed in 2016 and later years.
Sources: New York City Department of Buildings, New York City Department of City Planning, NYU Furman Center
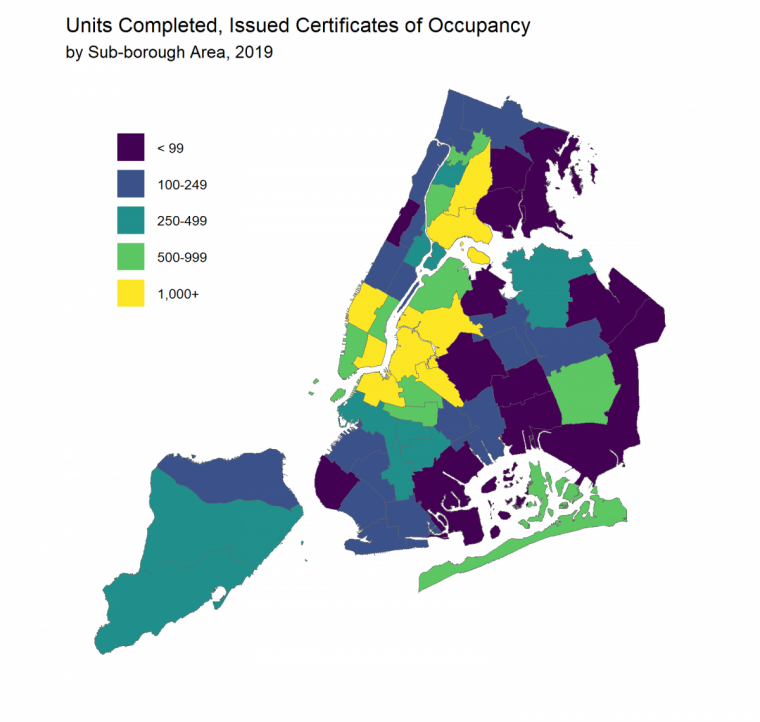
New units were concentrated in a few neighborhoods in Manhattan, Brooklyn, Queens, and the Bronx.
The majority of new units completed and issued certificates of occupancy in 2019 were located in a limited number of Sub-Borough Areas in Manhattan, Brooklyn, and Queens. More than 2,000 units completed were in Chelsea/Clinton/Midtown (3,119 units), Sunnyside/Woodside (2,913), and Williamsburg/Greenpoint (2,334). Morningside Heights/Hamilton Heights had the fewest number of new units completed, where only two units received certificates of occupancy. Alteration and demolition work can also add or reduce the number of units overall. Accounting for changes in the number of units due to new construction, alterations, and demolitions, some areas of the city actually lost housing in 2019. For example, the Upper East Side lost 148 units.
Sources: New York City Department of Buildings, New York City Department of Planning, NYU Furman Center
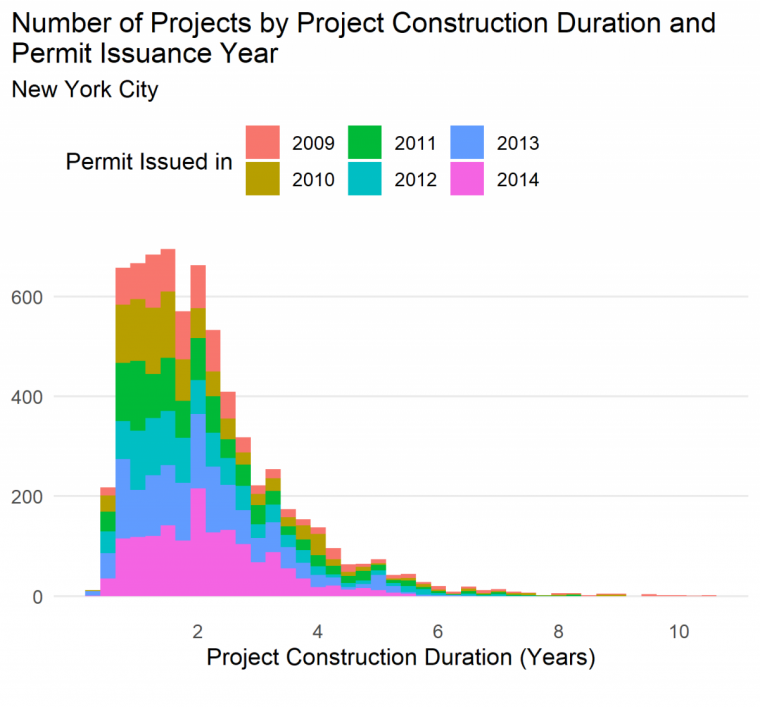
The typical project took about 2 years to achieve a certificate of occupancy.
The length of time between when a building project is issued a permit and when it receives a certificate of occupancy provides insight into the typical duration of construction for New York City residential projects. Restricting our review to buildings permitted in years with a high proportion of completed projects (2009 – 2014), the median residential construction project took approximately 1.9 years to complete. Roughly half of all residential construction projects were completed in between a little over a year and a little over two and a half years. Some projects took as long as ten years to reach completion.
Sources: New York City Department of Buildings, New York City Department of City Planning, NYU Furman Center
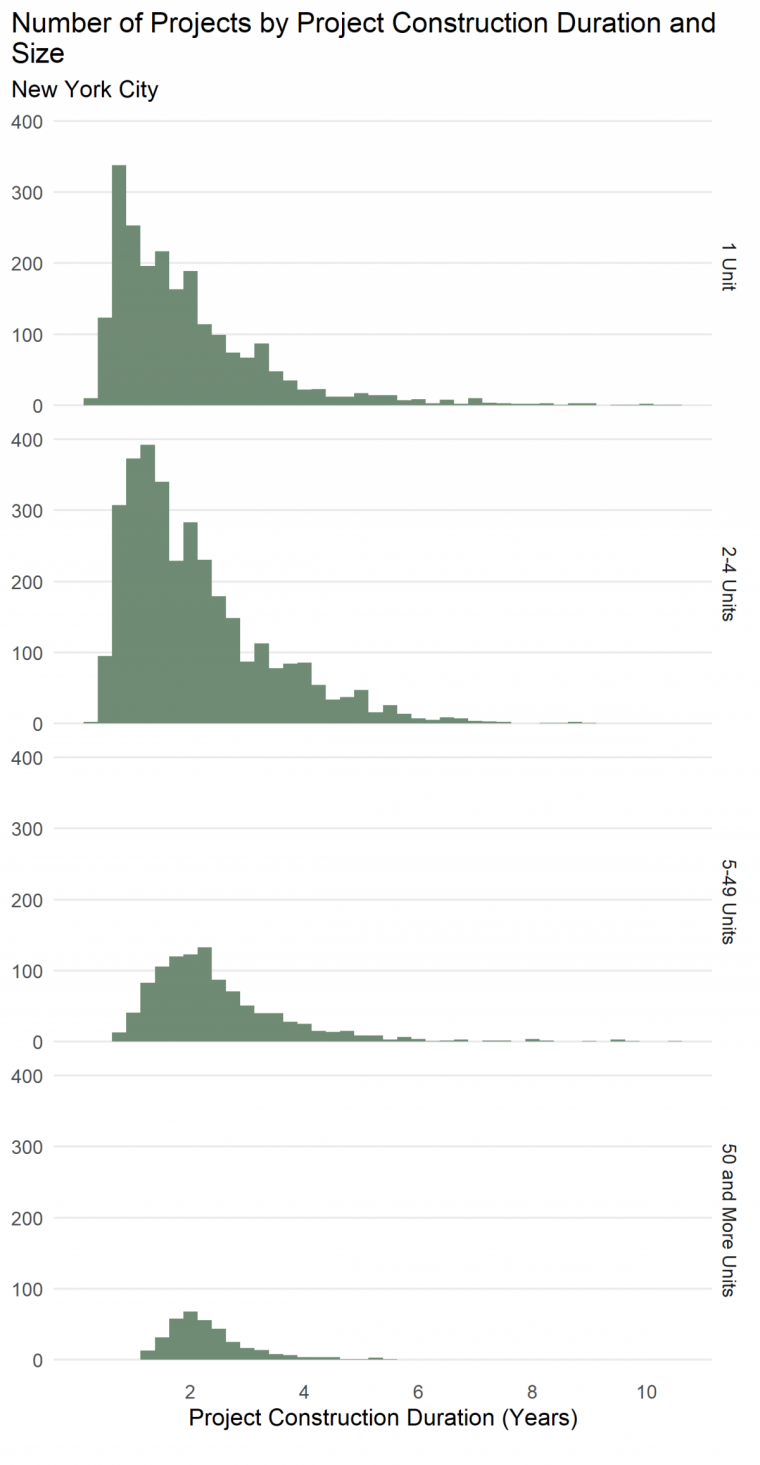
The construction time for buildings permitted between 2009 and 2014 vary slightly depending on project size.
Overall, smaller buildings took less time to build than larger buildings, but a significant share of small buildings had longer development timelines. The median single family home took 1.6 years to build, while the median building with 50 or more units took 2.2 years. However, larger buildings had less variation in terms of construction duration.
Sources: New York City Department of Buildings, New York City Department of City Planning, NYU Furman Center
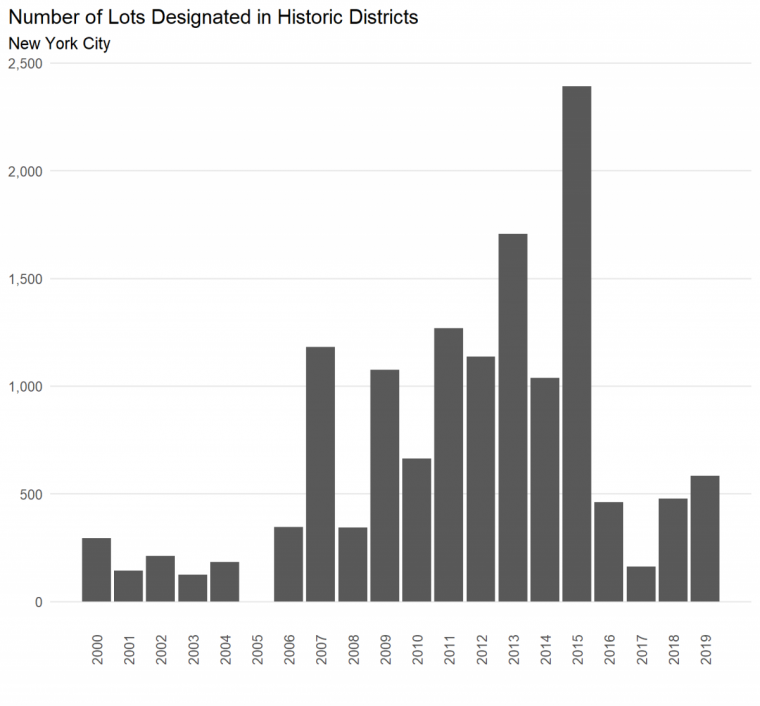
New York City designated five new historic districts, encompassing the highest number of lots since 2015.
In 2019, the New York City Landmarks Preservation Commission (LPC) designated five new historic districts. The districts included 584 individual tax lots, an increase of 22.7 percent from 2018, and more than three times the number of lots designated in 2017. Still, the number of lots designated in 2018 was lower than the number of lots designated earlier in the decade. The largest new historic district, Sunset Park South, encompasses 286 lots.
Sources: New York City Landmarks Preservation Commission, NYU Furman Center
Note: There were no lots designated in historic districts in 2005.