-
Institutional Owned Land and New York City’s Housing Crisis: The Extent of Faith-Based Owned Land Ownership
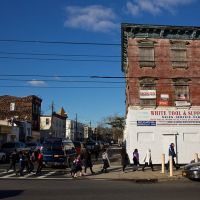
As New York City grapples with its most severe housing shortage in over half a century, state and local policymakers are actively seeking a range of ways to promote housing development using institutionally-owned land, including Faith-Based Organizations (FBOs). To gauge the opportunity’s scale, the NYU Furman Center analyzed the zoning of FBO-owned land in New York City, detailing its scope and geographic spread.
-

Five Principles for a New 421-a Property Tax Exemption
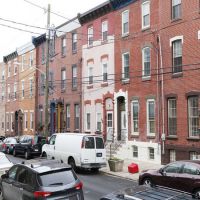
A property tax exemption in New York City is necessary to make rental housing development financially feasible across the city’s varied markets, according to a new policy brief by the NYU Furman Center. Without an exemption, the costs associated with development, which are further exacerbated by high property taxes, would significantly hinder new rental development, especially of mixed-income developments that can provide new housing options for lower-income families.
-

Research & Policy
The GSE Public-Private Hybrid Model Flunks Again: This Time It’s the Federal Home Loan Bank System (Part 2)
In this analysis, Part 2 of a series, Senior Visiting Fellow Donald H. Layton lays out the shortcomings of the Federal Home Loan Bank System, explaining how it has deviated from its original mission and how its structure inherently favors profit over purpose. He also explores the FHFA’s efforts to reform the FHLB System and the challenges ahead, proposing solutions to ensure a lasting balance between mission and profit.
-
Navigating the Tradeoffs of Good Cause Eviction
As lawmakers in Albany debate how to fix New York’s housing affordability crisis, a new research brief by the NYU Furman Center examines the possible effects of how a good cause eviction requirement might affect tenants, landlords, and the housing market. The paper also analyzes good cause legislation in other cities and states to help policymakers consider how to balance anticipated tradeoffs.
-

Maximizing Underused Hospital-Owned Land for Affordable Housing
To assist city and state policymakers, planners, housing developers, community development organizations, and other stakeholders, the NYU Furman Center released an interactive map analyzing healthcare facility and hospital-owned (HHO) properties and their suitability for housing development as part of our March 7 conference with the Federal Reserve Bank of New York: Fostering Neighborhoods: Hospitals and the Development of Affordable Housing.
-

The GSE Public-Private Hybrid Model Flunks Again: This Time It’s the Federal Home Loan Bank System (Part 1)
Senior Visiting Fellow Donald H. Layton argues in a two-part article that the root cause of the need for reform in the Federal Home Loan Bank (FHLB) System and other government-sponsored enterprises (GSEs) is a fundamental flaw in Congress’ design of GSEs. Part 1 of this two-part article draws a parallel between the FHLBs and Fannie Mae and Freddie Mac (F&F), while Part 2 will focus on the FHLBs and how the GSE design flaw has similarly manifested itself.
-

Tackling New York City’s Housing Crisis is a ‘Shared Responsibility’
New York City officials are hopeful that two new packages of laws—the City Council’s Fair Housing Framework and Mayor Eric Adams’ proposed City of Yes for Housing Opportunity plan—will work in tandem to fairly and equitably produce new housing across the city and ensure every single neighborhood contributes to solving the city’s acute housing crisis.
-

Racial Inequities in New York City’s Property Tax System
New Yorkers in neighborhoods with higher shares of Black residents are disproportionately burdened with higher effective property tax rates compared to their white counterparts, according to an analysis by the NYU Furman Center.
-

News & Events
Supply Skepticism Revisited: What New Research Shows About the Impact of Supply on Affordability
Furman Center faculty directors Vicki Been, Ingrid Gould Ellen, and Kathy O’Regan recently released “Supply Skepticism Revisited”, highlighting the latest rigorous research that draws out the nuanced effects housing supply has on housing affordability. The paper delves into arguments made by “supply skeptics” and counters them with evidence from recent studies that show the positive impact additional housing supply has on the affordability of a local housing market.
-

Research & Policy
The GSE Conservatorships: Fifteen Years Old, With No End in Sight
Senior Visiting Fellow Donald H. Layton compiles a 10-point Q&A to explain some of the history and key events of the government’s conservatorships of Fannie Mae and Freddie Mac.
All content © 2005 – 2024 Furman Center for Real Estate and Urban Policy | Top of page | Contact Us