State of the City 2022
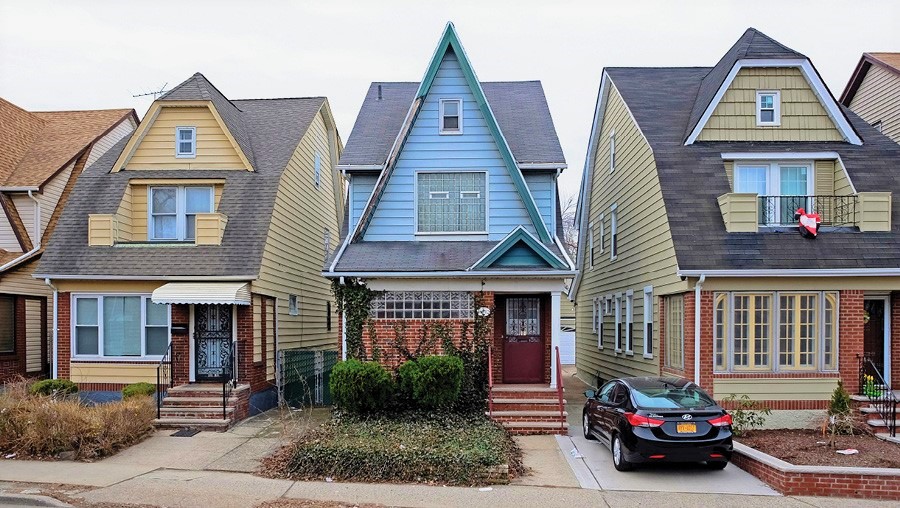
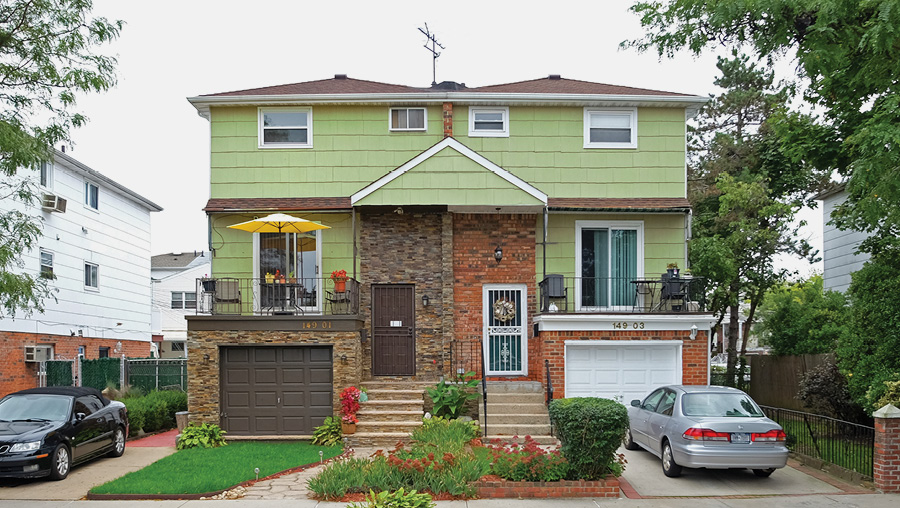
New York City’s lowest-density community districts take up 44.7 percent of the total land across the five boroughs but contain just 28.4 percent of the city’s population. Despite that mismatch, there has been little policy discussion about whether and how low-density neighborhoods should accommodate more housing and people. This report develops a profile of the lowest-density community districts and highlights variation within them. We show that NYC’s lowest-density community districts, which we abbreviate as “LDCDs,” are less different from the rest of the city than often believed, but also have many different types of neighborhoods within them. The demographics of residents across LDCDs mirror the city as a whole, with a higher share of residents who identify as non-white residing in LDCDs than across the city, despite the common perception that residents of LDCDs are more likely to be white than in other neighborhoods. LDCDs also include neighborhoods that are anchors of Black homeownership - over 50 percent of New York City’s Black homeowners reside in LDCDs. The housing stock of LDCDs is quite different from other areas in the city, with 41.1 percent of all housing units contained in single-family (attached and detached) houses. But even so, 45.8 percent of the households living in the LDCDs are renters, and about half of all those renters report living in buildings that are four units or smaller. The rate of permitted new housing was lower in LDCDs than in the rest of the city – during the last decade, an era of intense housing demand and population growth, the rate of new housing development in LDCDs was half the rate of the city overall.
There is an important policy context for this work. There is an extreme shortage of affordable housing, 1 and many of the city’s lower-income renter households are rent burdened. Both the city council and the state legislature are considering significant proposals for legal reforms that would address the housing shortage. But the calls to make it easier to build more housing increasingly ask all types of neighborhoods to permit more housing, not just the neighborhoods that have shouldered the burden in recent decades. Some proposals suggest using a “fair share” framework, which would require all community districts within New York City, and/or all local governments within the state to permit an equal minimum rate of growth. Others suggest a more nuanced, but also more complex and contestable, allocation of housing production targets that would differ across neighborhoods based on specific criteria. 2
The focus on how new housing construction should be distributed across neighborhoods and local governments also is driven by the requirement of the federal Fair Housing Act that local governments “affirmatively further fair housing.” 3 A recently proposed rule to implement that mandate defines that obligation as requiring state and local governments to:
Tak[e] meaningful actions . . . [to] reduce or end significant disparities in housing needs and in access to opportunity, replacing segregated living patterns with truly integrated and balanced living patterns, transforming racially and ethnically concentrated areas of poverty into well-resourced areas of opportunity, and fostering and maintaining compliance with civil rights and fair housing laws and requirements.” 4
Local governments are given discretion to determine, in light of local circumstances, how best to achieve the mandate. The city’s lowest-density neighborhoods sometimes provide access to key areas of opportunity in the city, as a look at the indicators we track under Neighborhood Services and Conditions in each of the lowest-density community districts shows. 5 That makes it particularly critical for the city to refine its existing zoning, housing, and infrastructure policies, and to adopt new strategies to ensure that the LDCDs do their part to fulfill the affirmatively furthering fair housing requirement. 6
In the sections that follow, we have identified which neighborhoods have the city’s lowest residential density, and explore the characteristics of the residents, housing, and recent development patterns in those neighborhoods. We conclude by suggesting how our findings can help inform the policy challenges that the state and city proposals, and the demands of the federal Fair Housing Act, present.
The lowest-density community districts are located along the periphery of New York City, furthest from Midtown Manhattan.
New York City’s lowest-density community districts are slightly denser than New York City’s suburbs in New York State.
Overall, the demographics of residents who live in the lowest-density community districts are much like the city’s overall.
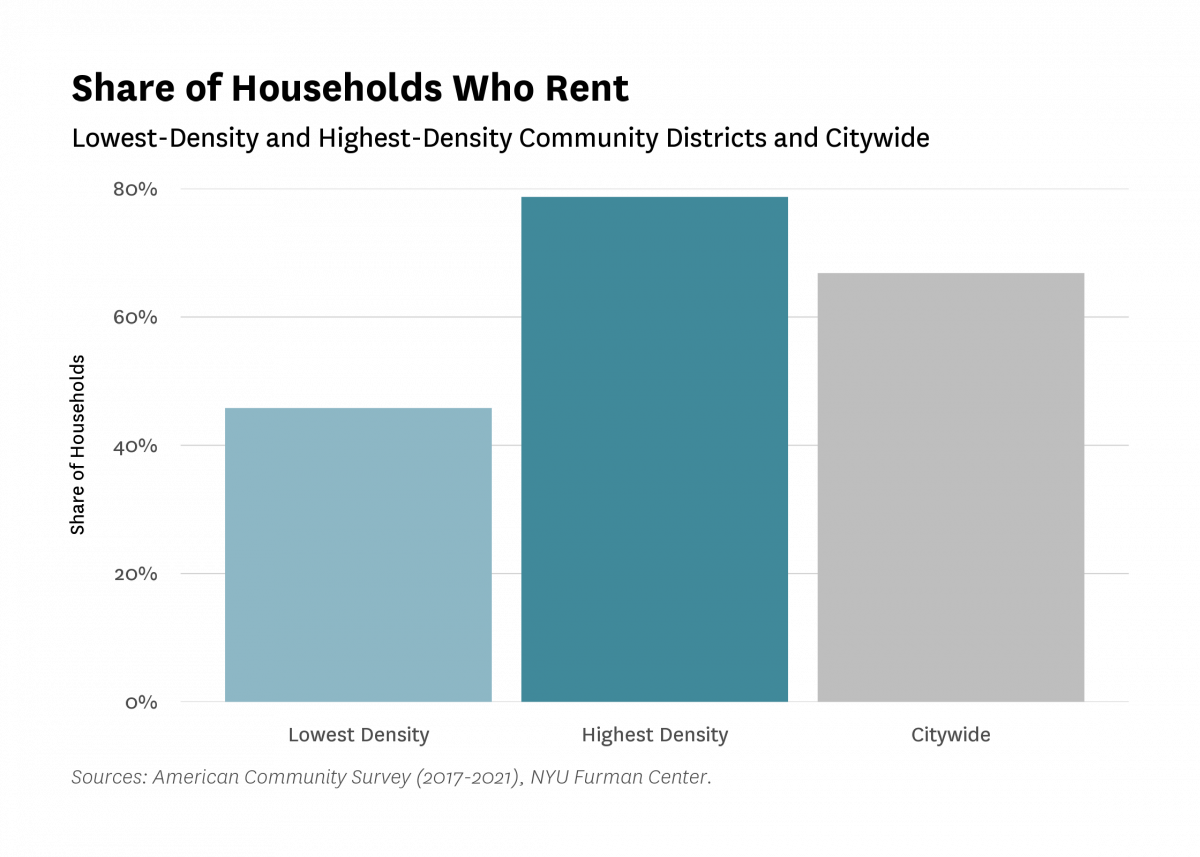
Compared to the city overall and the highest-density community districts, a much lower share of households in the lowest-density community districts are renters, with 51.5 percent of renters in the lowest-density community districts residing in smaller buildings (four units or smaller).
The lowest-density community districts include neighborhoods that are anchors of homeownership for BIPOC residents, especially Black New Yorkers. But there are significant homeownership gaps by race/ethnicity in all neighborhood types.
Both homeowner and renter median incomes are lower in LDCDs than in HDCDs, as were median sales prices for all types of residential property sold in 2022.
Homeowners in LDCDs were more likely to have moved into their current residence before 2000 than their HDCD counterparts.
Lower-density census tracts within the lowest-density community districts have higher incomes and larger white population shares than higher-density tracts within the lowest-density community districts.
One- and two-family homes make up a much higher share of land in the lowest-density community districts as compared to the highest-density community districts and the city as a whole.
About 14 percent of land in lower-density tracts within the lowest-density community districts is vacant.
Housing units in the lowest-density community districts are larger, and more likely to be in single-family homes compared to the city overall.
The highest-density tracts within LDCDs have a much lower share of single-family homes than the lowest-density tracts, and the housing stock in the highest-density tracts looks very similar to that of the city overall.
Between 2010 and 2020, the lowest-density community districts added housing at only half the rate of the city overall.
Between 2010 and 2020, permitted new housing units in LDCDs were far more likely to be in one-to-three-unit buildings as compared to the rest of the city.
Seven percent of citywide multifamily completions between 2010 and 2020 took place in LDCDs, and nine percent of citywide low-income multifamily completions were in LDCDs.
About 80 percent of new multifamily housing built in LDCDs was within a half-mile of a subway or rail stop.
Despite being further from Midtown Manhattan, workers who lived in the lowest-density community districts commuted to similar areas for work as the rest of the city (before the pandemic).
There are several methods for calculating population density. The simplest method, total population divided by total area, can be misleading. For example, areas with lots of commercial uses or open space will show up with lower overall density measures, even if they are otherwise densely populated areas (i.e., Midtown Manhattan and the Financial District). To better represent the residential density in each community district (CD), we calculated the population density of each census tract within a community district (population/total area) and then found the median density, weighted by population. By focusing on the median density of all tracts within a CD, we give less weight to largely non-residential areas. We then grouped the community districts into quartiles based on their median tract density, with the lowest-density community districts having fewer than 39,169 people per square mile and the highest-density community districts having more than 77,954 people per square mile.
The bottom quarter of community districts with respect to density (“lowest-density community districts” or “LDCDs”) are located along the periphery of New York City, furthest from the city’s central business districts in Manhattan (see Figure 1). The one exception to this trend is the Ridgewood-Masbeth-Middle Village community district, which is more centrally located in Queens. This distribution is perhaps unsurprising as it follows traditional urban economic theory 7 that housing demand is stronger, and people’s willingness to pay for housing is higher, in areas of closer proximity to central business districts. Notably, all the community districts in Staten Island and most in eastern Queens fall into the LDCD category.
Figure 1: Map of New York City Community Districts by Density Quartile
Sources: Census Bureau's Planning Database, NYU Furman Center.
While New York City’s LDCDs have a lower density than other community districts in the city, they have a higher density than comparable geographic areas (“Public Use Microdata Areas” or “PUMAs”) with boundaries that touch New York City. For example, the New York City community districts in eastern Queens that border Nassau County on Long Island have between 16,015 and 20,907 people per square mile, while the PUMAs directly across the border have between 5,773 and 10,537 people per square mile. Similarly, the LDCDs in the northern Bronx that border Westchester County have between 27,933 and 41,341 people per square mile, while the PUMAs directly across the border have between 12,535 and 12,855 people per square mile.
Figure 2: Map of Population Density for NYC Community Districts and Tri-State Area PUMAs (Lowest-Density Community Districts Outlined in Black)
Sources: Census Bureau's Planning Database, NYU Furman Center.
The residents who occupy LDCDs are of similar racial and ethnic diversity to residents across the city (see Figure 3). Contrary to the common stereotype that low-density neighborhoods are exclusively high-income, with a high share of white residents, we find that the share of residents in LDCDs that identify as non-Hispanic white is lower than the citywide share (29.2% vs. 31.9%), and that the share of population that identifies as non-Hispanic Black is higher than the citywide share (26.4% compared to 21.1%). We also find that the median household income in LDCDs is about seven percent higher than the citywide median ($76,061 vs. $71,044).
Figure 3:
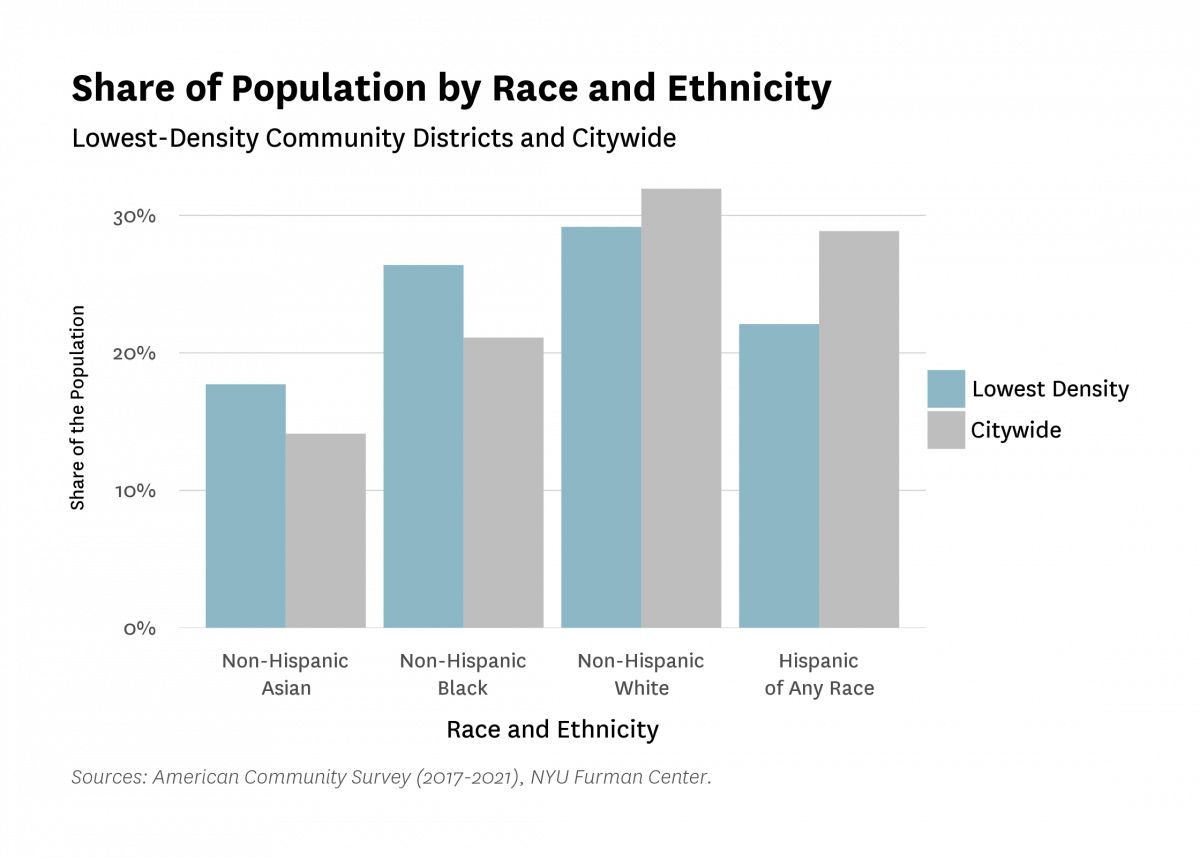
Table 1:
| Demographic Indicators | |||
| Lowest-Density and Highest-Density Community Districts and Citywide | |||
| Indicator | Lowest Density | Highest Density | Citywide |
|---|---|---|---|
| 01. Share Non-Hispanic White | 29.2% | 33.9% | 31.9% |
| 02. Share Non-Hispanic Black | 26.4% | 14.1% | 21.1% |
| 03. Share Non-Hispanic Asian | 17.7% | 11.5% | 14.1% |
| 04. Share Hispanic (Any Race) | 22.1% | 37.3% | 28.9% |
| 05. Share Foreign-Born | 38.2% | 33.9% | 36.3% |
| 06. Share Renters | 45.8% | 78.7% | 66.8% |
| 07. Share Homeowners | 54.2% | 21.3% | 33.2% |
| 08. Median Income | $76,061 | $73,347 | $71,044 |
| 09. Share Below Poverty Line | 11.8% | 18.9% | 17.0% |
| 10. Share Renters Spending 30%+ Income on Rent | 51.1% | 48.0% | 49.7% |
| Sources: American Community Survey (2017-2021), NYU Furman Center. | |||
The share of households who rent their homes is lower in LDCDs than in the city overall and in HDCDs (45.8% compared to 66.8%, and 78.7%, respectively). While the overall share of households who rent is lower in LDCDs than in the city overall, renter households in LDCDs are more likely to be people of color. About three-quarters of renter households in LDCDs are Black, Asian, or Hispanic (of any race), compared to closer to two-thirds of renters citywide and in HDCDs. Further, 52.1 percent of Black households in LDCDs are renters, compared to 90.3 percent in HDCDs.
About half of all renters in LDCDs live in buildings that are four units or smaller (51.5%), with 12.8 percent of renters in LDCDs living in single-family homes. In contrast, only 6.6 percent of renters residing in HDCDs live in buildings with four or fewer units. The majority of renters in HDCDs live in buildings that are 10 units or larger - 87.5 percent of renter households in HDCDs live in buildings of such size, compared to 41.2 percent in LDCDs.
Renters in LDCDs have somewhat comparable incomes to renters in HDCDs, but median renter income is 13 percent lower in LDCDs compared to HDCDs ($53,292 vs. $61,316). Renters in LDCDs are also more likely to have moved into the area in the 2000s – 20.8 percent of LDCDs renters moved into their residence between 2000 and 2010 compared to 16.6 percent of renters in HDCDs. In contrast, a lower share of renters moved to LDCDs prior to 2000 as compared to their highest-density counterparts (16.4% and 24.8%, respectively).
Figure 4:
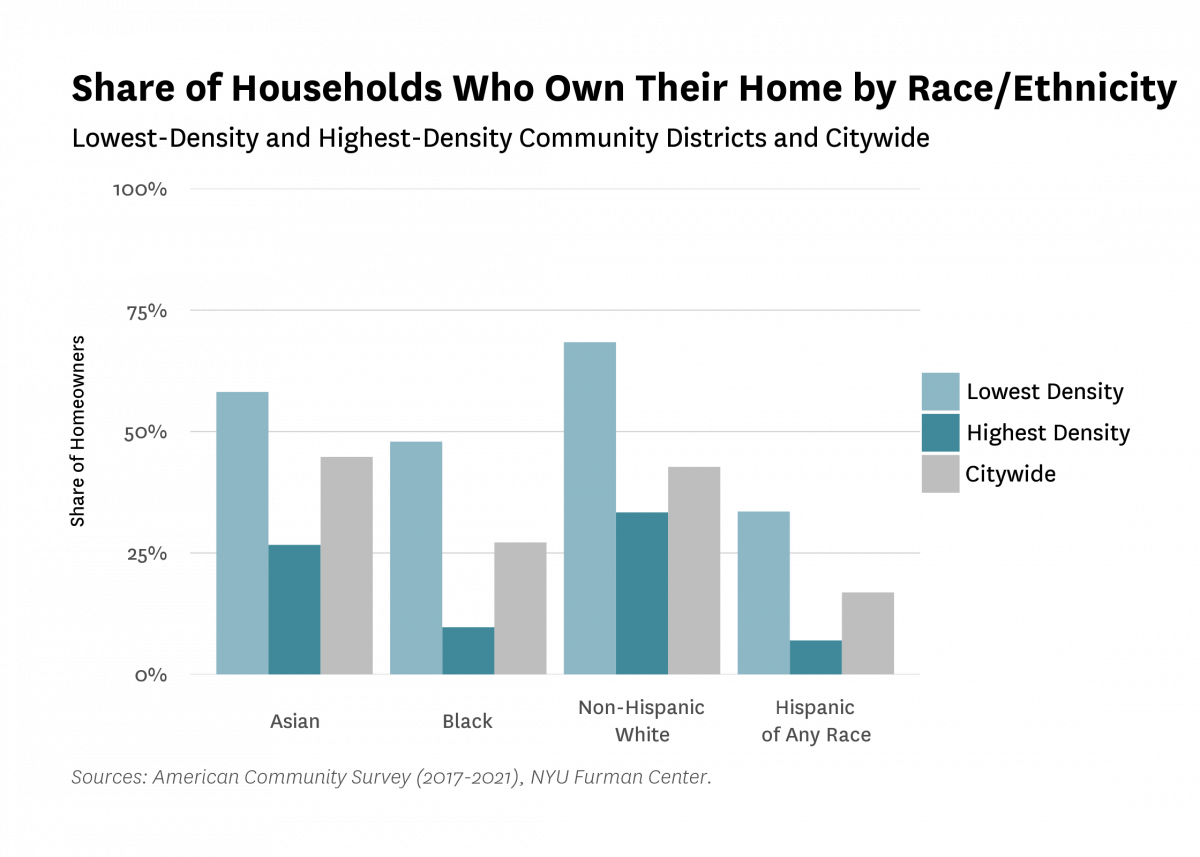
Nearly half (47.9%) of Black households who reside in the lowest-density community districts own their home, a significantly higher share than their counterparts both citywide and in the highest-density community districts (27.2% and 9.7%, respectively) (see Figure 5). At the same time, there is a large gap in the homeownership rate by race/ethnicity in all neighborhood typologies. To compare, the homeownership rate for white households who reside in LDCDs is 68.4 percent.
In general, more than half (56.7%) of homeowners in LDCDs are BIPOC, compared to 33.2 percent of homeowners in HDCDs, and slightly more than half of homeowners in the city overall (51.2%).
Figure 5:
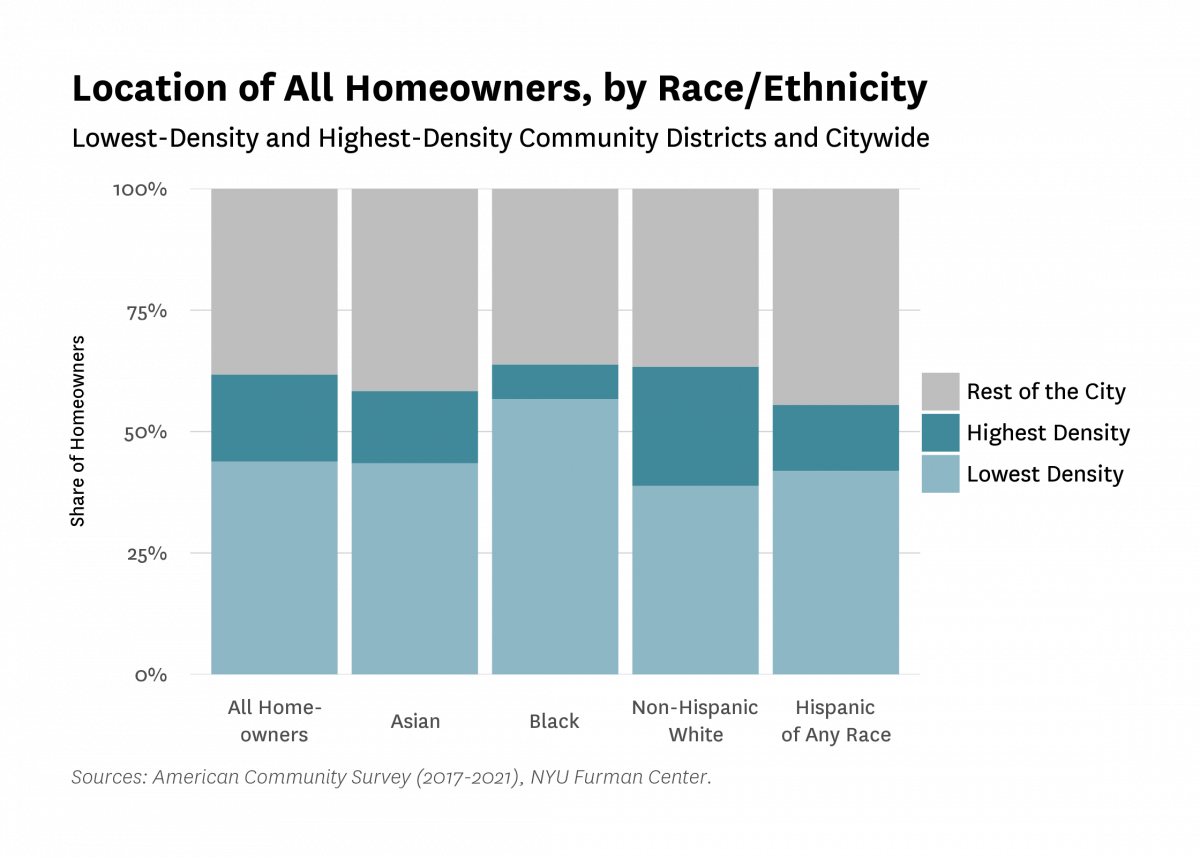
When examining all homeowners in the city by the race/ethnicity of the head of household, we find that more than half of the city’s Black homeowners reside in LDCDs, a higher share than that of Asian, non-Hispanic white, and Hispanic of any race homeowners. Only a very low share of Black homeowners reside in HDCDs.
Figure 6:
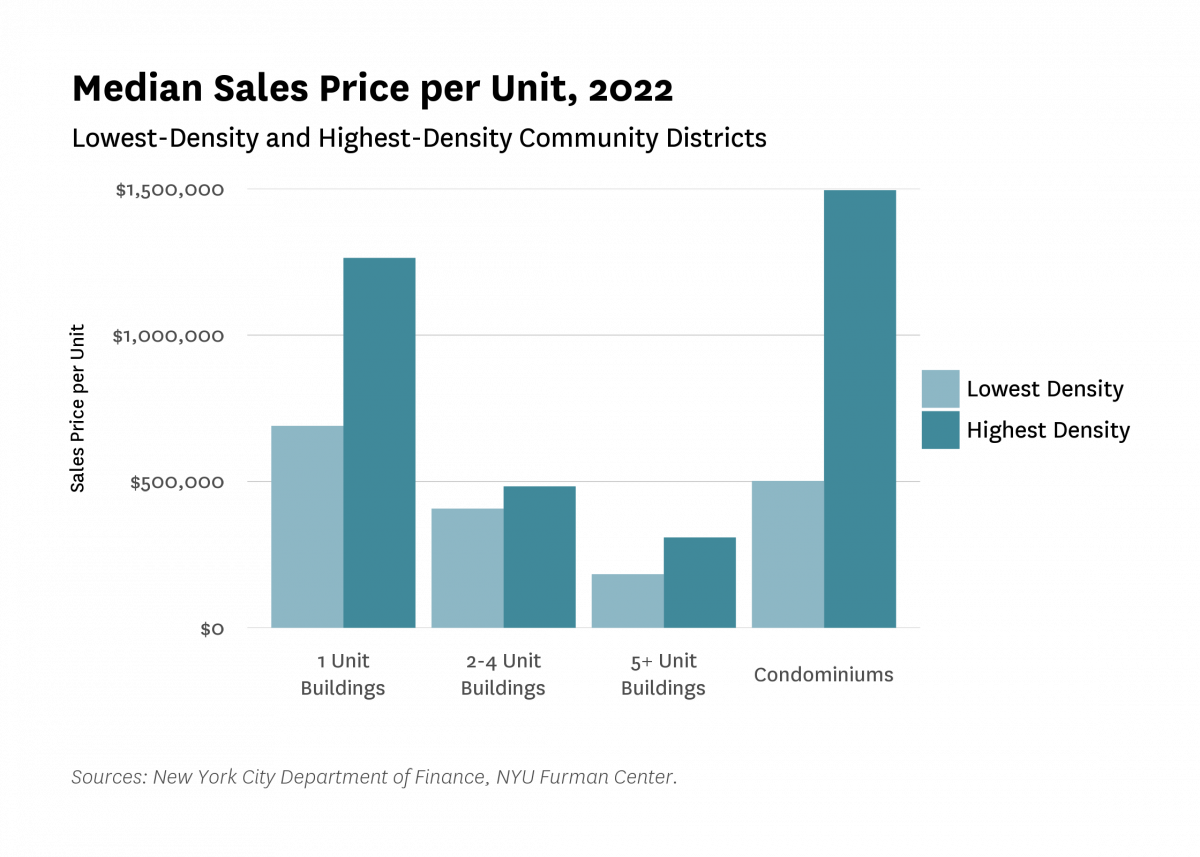
Per-unit sales prices in 2022 were consistently lower for all residential building types in LDCDs as compared to HDCDs, with the largest difference in condominium prices (See Figure 7). The median homeowner household income is about 30 percent lower in LDCDs compared to HDCDs (with the median homeowner income of $102,436 in LDCDs compared to $150,388 in HDCDs). In contrast, the median renter household income is 13 percent lower in LDCDs than in HDCDs.
Figure 7:
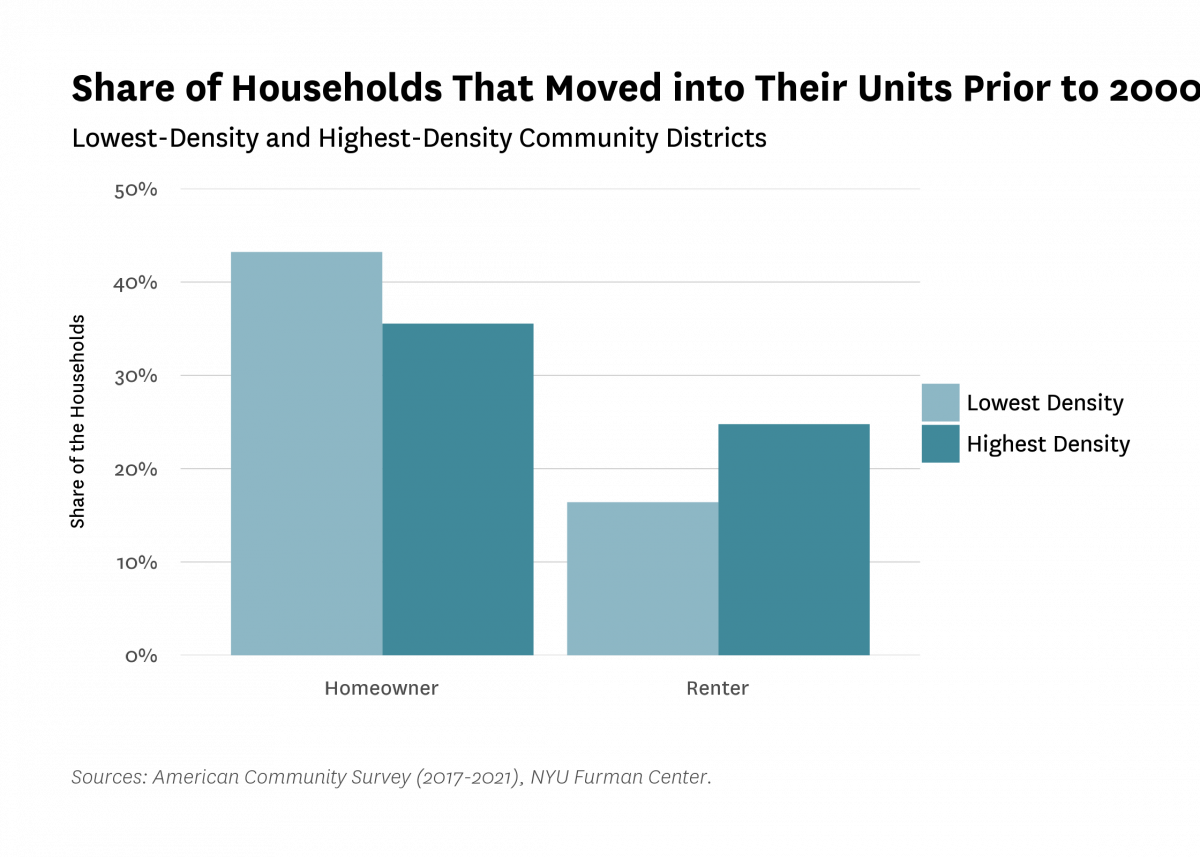
Homeowners in LDCDs were more likely to have moved into their home earlier than their counterparts in the highest-density areas: 43.2 percent of homeowners in LDCDs moved into their home prior to 2000, compared to 35.5 percent of homeowners in HDCDs. In contrast, renter households in low-density neighborhoods were less likely to have moved into their home prior to 2000 compared to renter households in high-density areas (16.4% and 24.8%, respectively).
Figure 8:
We divided all census tracts within LDCDs into quartiles based on population density to take a deeper look within community districts (see Table 2). Though LDCDs have a similar demographic composition to the citywide composition, the least dense tracts within LDCDs had a much higher share of the population that identifies as white (53.0% vs. 29.2% overall among LDCDs and 31.9% citywide) and a much higher median income ($96,046 vs. $76,061 overall among LDCDs and $71,043 citywide). The homeownership rate in lower-density tracts within LDCDs is also much higher – 71.8 percent compared to 31.0 percent in the highest-density tracts of LDCDs. This demonstrates the variation within the lowest-density community districts, including pockets of whiter, wealthier, and lower-density neighborhoods.
Table 2:
| Demographic Indicators | ||||
| Lowest-Density and Highest-Density Tracts in LDCDs and Citywide | ||||
| Indicator | Lowest-Density LDCD Tracts | Highest-Density LDCD Tracts | Lowest-Density CDs | Citywide |
|---|---|---|---|---|
| 01. Share Non-Hispanic White | 53.0% | 14.2% | 29.2% | 31.9% |
| 02. Share Non-Hispanic Black | 12.3% | 30.4% | 26.4% | 21.1% |
| 03. Share Non-Hispanic Asian | 16.0% | 20.1% | 17.7% | 14.1% |
| 04. Share Hispanic (Any Race) | 15.6% | 30.0% | 22.1% | 28.9% |
| 05. Share Foreign-Born | 28.6% | 45.2% | 38.2% | 36.3% |
| 06. Share Renters | 28.2% | 69.0% | 45.8% | 66.8% |
| 07. Share Homeowners | 71.8% | 31.0% | 54.2% | 33.2% |
| 08. Median Income | $96,047 | $58,001 | $76,061 | $71,044 |
| 09. Share Below Poverty Line | 8.4% | 16.2% | 11.8% | 17.0% |
| 10. Share Renters Spending 30%+ Income on Rent | 47.0% | 52.7% | 51.1% | 49.7% |
| Sources: American Community Survey (2017-2021), NYU Furman Center. | ||||
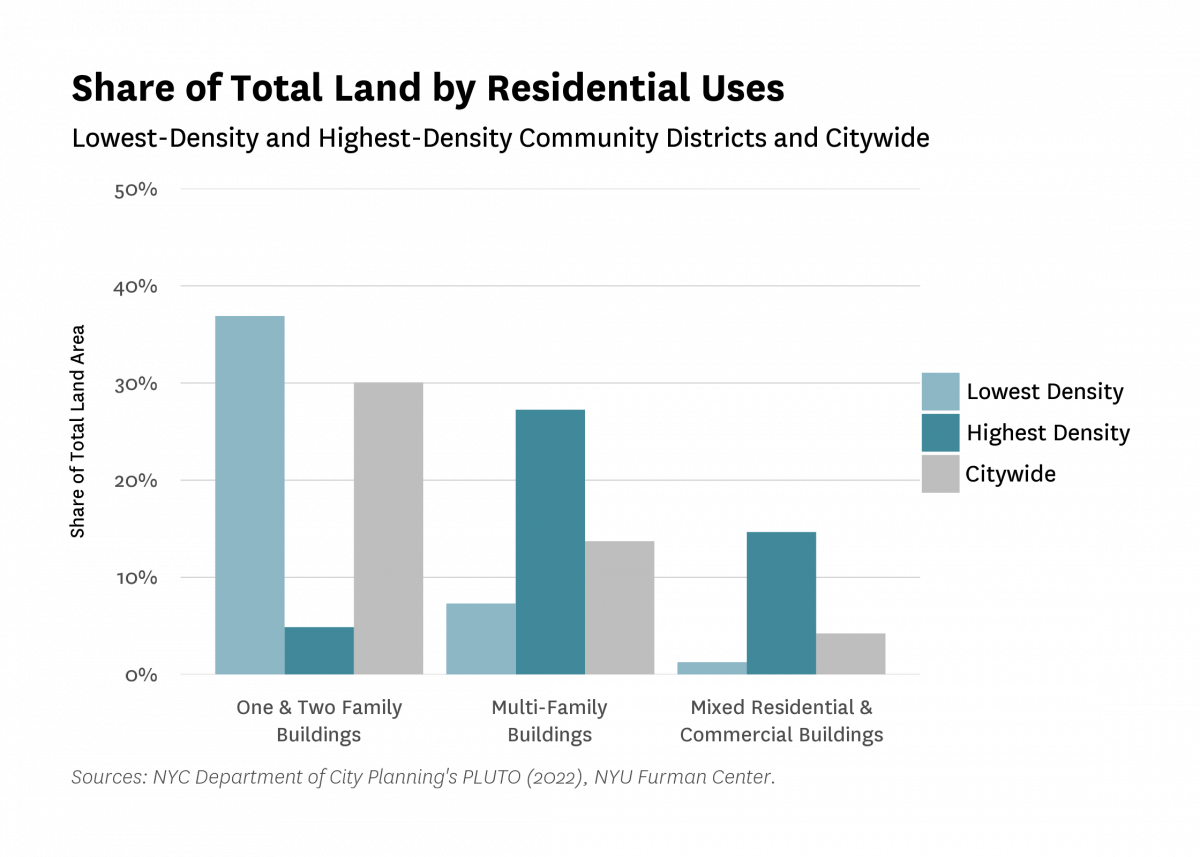
As Figure 11 shows, around two-fifths of all land uses in LDCDs is taken up by one- and two-family homes (36.9%), and less than one-tenth is taken up by multifamily housing (7.3% multifamily plus 1.3% mixed residential and commercial). This is nearly the reverse of HDCDs: two-fifths of land in HDCDs is dedicated to multifamily and mixed-residential and commercial uses (27.3% and 14.7%, respectively), with around five percent dedicated to one- and two-family homes (4.9%). Of residential uses only, 81.2 percent of land in LDCDs is made up of one- and two-family homes, with 16.1 percent multifamily housing, and 2.8 percent mixed-use residential. In contrast, of residential uses in HDCDs only, 10.4 percent is made up of one- and two-family homes, with 58.3 percent multifamily housing, and 31.3 percent mixed-use residential.
Figure 11:
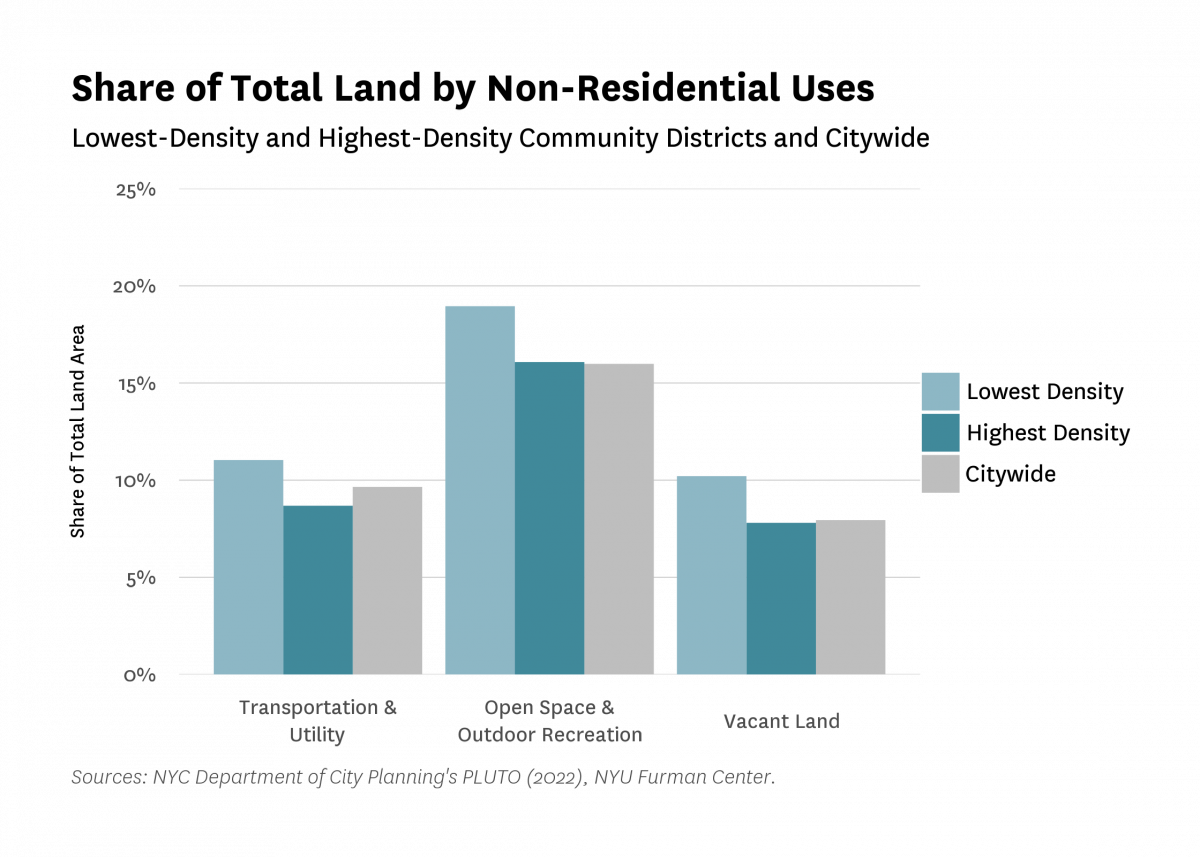
LDCDs have a slightly higher share of land that is used for transportation and utilities (11.0%), open space and outdoor recreation (19.0%), or left vacant (10.2%) compared to HDCDs (where the total is 32.6%). But it appears to be lower-density tracts within LDCDs that drive this slightly higher share. In the lowest-density areas of LDCDs, an even higher share of land is vacant (14.3%), with those same three uses making up 46.5 percent of all land uses.
Figure 12:
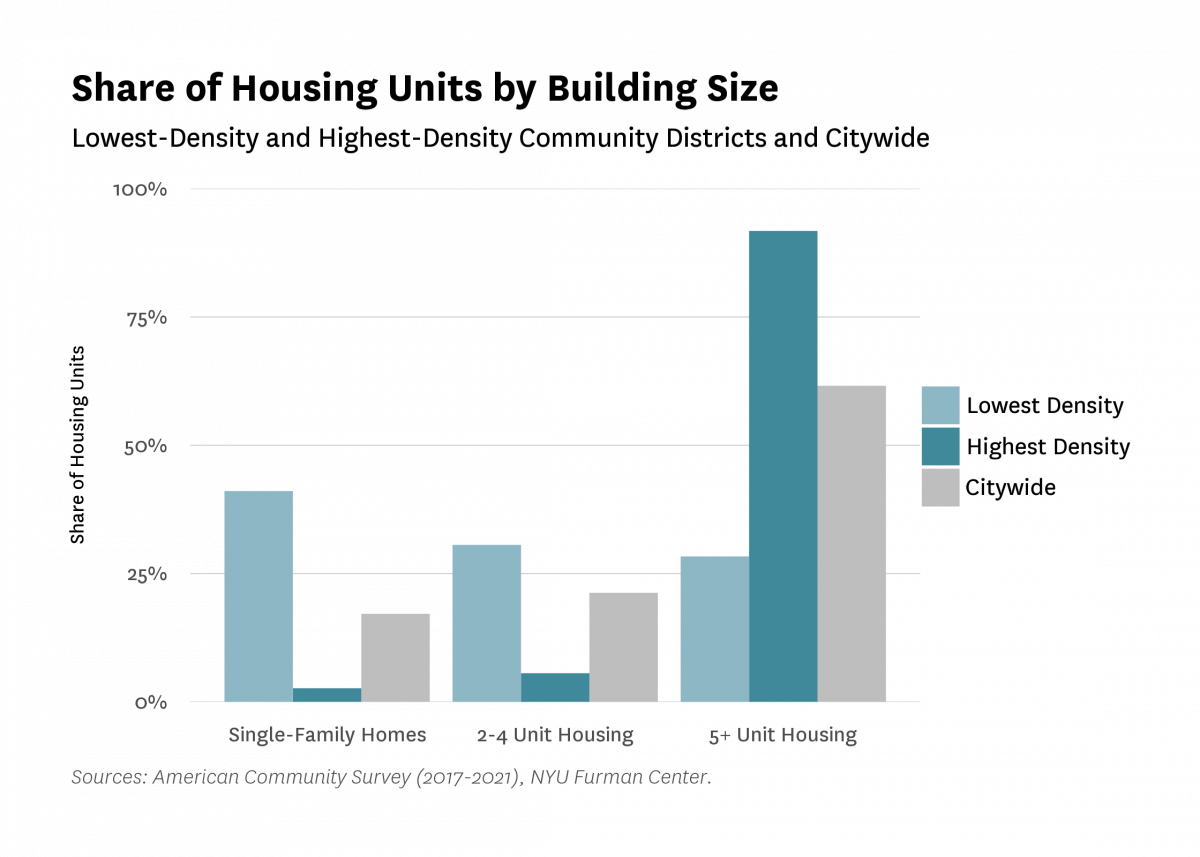
More than half of the housing units in the lowest-density community districts are located in structures with four or fewer units, and more than a quarter of the units are located in single-family, detached housing (see Figure 13). This is in contrast to HDCDs, where 86.6 percent of housing units are located in multifamily housing with 10 or more units. Housing units in the lowest-density community districts are on average larger than the rest of the city (1,072 square feet vs. 979 square feet).
Figure 13:
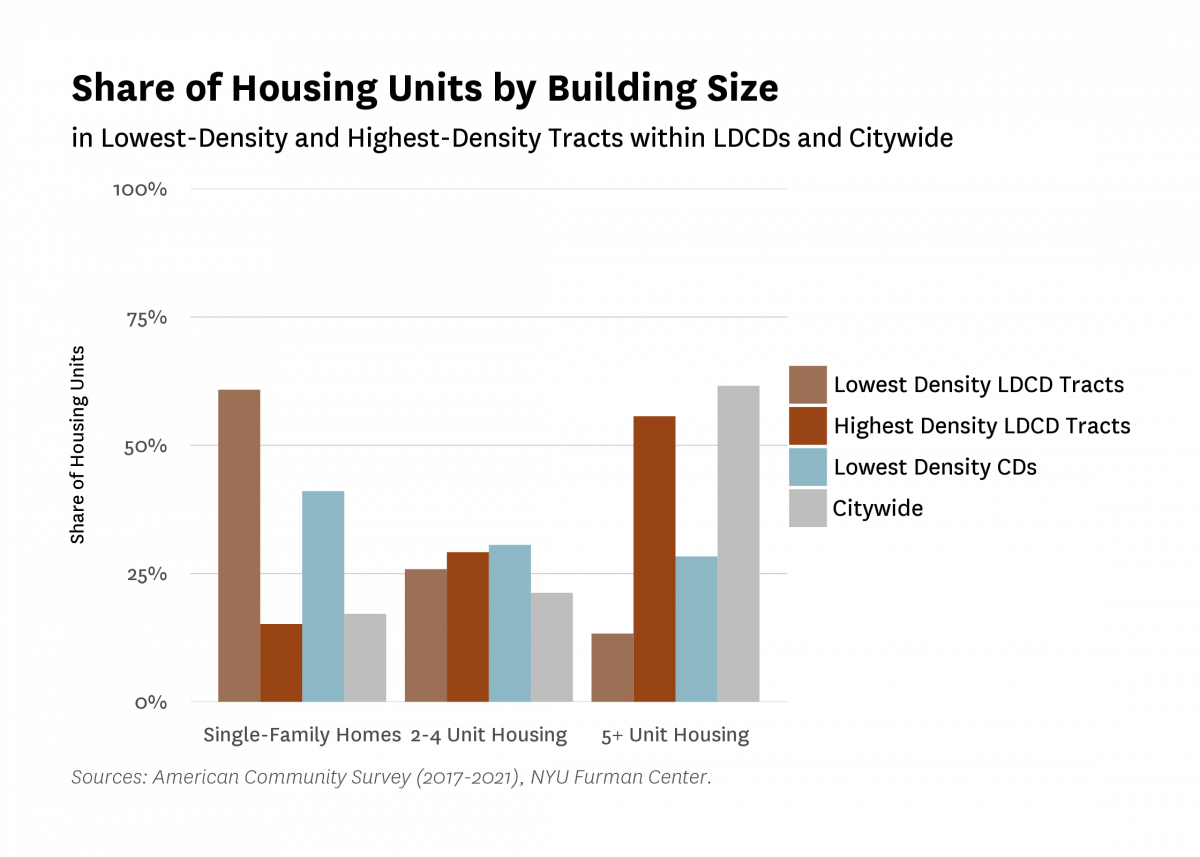
The most dense census tracts in LDCDs have a housing stock that is more similar to the rest of the city, with about half of housing units in buildings with 10 or more units. Only 8.2 percent of units in the highest-density tracts in LDCDs are in single-family homes, similar to the 9.7 percent in the city overall. In contrast, lower-density tracts within LDCDs have a higher share of housing units in small buildings compared to LDCDs overall, with 86.7 percent of units in single-family detached housing and less than 11.8 percent in buildings with 10 or more units.
Figure 14:
Between 2010 and 2020, LDCDs contained 24,569 permitted new housing units. This means that only 14.0 percent of citywide permitted units 8 were located in the lowest-density community districts; less than half the share expected if development was evenly spread across the quartiles. The highest-density community districts permitted and completed around the expected 25 percent, leaving the middle-density quartiles to permit more units than would be their expected share if development were evenly spread across the quartiles.
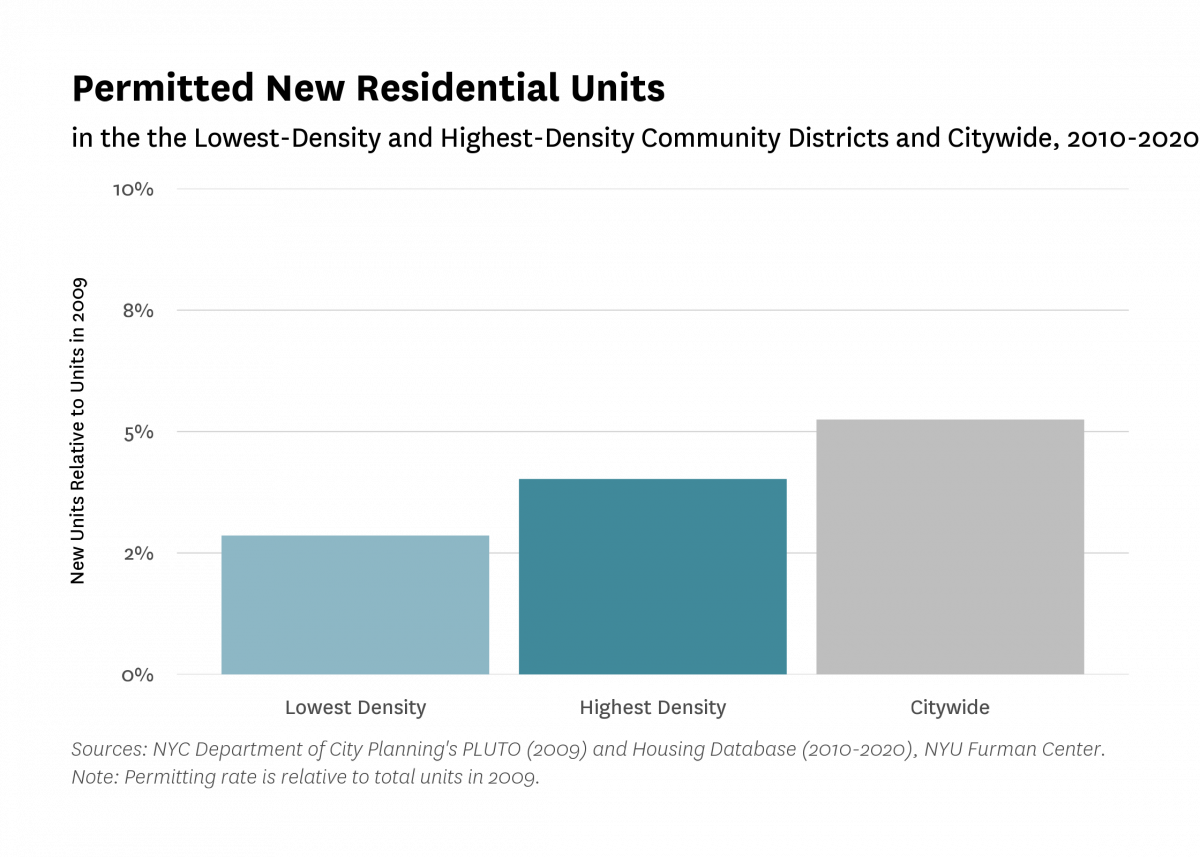
LDCDs permitted new housing at a rate of just 2.9 percent, in total, between 2010 to 2020 (see Figure 15). 9 This was a little more than half of the citywide permitted new housing rate (5.2%) and around a percentage point less than the rate in the HDCDs (4.0%). LDCDs had the lowest permitted new housing rate of all of the quartiles, but interestingly, the second lowest rate was in the highest-density community districts, indicating that both LDCDs and HDCDs had a lower rate than the city overall.
Figure 15:
It is important to note that new housing in LDCDs was not limited to the highest-density portions of LDCDs. We found that both high-density and low-density census tracts in LDCDs permitted about equal counts of new housing between 2010 and 2020.
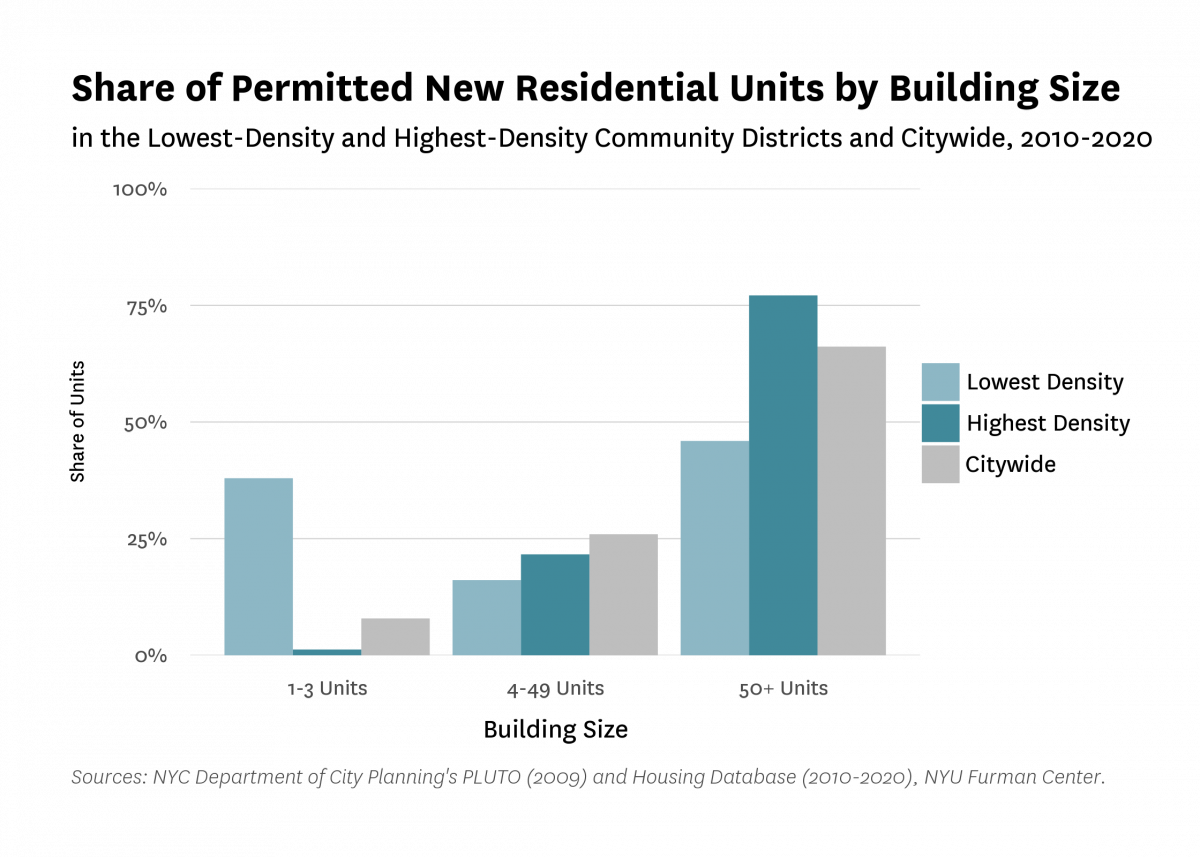
Between 2010 and 2020, more than one-third of permitted new housing units in LDCDs were in one-to-three-unit buildings (38.0%), while in HDCDs, that share was just 1.2 percent (see Figure 16). When looking at the tract level, the new housing units that were permitted in lower-density tracts in LDCDs were much more likely to be in smaller buildings – 53.9 percent were in one-to-three-unit properties, compared to 9.0 percent of permitted units in the highest-density tracts in the same CDs.
Figure 16:
The lowest-density community districts saw 11,677 new units completed in multifamily buildings (4+ units) between 2010 and 2020, which was only around seven percent (6.6%) of the citywide total (see Table 3). Of citywide development, 6.6 percent of total units, 8.6 percent of income-restricted low-income, and 10.4 percent of income-restricted middle-income housing were located within LDCDs. Of the units developed in LDCDs, 37.1 percent were low-income and 5.5 percent were middle-income (citywide, 28.3% of units were low-income and 3.5% were middle-income).
Table 3:
| Completed Multifamily Housing Units | |||
| (4+ Unit Buildings) in the Lowest-Density and Highest-Density Community Districts and Citywide (2010-2020) | |||
| Indicator | Lowest Density | Highest Density | Citywide |
|---|---|---|---|
| 01. Completed Multi-Family Units (2010-2020) | 11,677 | 47,979 | 177,296 |
| 02. Total Low-Income (income-restricted <=80% AMI) Units | 4,327 | 13,816 | 50,241 |
| 03. Share Low-Income | 37.1% | 28.8% | 28.3% |
| 04. Total Moderate- and Middle-Income (income-restricted 81-165% AMI) Units | 640 | 1,403 | 6,145 |
| 05. Share Moderate- and Middle-Income | 5.5% | 2.9% | 3.5% |
| Sources: NYC Department of City Planning Housing Database, NYU Furman Center. | |||
Citywide, 90.8 percent of multifamily housing units completed between 2010 and 2020 were within a half-mile of a rail or subway station, the radius used to define “transit-oriented development” in New York Governor Kathy Hochul’s Transit Oriented Development proposal (see Table 4). 10 In LDCDs, 79.2 percent of multifamily housing units completed during this time were located within that distance. Most of the share of housing in TOD areas came from subway, rather than rail areas. About 35 percent of multifamily housing completed in the least dense areas was within a half-mile of a rail station only.
Table 4:
| Completed Multifamily Housing Units Within TOD Areas | |||
| (4+ Unit Buildings) in the Lowest-Density and Highest-Density Community Districts and Citywide (2010-2020) | |||
| Indicator | Lowest Density | Highest Density | Citywide |
|---|---|---|---|
| 01. Share in Any TOD Area | 79.2% | 92.3% | 90.8% |
| 02. Share in Subway TOD Area | 73.1% | 91.7% | 88.6% |
| 03. Share in Rail TOD Area | 34.7% | 22.8% | 23.0% |
| Sources: NYU Furman Center | |||
Using the Census Bureau’s LEHD Origin-Destination Employment Statistics, we were able to map where people living in LDCDs commuted to for work (see Figure 17). In 2019 (the latest year available), workers who resided in LDCDs held jobs in locations similar to those of all New York City workers. For instance, Midtown Manhattan hosted the highest share of jobs held by residents of LDCDs (9.5%) followed by the Financial District (5.1%) and East Midtown (4.0%). These three community districts also hosted the highest share of jobs held by workers citywide. Workers residing in LDCDs were slightly more likely than the average New Yorker to commute to jobs in non-Manhattan central business districts such as Downtown Brooklyn, Flushing, and Long Island City. Additionally, a higher share of workers residing in LDCDs commuted to Staten Island for work, perhaps unsurprisingly given that all of Staten Island’s community districts are within the least dense quartile.
Figure 17:
Share of Jobs Held by Lowest-Density Community District Working Residents, by Community District of Job Location (Lowest-Density Community Districts Outlined in Black)
Sources: LEHD Origin-Destination Employment Statistics (Version 8), NYU Furman Center.
Due to the distance between Midtown Manhattan and LDCDs, pre-pandemic median commute times were longer for workers in the lowest-density community districts (40.1 minutes vs. 40.2 minutes citywide and 30.2 minutes in the highest-density community districts). Car ownership was much more common in LDCDs, with 81.9 percent of households owning at least one car and 45.7 percent owning at least two cars. Citywide, these rates were 55.1 percent and 21.0 percent, respectively. In 2019, about one-third of workers in LDCDs commuted to work by public transportation (37.1%), with about half of LDCD resident workers commuting by car (50.2%).
As we document elsewhere in the State of New York City’s Housing and Neighborhoods in 2022, New York City is facing a long-standing affordable housing shortage. That shortage has had significant implications for current residents, for the family members and friends who want to live in the city to be near current residents, and for the city’s ability to attract and house newcomers. It also affects businesses and cultural, educational, and non–profit organizations that seek to work with the innovative and creative talent for which the city is known. Housing costs have outpaced income gains since 2007, with the gap increasing dramatically since 2019, as real incomes of the city’s renters fell sharply in 2021. One result is that 54.1 percent of New York renters paid more than 30 percent of their income – the threshold of being cost-burdened – towards housing expenses in 2021. Further, homeownership remains out of reach for most New Yorkers and homeownership rates are unequal: while 43.3 percent of non-Hispanic white households and 45.2 percent of Asian-American households own their own home, only 27.6 percent of Black households, and 17.2 percent of Hispanic households are homeowners.
New York City has made significant efforts to add new housing, especially income-restricted affordable housing, over the decades since Mayor Ed Koch announced his Ten-Year Capital Plan for Housing. 11 But even so, the scale of building has not been enough to meet demand, and thereby create a more competitive rental or homeownership market. The gap between supply and demand stems from many causes. The city’s attempts to encourage more production are limited by state law, 12 slowed by well-intentioned but expensive and time-consuming environmental, historic preservation, and other reviews and the litigation they often provoke. 13 Efforts are also stalled by local community opposition and fears that sometimes fail to take the city’s overall interests into account 14 and frustrated by the high cost of building and property taxes in the city. 15
Our focus report from last year showed that despite the critical need for more housing, between 2010 and 2020, a number of the city’s community districts added very little new housing. 16 A 2021 Department of City Planning report also highlighted that in some parts of affluent neighborhoods, especially on Manhattan’s Upper East Side, Upper West Side, and in the Greenwich Village and Soho areas, net housing supply actually declined during that same period. 17 Nor are the suburban areas of Westchester and Long Island, whose residents enjoy both jobs and amenities in the city, meeting housing demand; indeed, both the city and even more dramatically the city’s suburbs are permitting housing at a rate that is a small fraction of what comparable metropolitan areas are adding to their housing stock. 18
Last year’s report also highlighted that multifamily development was unevenly distributed across the city: new income-restricted units targeted to low-income households tended to be built in neighborhoods with higher Black and Hispanic (of any race) population shares, higher poverty rates, and lower sales prices and rents than the neighborhoods where market-rate units were constructed. Over the past decade, housing development (both income-targeted and market rate) was largely concentrated in just a few community districts: five districts accounted for about 44 percent of new units (in properties with four or more units). 19 Many neighborhoods within the city, as well as the suburbs, therefore may need to do more to satisfy their obligations under the Fair Housing Act’s mandate to affirmatively further fair housing. 20
It is against this backdrop that both Mayor Eric Adams and Governor Hochul, as well as the City Council and some state legislators, have called for a dramatic expansion of both market-based housing and income-restricted affordable homes and apartments. Further, to address the barriers that limit housing supply, Governor Hochul proposed a “Housing Compact” that would require every community district in the city, and every local government in the metropolitan area, to permit enough housing so that the stock could increase by three percent every three years. 21 While no details have been publicly released, the Adams administration has promised a citywide “Zoning for Housing Opportunity” proposal to “expand[] and diversify[] the housing supply, in which every neighborhood does its part to help meet housing needs and provide equitable access to opportunity for New Yorkers.” 22 In May 2023, Adrienne Adams, Speaker of the New York City Council, proposed legislation that would require city agencies “to establish targeted housing production goals for each Community District to ensure each New York City neighborhood plays an equitable role in addressing the city’s housing crisis while accounting for unique community needs.” 23
Figure 18:
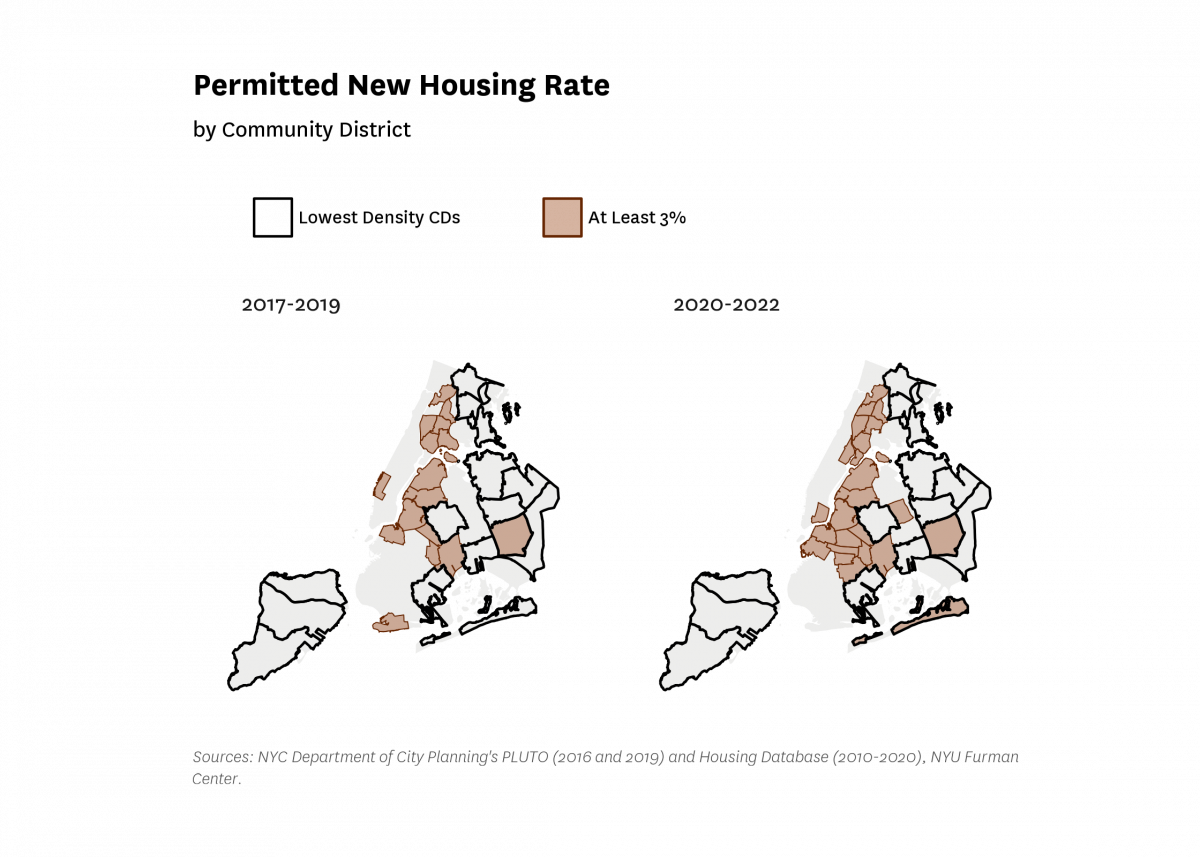
As Figure 18 shows, only two LDCDs (Jamaica/Hollis and Rockaway/Broad Channel, in a total of three instances) would have met the three percent over three years target in the two most recent three-year cycles (in this figure we do not double-count income-restricted units, which the Housing Compact proposal allows). The 2020 to 2022 period includes a year (2022) in which 421-a’s expiration caused a spike in permitting activity – even still, in a period with high rates of permitted new building, many of the city’s community districts fell short, especially LDCDs. Only one of the LDCDs met the target for both of the three-year periods. As the governor, state legislature, mayor and city council consider land use reform proposals, the profile of the lowest-density community districts that the analysis above provides suggests several key issues that must be addressed:
What process should be used to define growth targets? The three percent over three years standard in Governor Hochul’s Housing Compact is based upon an assessment of how much housing the city and state will need over the next decade to address the current shortage and meet expected population growth. 24 It does not take into account the nuance about particular differences among neighborhoods that, for example, the New York City Council’s proposed bill would require City of New York agencies to consider in setting neighborhood targets. 25
From the onset, policymakers will need to determine the details of the process that will be used to assign targets to each community district or local government. Governor Hochul’s proposed Housing Compact sets one target for all local governments and community districts in the metropolitan area, and a lower target for all local governments outside that area. That approach has the advantage of simplicity and limits the possibility of political or other non-substantive influences on the assignment of targets. The Governor’s approach is similar to the strategy Massachusetts has used successfully. 26 The New York City Council’s approach, which is similar to approaches used in New Jersey and California, allows for more fine-tuning to take into account particular features of different community districts. But experience outside of New York shows that this type of exercise is fraught with danger. Disputes and litigation over different targets have plagued the states that have tried to be more context-specific in setting targets, and concerns about political influence, the greater political power of some localities, and the ways in which some neighborhoods have gamed the system have undermined the credibility of the targets.
Of course, whatever the process, the targets chosen will have to be realistic. Past performance should not be a primary guide because those tempered construction rates have contributed to the current affordability crisis. Past performance also has been highly variable among different localities and is often a legacy of racial and other discrimination. Nor can infrastructure deficits be a significant check on what’s realistic – the need for investments in infrastructure may affect the timing of development, but infrastructure deficits have long been weaponized to preserve the status quo. Infrastructure gaps signal the need for better planning and coordination, which will affect the technical and financing assistance local governments need to meet their targets, but should not excuse limits on development. In LDCDs (and the suburbs with similar land use patterns), a realistic strategy should take into account the ways in which “gentle density”– such as accessory dwelling units (like apartments above garages or so-called “in-law” apartments within existing single-family homes), or conversions that divide a single-family house into a duplex, for example 27 – can add meaningful amounts of housing without changing the look of the existing neighborhood, as described more fully below.
How to encourage the equitable distribution of growth within community districts? As the analysis in Table 2 above shows, even within the lowest-density community districts, there are census tracts that are much lower income, and with higher shares of renters and Black and Hispanic (of any race) residents, than in other neighborhoods within the community district. There are many reasons that any mandate or target is best allocated at the community district level. The community districts are the jurisdictional boundaries used for many budgeting and service provision decisions, and for data collection and reporting requirements. They are represented by community boards, and those boards have defined responsibilities and processes that would help the neighborhood tailor its response to the housing affordability crisis. Moving the focus to smaller geographies (such as census tracts or ZIP Codes) would require an entirely new community engagement and decision-making structure, and would pose considerable coordination problems. But policymakers should consider how best to encourage community boards, elected officials, and city agencies to equitably distribute growth within each community district as well.
How can LDCDs, which are already fairly built out with single and two-family homes, use vacant or non-residential land, and gentle density housing types, to expand housing capacity without dramatically changing the neighborhood? The least disruptive way to add capacity to the LDCDs may be to identify underused land that may be suitable for housing. 28 As Table 5 above shows, about 15 percent of the land in the LDCDs is either vacant or used for commercial or office buildings. Those parcels may provide opportunities to build new housing or mixed-use buildings or to convert underused buildings to housing. As the Department of City Planning crafts its Zoning for Housing Opportunity proposal, it should take a hard look at whether any sites could be repurposed for housing. Because the financing of income-restricted affordable housing often requires larger buildings, those sites may be particularly valuable for affordable housing (92% of the affordable housing units built between 2010 and 2020 were built in buildings with 50 or more units). 29 The city’s housing agencies have experimented with innovative ways to use small, irregularly shaped lots, 30 and lessons learned from those experiments can help ensure that all land is put to good use.
Aside from such underused sites, meeting the growth targets being proposed can be accomplished by gentle density. Even a relatively simple amendment to the zoning resolution that allowed accessory dwelling units to be available for the approximately 376,865 properties containing 1-2 family homes in LDCDs would be enough to meet a one percent annual growth target if only 2.4 percent of those properties added an accessory dwelling unit. 31
As the city drafts its Zoning for Housing Opportunity proposal, it will be critical to provide simple ways for homeowners to add residential capacity through a range of housing types. Planners and architects will need to think creatively about how allowing ADUs, permitting existing homes to be reconfigured into duplexes, or allowing small apartment buildings on corner lots, for example, could open the door for additional housing while respecting the housing typologies of neighboring properties. Further, in the lowest-density districts, many (if not most) property owners who might consider adding an ADU will be individual households, and therefore have less experience in, or knowledge about, property development or management than landlords or co-op and condo associations. 32 Care will need to be taken to make the process of adding an ADU as user-friendly as possible to those owners, if they are to take the risks needed to add an income stream. Reforms will need to reduce the difficulty of securing permits, but also may require governments to help make the process easier by providing technical assistance, pre-approved plans, guides to financing options, or help in identifying reliable contractors.
How can the role the lowest-density community districts are playing in reducing the racial and ethnic homeownership gap be protected and furthered? The homeownership rate of Black New Yorkers, at 27.6 percent, falls considerably short of the rate for non-Hispanic white New Yorkers (43.3%), as does the 17.2 percent homeownership rate of Hispanic New Yorkers of all races. But as Figure 5 above shows, a higher share of homeowners in LDCDs are non-white households than in the city overall, and as Figure 7 shows, all types of residential properties were lower cost on a per unit basis in LDCDs and HDCDs in 2022. In addition to the relatively lower home prices that LDCDs offer, identifying what makes homeownership more attainable and desirable in the lowest-density community districts might help the City craft policies to protect existing homeowners and further reduce the homeownership racial and ethnic gap.
How can policymakers be encouraged to specifically consider how proposed budgeting decisions and other policies may affect housing production in LDCDs? As the city and state strive to adopt policies requiring that all communities allow more housing production, they will need to pay particular attention to how to craft those policies to account for the unique characteristics of LDCDs. Making regulations, financing tools, and technical assistance as user-friendly and efficient as possible is critical (as noted above regarding ADU policies). Similarly, in general, policymakers need to pay particular attention to how regulations that add costs or make the development or management of housing more difficult or time-consuming affect the housing in LDCDs. Expecting supply to come from homeowners adding small amounts of housing to existing parcels will not work if homeowners face processes that are designed for larger dwellings and fail to take into account the challenges owners of just a single home or a few units may face. Proposed building and housing maintenance code changes, historic preservation decisions and requirements, energy efficiency mandates and opportunities, tenant protections, and similar regulatory changes should include specific consideration of how they might affect the housing capacity of the LDCDs, and how they can be adapted for the building types and neighborhood ownership patterns in the city’s lowest density areas.
Addressing New York City’s longstanding housing shortage requires the examination of how all types of neighborhoods can accommodate more housing and residents. Despite efforts to add new housing across the city, the scale of building has not been enough to meet demand. State and local policymakers accordingly are considering a range of proposals to allow market-based and income-restricted affordable housing.
How New York City’s lowest-density neighborhoods fit into these visions presents unique opportunities and challenges for New York City policymakers, urban design experts, architects, affordable housing developers, and community organizations. LDCDs include areas that are anchors of Black homeownership, and of the 46 percent of households residing in LDCDs who are renters, about half live in smaller buildings. At the same time, the highest share of housing in LDCDs comes from single-family homes, and in the lowest-density portions of LDCDs, this share is close to 90 percent. In these areas in particular, the median income and homeownership rate is far higher than the citywide rate, as is the share of the population that identifies as white. While workers who resided in LDCDs held jobs in very similar locations as all of the city’s workers before the pandemic (with the highest share of jobs held by LDCD residents located in Midtown), transportation access presents critical challenges, with 50 percent of LDCD resident workers commuting to work by car.
How to achieve fair and equitable growth within the city, given the broad range of neighborhood types the city contains, requires a lot more thought about how to achieve growth in different kinds of neighborhoods while still allowing a diversity of neighborhood types to flourish. LDCDs have permitted housing at half the rate of the city as a whole (higher-density areas have also been laggards, with the difference made up by the middle-density neighborhoods). In these discussions, it is critical to keep in mind the Fair Housing Act's mandate to "affirmatively further fair housing." The city will need to refine existing policies and adopt new strategies to enable and require LDCDs to play a more significant role in helping to address the housing shortage than they have been playing, without giving up on the advantages these neighborhoods offer in helping to reduce the homeownership wealth gap, and providing a variety of housing types to meet New Yorkers’ needs.
All content © 2005 – 2024 Furman Center for Real Estate and Urban Policy | Top of page | Contact Us