| Indicator | 2000 | 2006 | 2010 | 2019 | 2021 | 2022 |
|---|---|---|---|---|---|---|
| Population | ||||||
| Born in New York State | 54.9% | 50.0% | 52.5% | 53.9% | ||
| Disabled population | 5.0% | 6.8% | 6.3% | |||
| Foreign-born population | 35.9% | 39.1% | 43.8% | 41.8% | 40.9% | |
| Population | 116,749 | 117,784 | 120,428 | 114,562 | 121,130 | |
| Population aged 65+ | 17.2% | 16.0% | 16.2% | 20.6% | 22.1% | |
| Households | ||||||
| Households with children under 18 years old | 30.7% | 26.1% | 29.8% | 25.1% | 25.4% | |
| Single-person households | 30.0% | 27.1% | 25.8% | 26.6% | ||
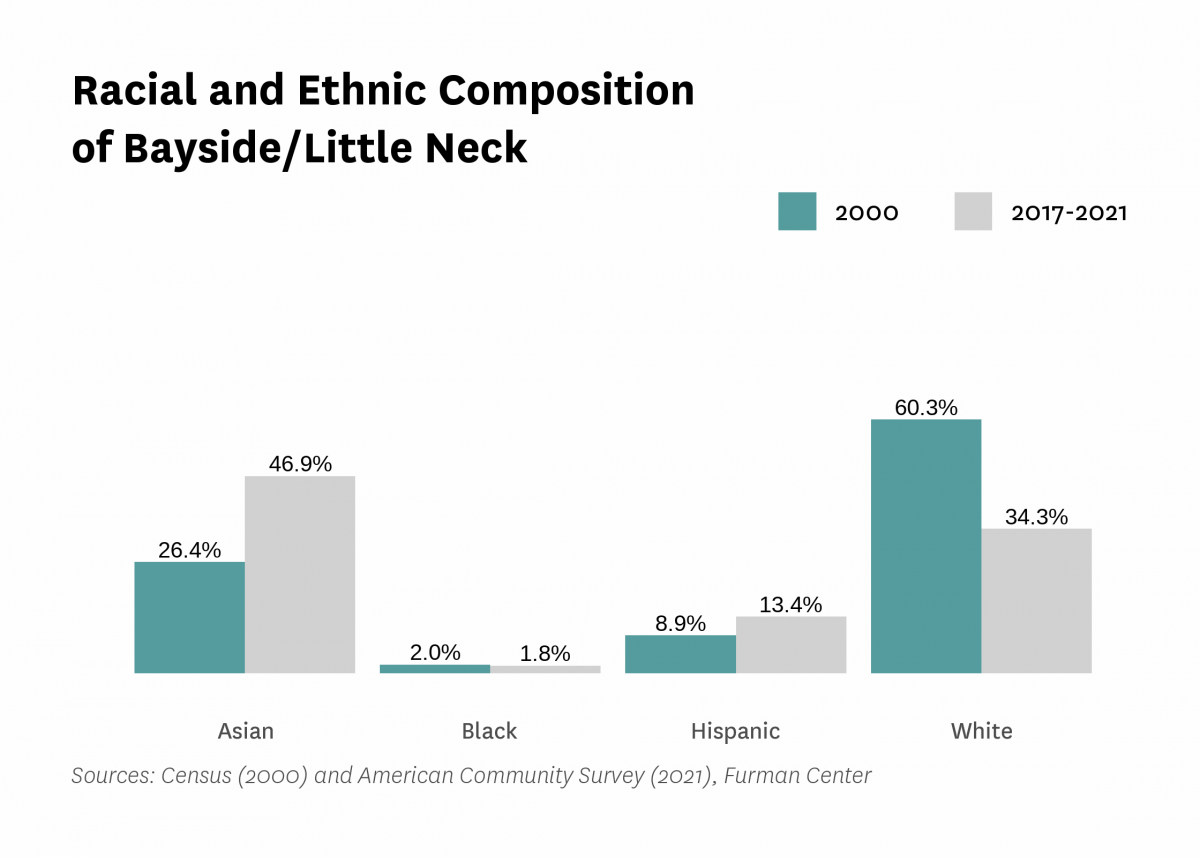
| Race and Ethnicity | ||||||
| Percent Asian | 26.4% | 32.4% | 38.2% | 41.1% | 46.9% | |
| Percent Black | 2.0% | 1.9% | 0.9% | 6.0% | 1.8% | |
| Percent Hispanic | 8.9% | 13.5% | 12.8% | 13.4% | 13.4% | |
| Percent white | 60.3% | 50.8% | 46.2% | 37.9% | 34.3% | |
| Racial diversity index | 0.56 | 0.62 | 0.62 | 0.67 | 0.64 | |
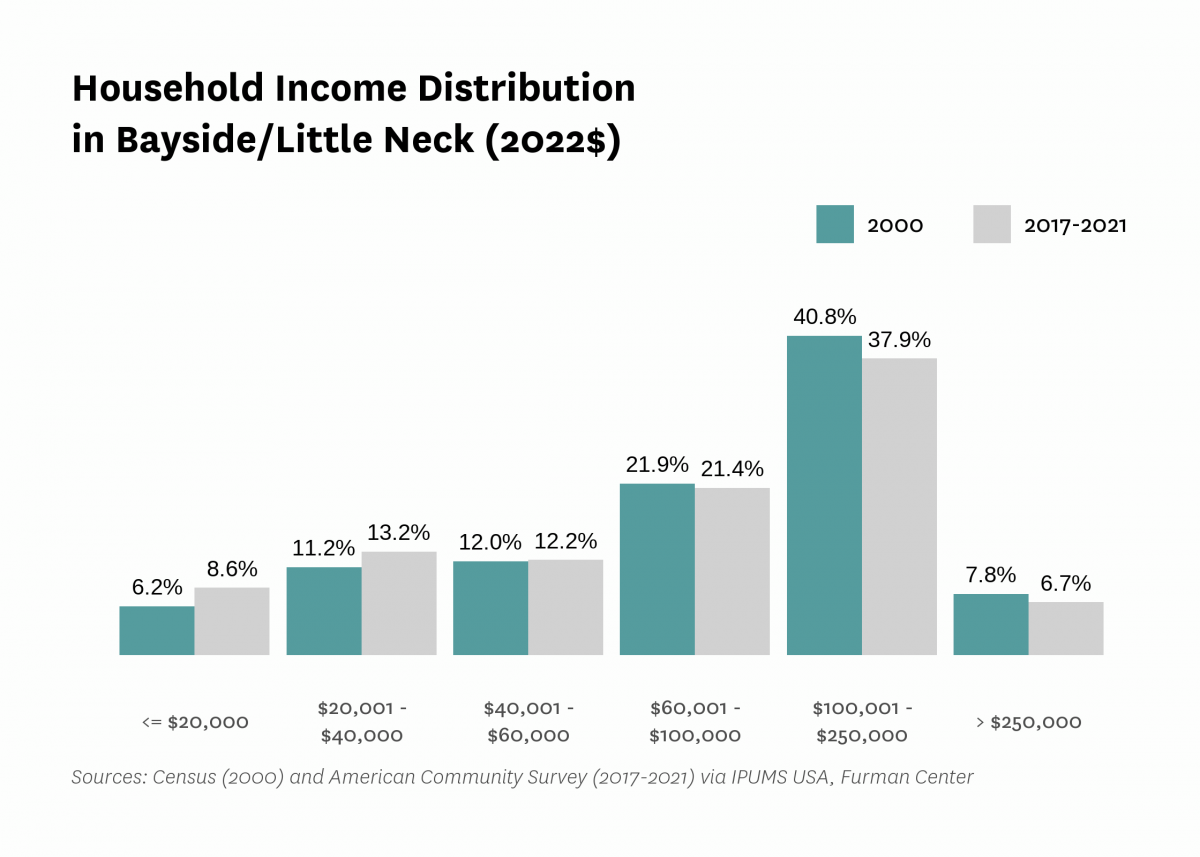
| Income and Poverty | ||||||
| Income diversity ratio | 4.9 | 4.2 | 5.0 | 4.6 | ||
| Median household income (2022$) | $99,000 | $94,820 | $90,770 | $103,340 | $92,020 | |
| Median household income, homeowners (2022$) | $104,750 | $97,590 | $113,520 | $108,390 | ||
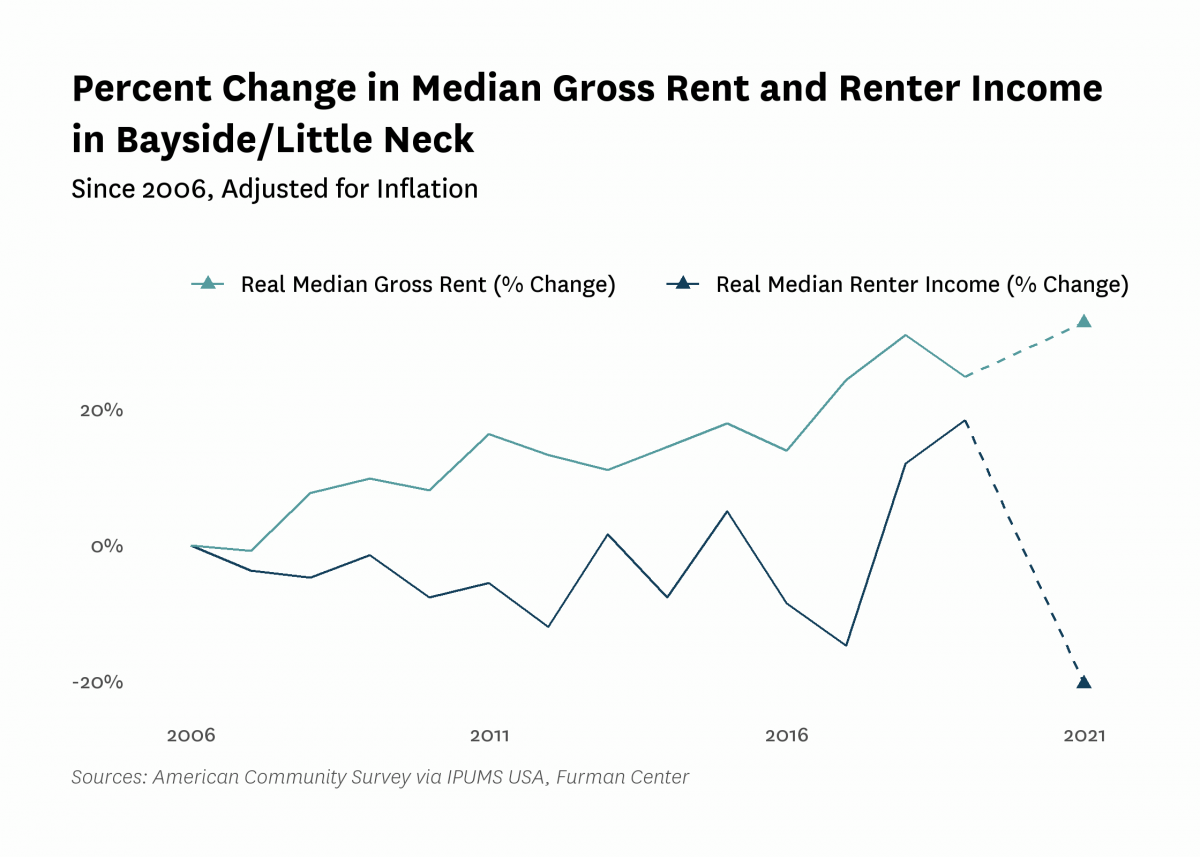
| Median household income, renters (2022$) | $74,160 | $68,500 | $87,830 | $59,110 | ||
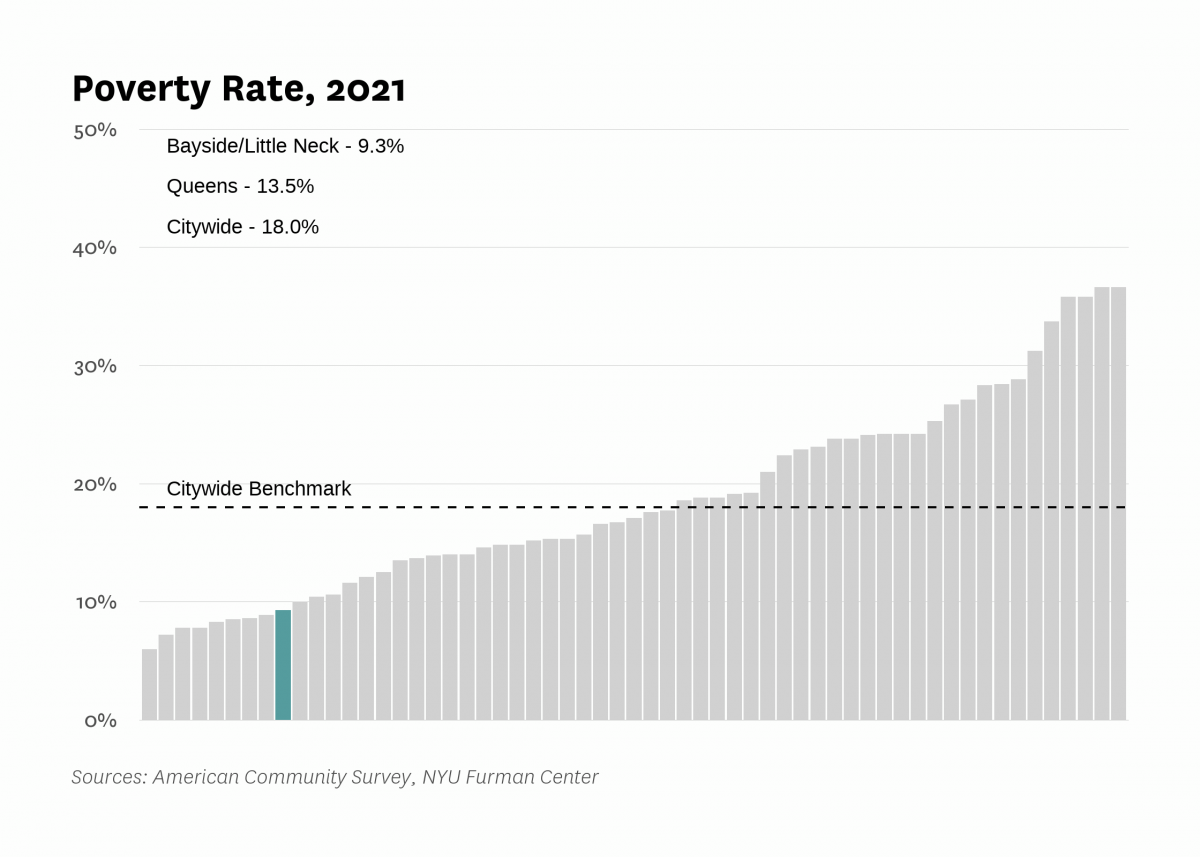
| Poverty rate | 6.5% | 5.8% | 7.3% | 6.4% | 9.3% | |
| Poverty rate, population aged 65+ | 5.4% | 5.7% | 11.3% | 9.5% | ||
| Poverty rate, population under 18 years old | 8.7% | 8.2% | 3.4% | 11.2% | ||
| Labor Market | ||||||
| Labor force participation rate | 64.6% | 65.0% | 62.2% | 61.0% | ||
| Population aged 25+ without a high school diploma | 14.4% | 10.7% | 13.1% | 14.6% | ||
| Unemployment rate | 4.10% | 4.39% | 9.65% | 3.89% | 8.56% | |
| Indicator | 2000 | 2006 | 2010 | 2019 | 2021 | 2022 |
|---|---|---|---|---|---|---|
| Housing Stock | ||||||
| Homeownership rate | 67.3% | 70.8% | 70.7% | 68.9% | 71.0% | |
| Housing units | 49,999 | 47,336 | 45,961 | 47,626 | ||
| Rental vacancy rate | 4.8% | 3.2% | 3.9% | |||
| Serious housing code violations (per 1,000 privately owned rental units) | 5.4 | 7.1 | 7.0 | 15.0 | 21.9 | |
| Severe crowding rate (% of renter households) | 1.1% | 3.0% | 2.4% | |||
| Total housing code violations (per 1,000 privately owned rental units) | 47.3 | 46.4 | 37.5 | 119.7 | 138.4 | |
| Finance - Distress | ||||||
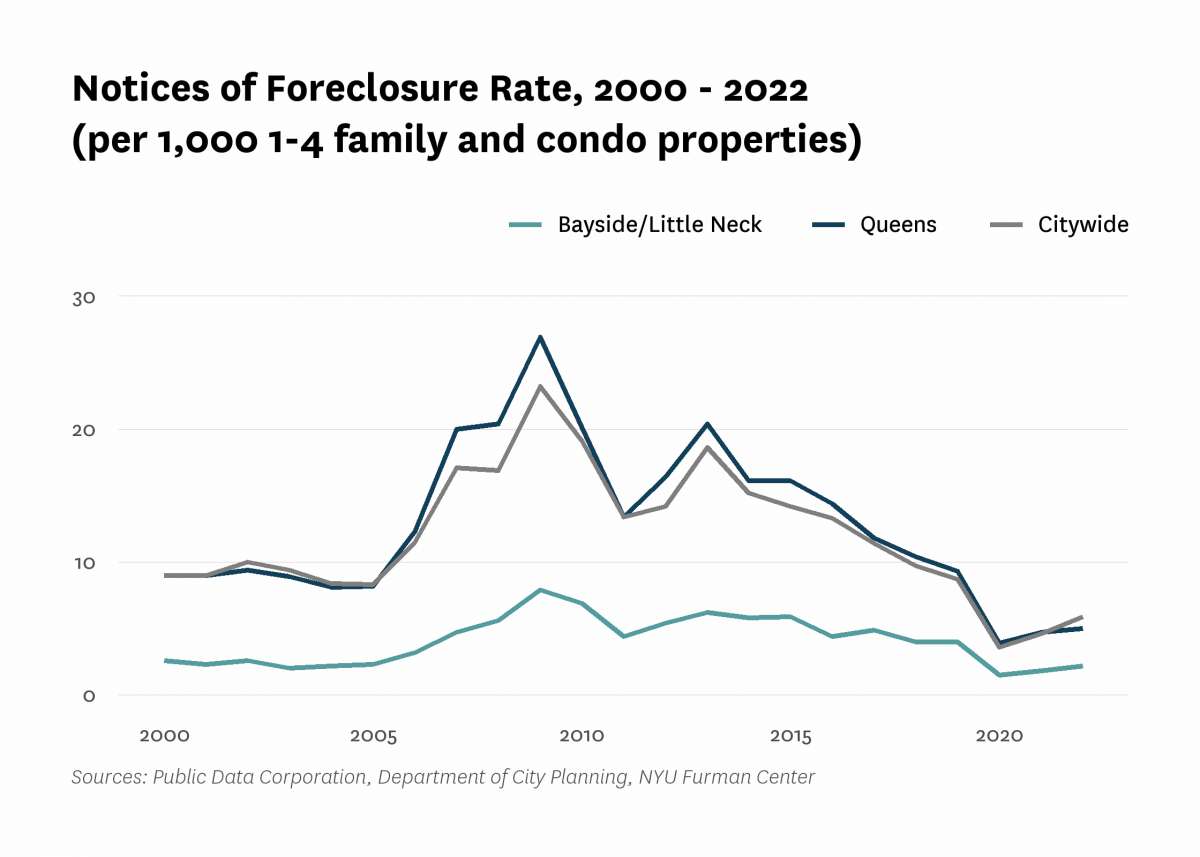
| Notices of foreclosure rate (per 1,000 1-4 family and condo properties) | 2.6 | 3.2 | 6.9 | 4.0 | 1.8 | 2.2 |
| Notices of foreclosure, all residential properties | 65 | 80 | 177 | 102 | 47 | 56 |
| Notices of foreclosure, initial, 1-4 family and condo properties | 49 | 66 | 144 | 39 | 14 | 23 |
| Notices of foreclosure, repeat, 1-4 family and condo properties | 16 | 14 | 30 | 63 | 32 | 32 |
| Pre-foreclosure notice rate (per 1,000 1-4 family and condo properties) | 22.0 | 8.5 | 18.5 | |||
| Pre-foreclosure notices, 1-4 family and condo properties | 560 | 216 | 471 | |||
| Properties entering REO, 1-4 family | 0 | 0 | 7 | |||
| Finance - Lending | ||||||
| FHA/VA-backed home purchase loans (% of home purchase loans) | 0.0% | 2.1% | 0.6% | 0.8% | ||
| Higher-cost home purchase loans (% of home purchase loans) | 6.0% | 0.6% | 4.8% | 7.3% | ||
| Higher-cost refinance loans (% of refinance loans) | 15.5% | 1.0% | 3.8% | 2.1% | ||
| Home purchase loan rate (per 1,000 properties) | 38.8 | 23.3 | 25.3 | 34.7 | ||
| Home purchase loans in LMI tracts (% of home purchase loans) | 0.1% | 9.8% | 0.0% | 0.0% | ||
| Home purchase loans to LMI borrowers (% of home purchase loans) | 4.2% | 0.0% | 10.2% | 14.4% | ||
| Refinance loan rate (per 1,000 properties) | 25.7 | 20.5 | 14.2 | 35.3 | ||
| Sales - Volume | ||||||
| Sales volume, 1 family building | 653 | 699 | 432 | 441 | 599 | 631 |
| Sales volume, 2-4 family building | 144 | 252 | 121 | 123 | 123 | 164 |
| Sales volume, 5+ family building | 2 | 0 | 2 | 3 | 4 | 3 |
| Sales volume, condominium | 83 | 95 | 51 | 60 | 84 | 67 |
| Sales volume, all property types | 882 | 1,046 | 606 | 627 | 810 | 865 |
| Sales - Median Prices | ||||||
| Median sales price per unit, 1 family building (2022$) | $594,790 | $938,010 | $811,200 | $1,003,460 | $1,007,970 | $990,000 |
| Median sales price per unit, 2-4 family building (2022$) | $308,020 | $519,950 | $468,690 | $612,850 | $663,140 | $600,000 |
| Median sales price per unit, 5+ family building (2022$) | $63,020 | $356,780 | $312,190 | $115,470 | $266,000 | |
| Median sales price per unit, condominium (2022$) | $368,770 | $611,290 | $572,990 | $728,500 | $636,620 | $675,000 |
| Sales - Housing Price Index | ||||||
| Index of housing price appreciation, 1 family building | 100.0 | 186.7 | 173.2 | 260.3 | 279.8 | 292.8 |
| Index of housing price appreciation, 2-4 family building | 100.0 | 175.4 | 181.6 | 270.3 | 297.0 | 312.8 |
| Index of housing price appreciation, 5+ family building | 100.0 | 880.8 | 74.4 | |||
| Index of housing price appreciation, condominium | 100.0 | 222.0 | 203.5 | 295.7 | 282.7 | 318.8 |
| Index of housing price appreciation, all property types | 100.0 | 189.3 | 179.9 | 268.3 | 283.2 | 300.4 |
| Subsidized Housing | ||||||
| Total number of subsidized properties (properties) | 1 | |||||
| HUD Financing or Insurance (properties) | 1 | |||||
| HUD Financing or Insurance (units) | 0 | |||||
| HUD Project-based Rental Assistance Program (properties) | 0 | |||||
| HUD Project-based Rental Assistance Program (units) | 0 | |||||
| Low Income Housing Tax Credit (properties) | 0 | |||||
| Low Income Housing Tax Credit (units) | 0 | |||||
| Public Housing (properties) | 0 | |||||
| Public Housing (units) | 0 | |||||
| Mitchell-Lama (properties) | 0 | |||||
| Mitchell-Lama (units) | 0 | |||||
| 421-a Tax Exemption (properties) | 8 | |||||
| 421-a Tax Exemption (units) | 88 | |||||
| 420-c Tax Exemption (properties) | 0 | |||||
| 420-c Tax Exemption (units) | 0 | |||||
| NYC Housing Production Programs and Zoning Incentives or Requirements (properties) | 0 | |||||
| Eligible to expire from housing programs between 2023 and 2028 (properties) | 0 | |||||
| Eligible to expire from housing programs between 2023 and 2028 (units) | 0 | |||||
| Eligible to expire from housing programs between 2029 and 2038 (properties) | 0 | |||||
| Eligible to expire from housing programs between 2029 and 2038 (units) | 0 | |||||
| Eligible to expire from housing programs in 2039 and later (properties) | 1 | |||||
| Eligible to expire from housing programs in 2039 and later (units) | 0 | |||||
| Indicator | 2000 | 2006 | 2010 | 2019 | 2021 | 2022 |
|---|---|---|---|---|---|---|
| Density | ||||||
| Population density (1,000 persons per square mile) | 12.7 | 12.9 | 12.3 | 13.0 | ||
| Development | ||||||
| Units authorized by new residential building permits | 51 | 0 | 92 | 59 | 133 | 64 |
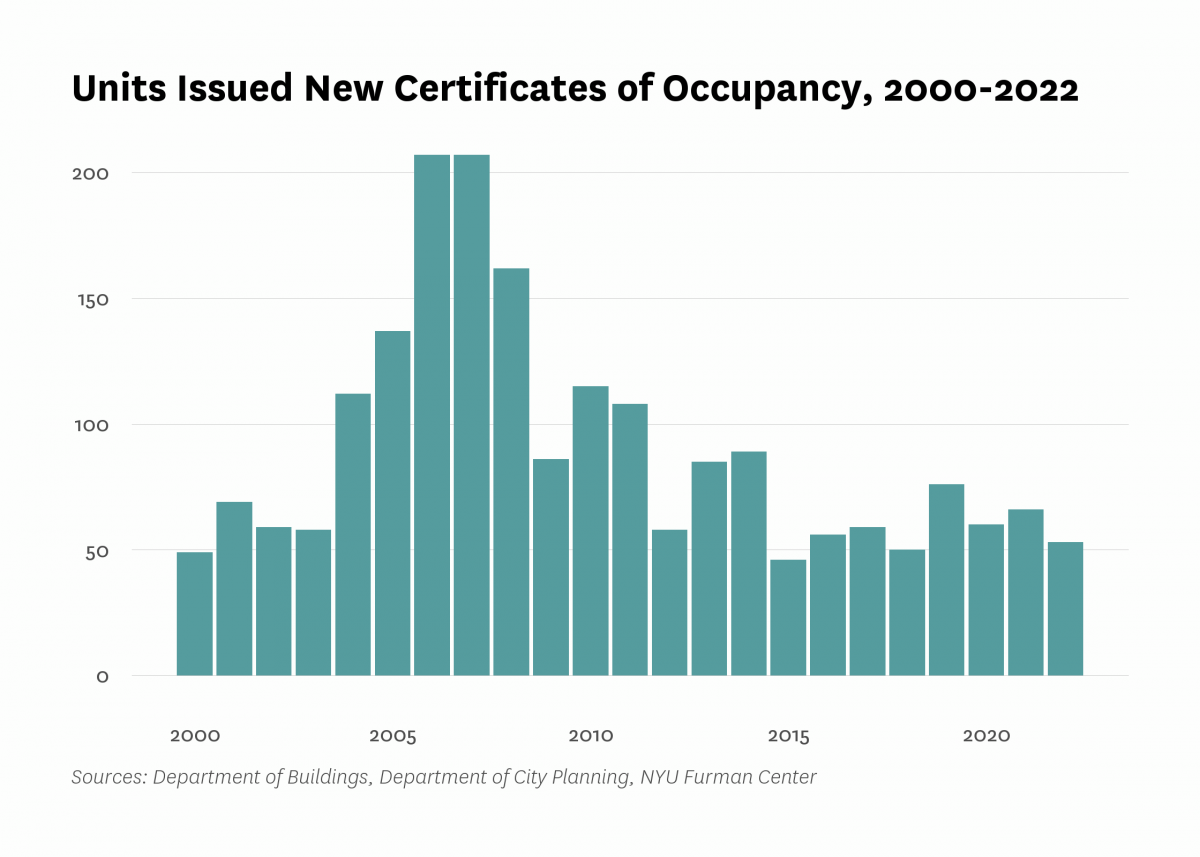
| Units issued new certificates of occupancy | 49 | 207 | 115 | 76 | 66 | 53 |
| Indicator | 2000 | 2006 | 2010 | 2019 | 2021 | 2022 |
|---|---|---|---|---|---|---|
| Commute | ||||||
| Car-free commute (% of commuters) | 30.6% | 36.1% | 33.5% | 34.5% | 25.7% | |
| Mean travel time to work (minutes) | 39.8 | 38.9 | 40.6 | 44.2 | 39.9 | |
| Crime and Incarceration | ||||||
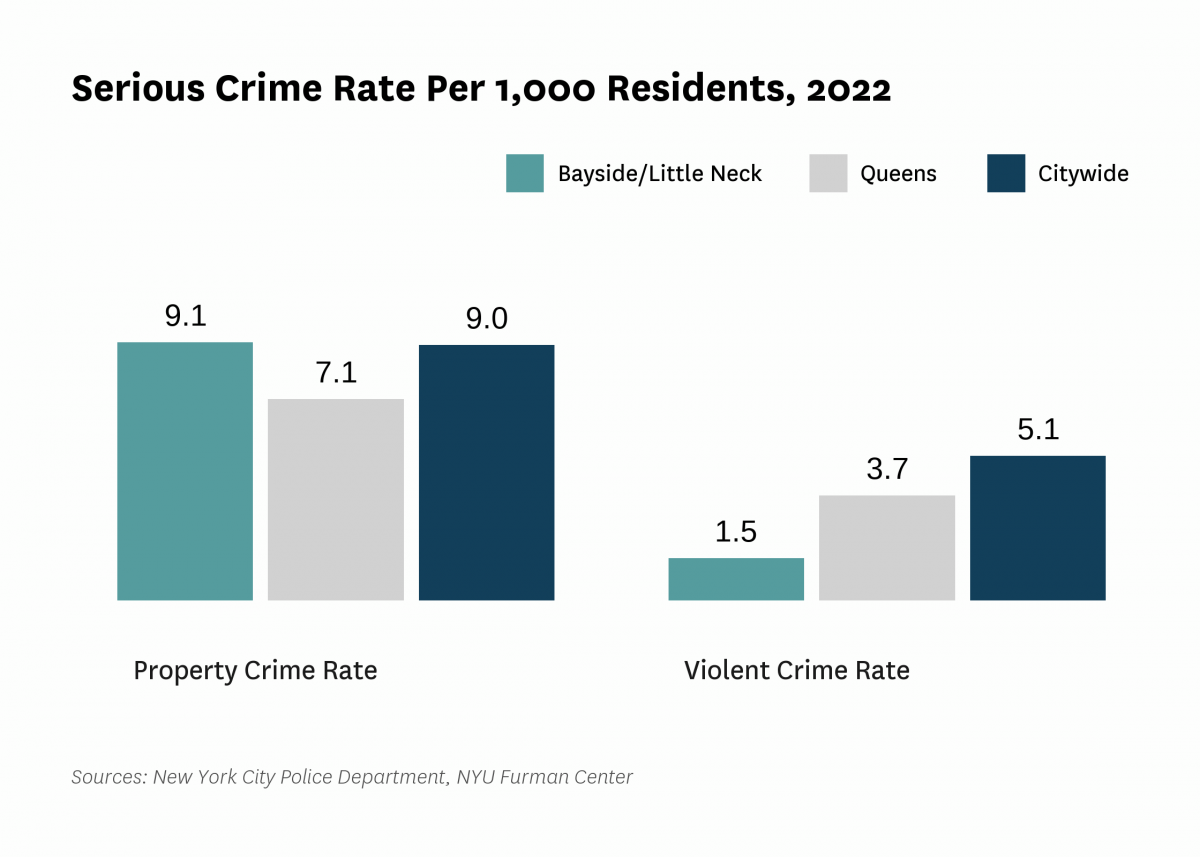
| Serious crime rate (per 1,000 residents) | 9.9 | 7.7 | 6.2 | 7.1 | 10.6 | |
| Serious crime rate, property (per 1,000 residents) | 8.5 | 6.6 | 5.3 | 6.2 | 9.1 | |
| Serious crime rate, violent (per 1,000 residents) | 1.5 | 1.1 | 0.9 | 0.9 | 1.5 | |
| Schools | ||||||
| Students performing at grade level in English language arts, 4th grade | 77.2% | 73.7% | ||||
| Students performing at grade level in math, 4th grade | 83.1% | 81.8% | ||||
| Indicator | 2000 | 2006 | 2010 | 2019 | 2021 | 2022 |
|---|---|---|---|---|---|---|
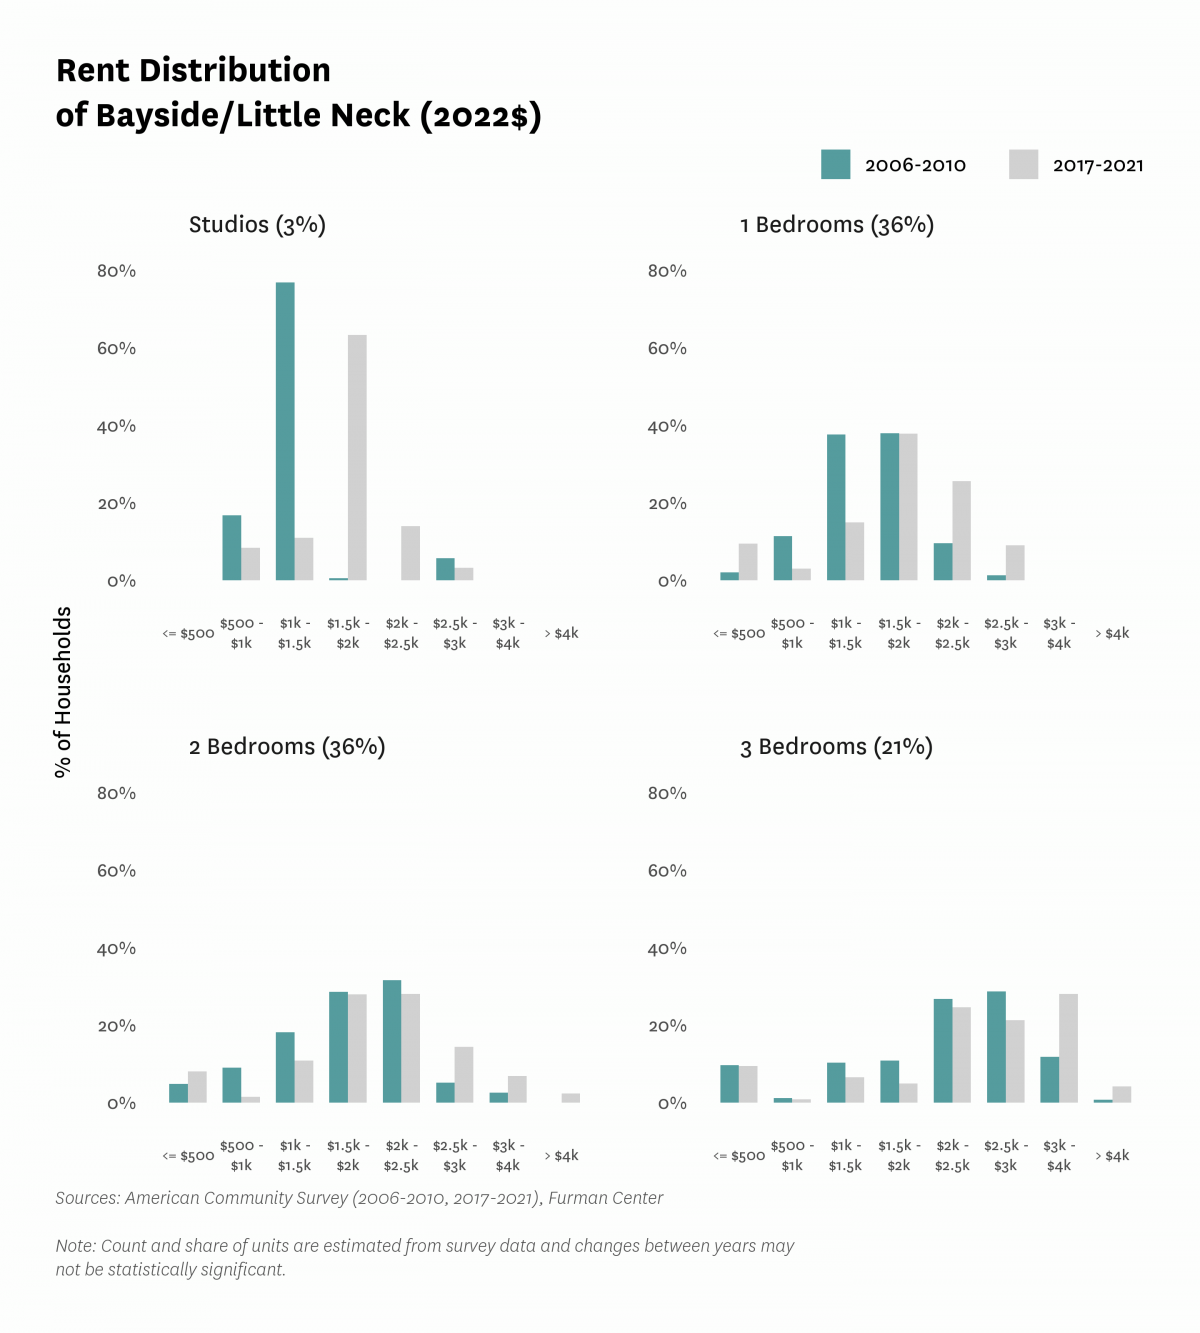
| Median Rent | ||||||
| Median rent, 2- and 3-bedrooms (2022$) | $2,030 | $2,050 | $2,380 | |||
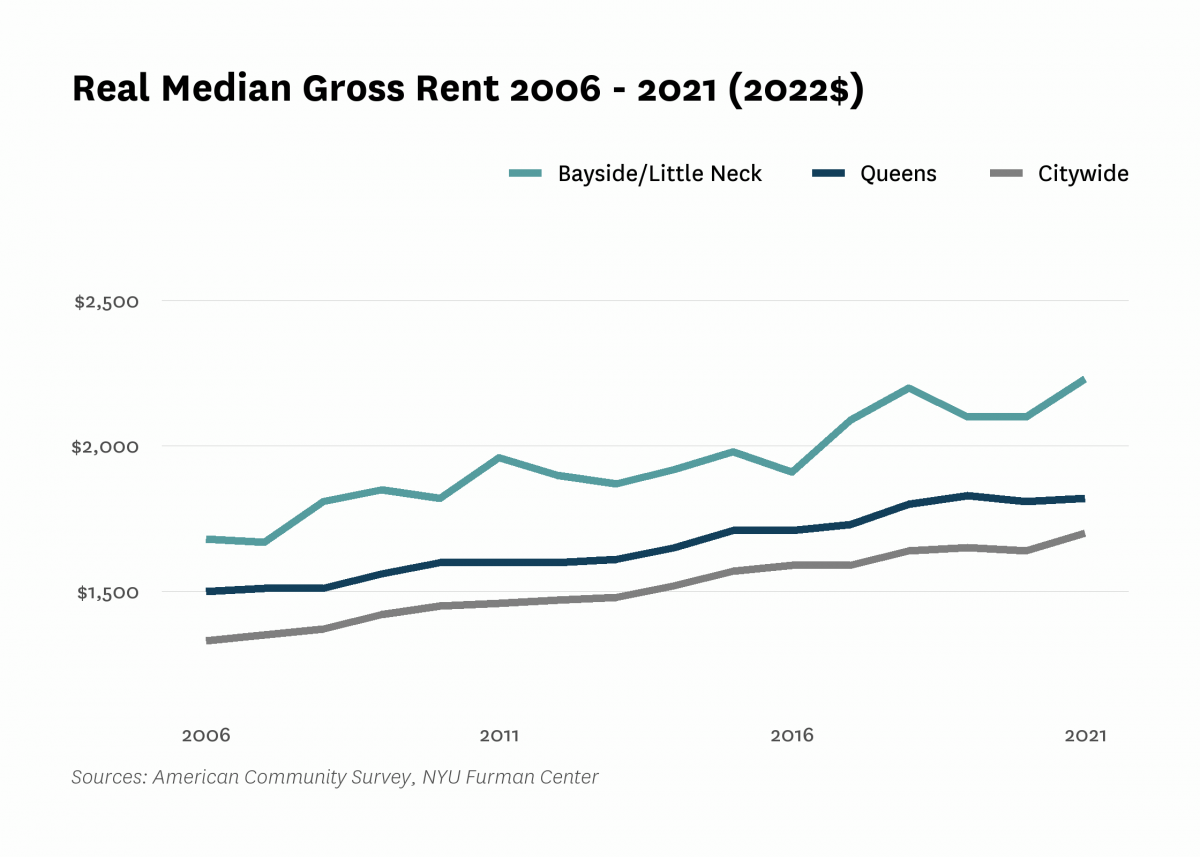
| Median rent, all (2022$) | $1,540 | $1,680 | $1,820 | $2,100 | $2,230 | |
| Median rent, recent movers (2022$) | $2,020 | $2,120 | $2,550 | |||
| Median rent, studios and 1-bedrooms (2022$) | $1,460 | $1,730 | $1,800 | |||
| Affordability | ||||||
| Rental units affordable at 30% AMI (% of recently available units) | ||||||
| Rental units affordable at 80% AMI (% of recently available units) | ||||||
| Rental units affordable at 120% AMI (% of recently available units) | ||||||
| Rent Burden | ||||||
| Moderately rent-burdened households | 22.8% | 22.7% | 22.4% | 23.8% | ||
| Moderately rent-burdened households, low income | 34.3% | 35.7% | 29.5% | |||
| Moderately rent-burdened households, moderate income | 23.3% | 25.6% | 23.1% | |||
| Severely rent-burdened households | 19.7% | 26.3% | 26.2% | 29.8% | ||
| Severely rent-burdened households, low income | 55.7% | 47.6% | 57.9% | |||
| Severely rent-burdened households, moderate income | 1.3% | 1.2% | 1.0% | |||
| Rental Subsidy | ||||||
| Housing choice vouchers (% of occupied, privately owned rental units) | 0.2% | 0.0% | ||||
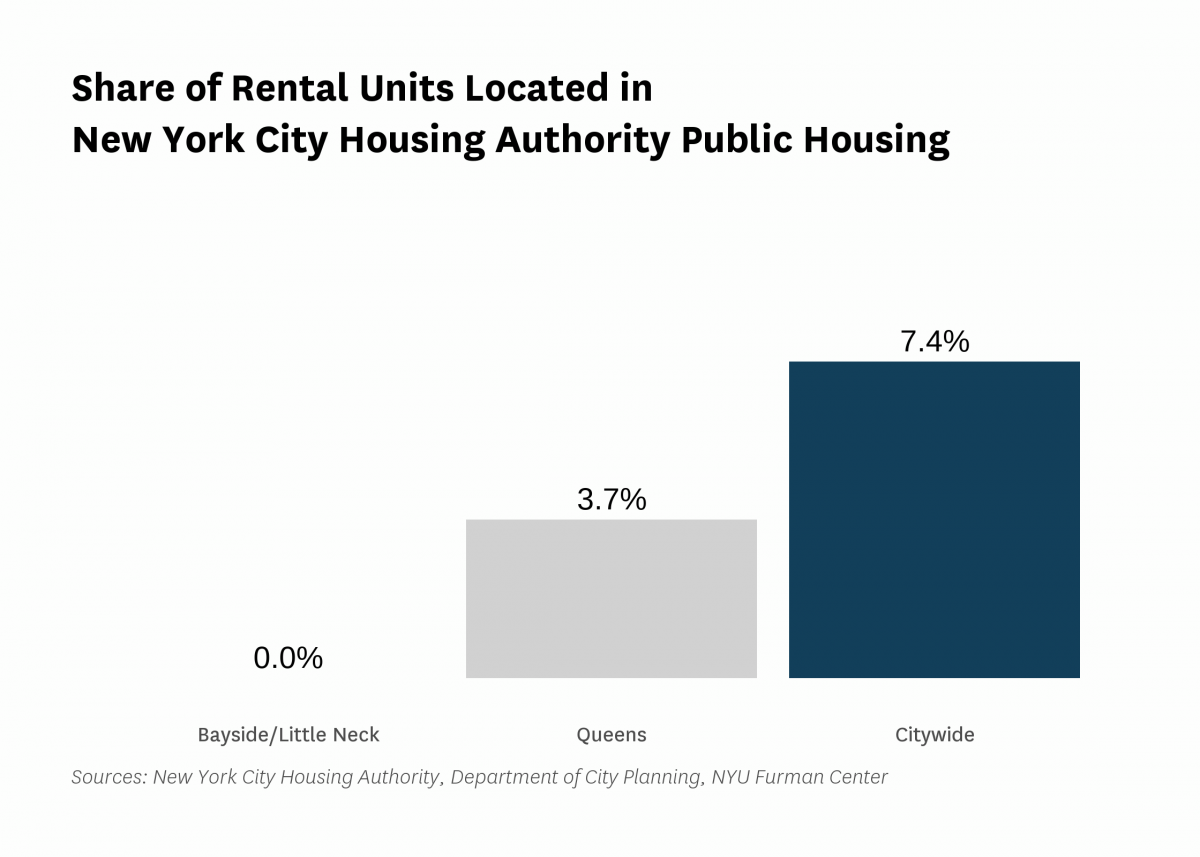
| Public housing (% of rental units) | 0.0% | |||||
Data Notes: See CoreData User Guide for more information about indicator definitions and methods.
Indicators: The rental vacancy rate, severe crowding rate, and the severely rent-burdened households indicators use five-year American Community Survey (ACS) estimates. Data under the 2010 heading comes from the 2006 – 2010 ACS, data under the 2019 heading comes from the 2015 – 2019 ACS and data under the 2021 heading comes from 2017 – 2021 ACS .
All content © 2005 – 2024 Furman Center for Real Estate and Urban Policy | Top of page | Contact Us