| Indicator | 2000 | 2006 | 2010 | 2019 | 2021 | 2022 |
|---|---|---|---|---|---|---|
| Population | ||||||
| Born in New York State | 47.9% | 46.2% | 46.9% | 48.5% | ||
| Disabled population | 8.6% | 6.8% | 8.3% | |||
| Foreign-born population | 34.2% | 40.8% | 42.3% | 45.1% | 45.3% | |
| Population | 218,993 | 216,115 | 222,074 | 241,275 | 270,688 | |
| Population aged 65+ | 11.3% | 11.3% | 11.2% | 15.1% | 14.6% | |
| Households | ||||||
| Households with children under 18 years old | 44.9% | 42.3% | 42.0% | 36.9% | 36.6% | |
| Single-person households | 23.7% | 21.1% | 22.2% | 21.7% | ||
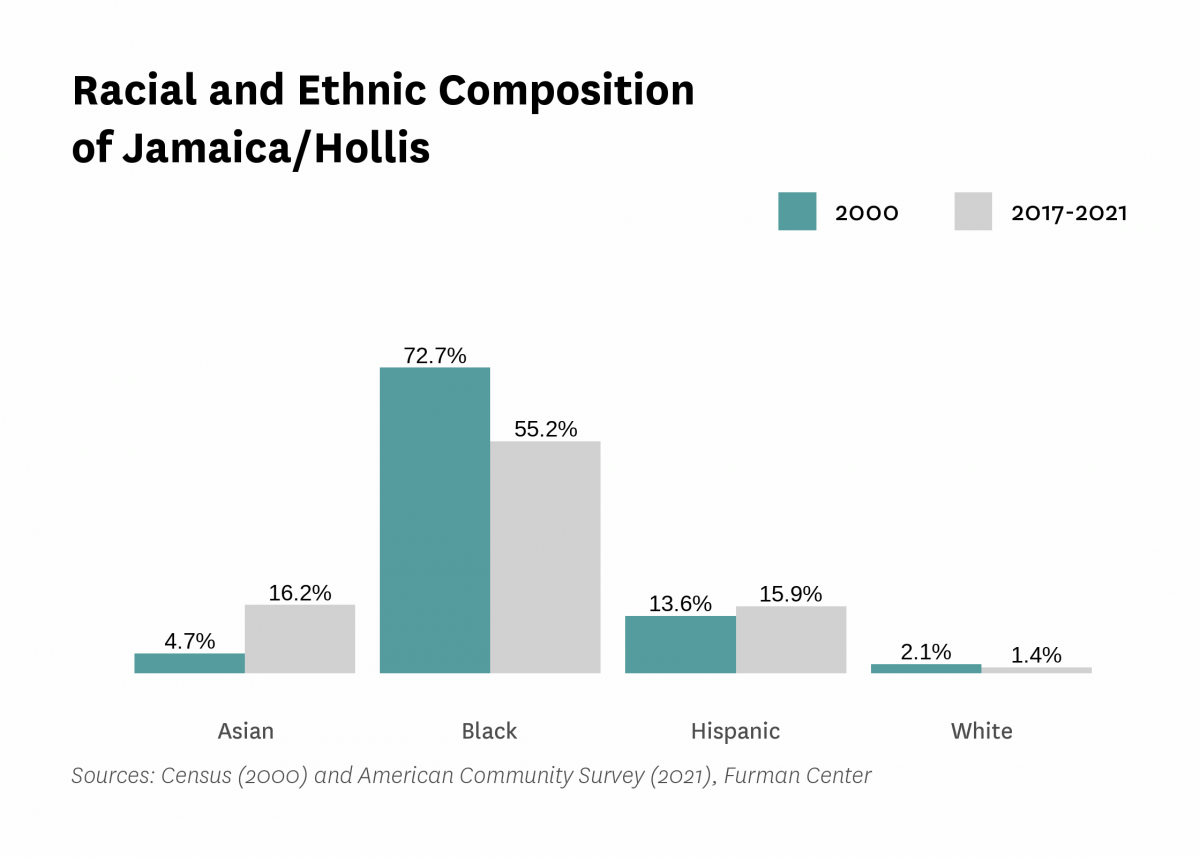
| Race and Ethnicity | ||||||
| Percent Asian | 4.7% | 10.4% | 9.2% | 14.2% | 16.2% | |
| Percent Black | 72.7% | 69.1% | 62.5% | 58.6% | 55.2% | |
| Percent Hispanic | 13.6% | 13.6% | 21.4% | 18.0% | 15.9% | |
| Percent white | 2.1% | 1.8% | 1.6% | 2.3% | 1.4% | |
| Racial diversity index | 0.45 | 0.49 | 0.55 | 0.60 | 0.64 | |
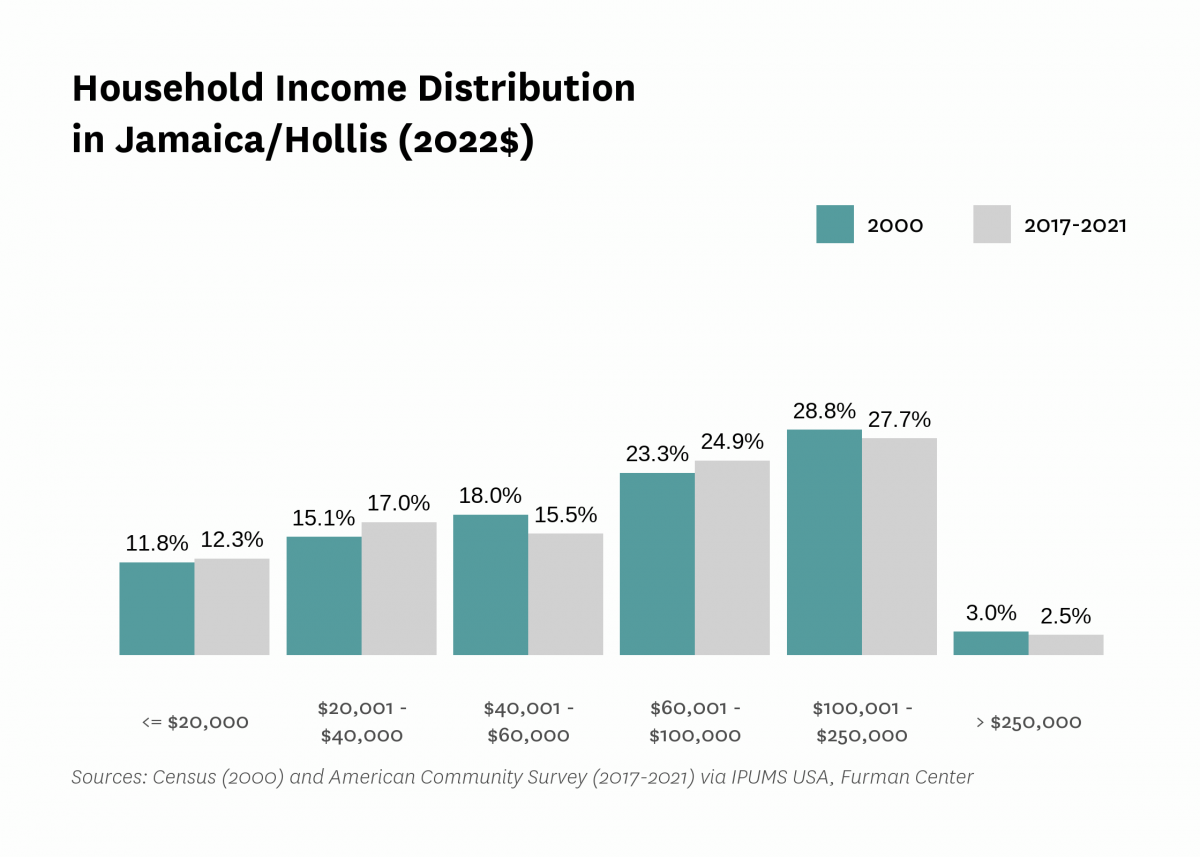
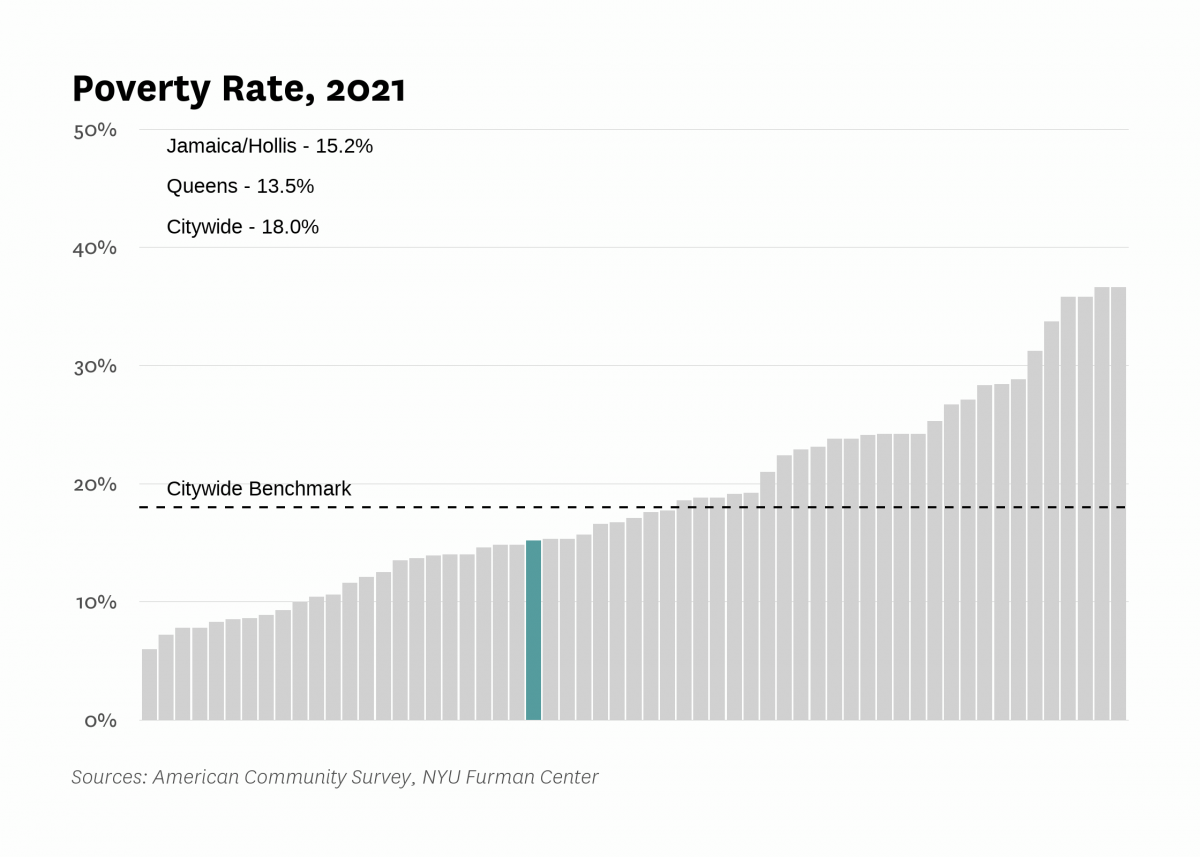
| Income and Poverty | ||||||
| Income diversity ratio | 3.8 | 4.4 | 4.5 | 5.0 | ||
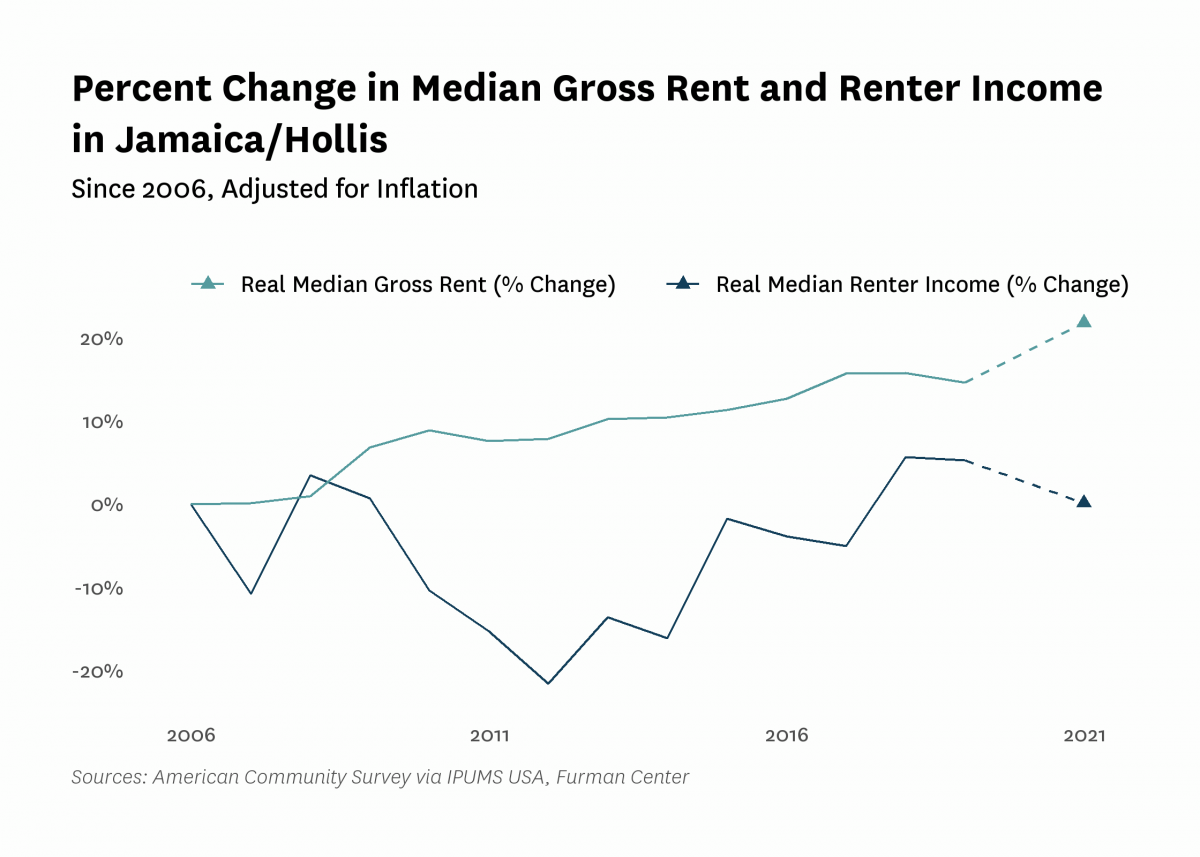
| Median household income (2022$) | $69,390 | $68,720 | $64,080 | $73,300 | $72,870 | |
| Median household income, homeowners (2022$) | $87,060 | $92,940 | $101,030 | $101,360 | ||
| Median household income, renters (2022$) | $51,090 | $45,810 | $53,780 | $51,170 | ||
| Poverty rate | 17.0% | 10.1% | 18.8% | 10.6% | 15.2% | |
| Poverty rate, population aged 65+ | 11.9% | 17.0% | 11.4% | 12.6% | ||
| Poverty rate, population under 18 years old | 13.0% | 28.2% | 13.2% | 17.9% | ||
| Labor Market | ||||||
| Labor force participation rate | 65.7% | 65.2% | 64.2% | 60.2% | ||
| Population aged 25+ without a high school diploma | 22.6% | 21.1% | 17.0% | 18.1% | ||
| Unemployment rate | 10.87% | 9.94% | 15.49% | 6.63% | 14.83% | |
| Indicator | 2000 | 2006 | 2010 | 2019 | 2021 | 2022 |
|---|---|---|---|---|---|---|
| Housing Stock | ||||||
| Homeownership rate | 50.6% | 55.7% | 46.3% | 50.5% | 51.8% | |
| Housing units | 72,466 | 76,142 | 80,826 | 82,291 | ||
| Rental vacancy rate | 4.2% | 2.6% | 2.7% | |||
| Serious housing code violations (per 1,000 privately owned rental units) | 52.0 | 67.0 | 54.1 | 64.7 | 87.1 | |
| Severe crowding rate (% of renter households) | 4.4% | 5.9% | 5.6% | |||
| Total housing code violations (per 1,000 privately owned rental units) | 245.5 | 272.0 | 200.9 | 262.6 | 312.4 | |
| Finance - Distress | ||||||
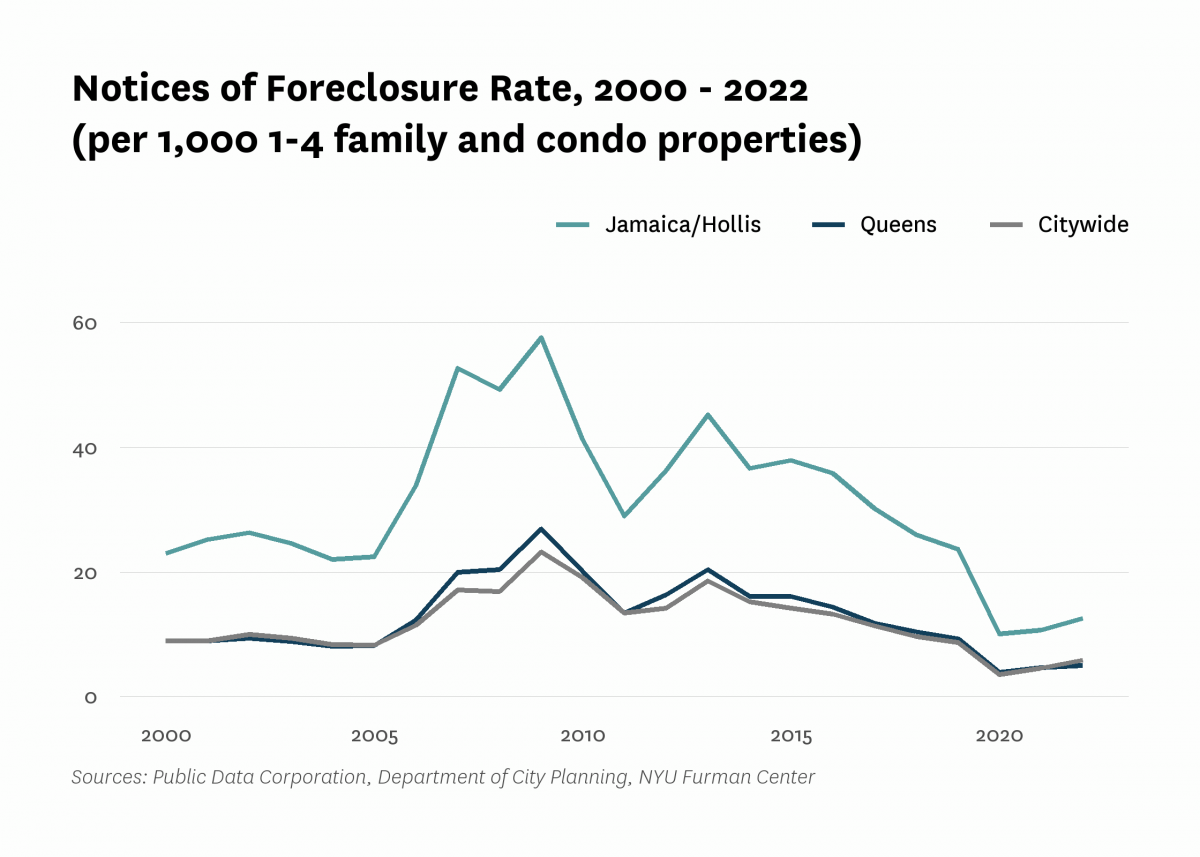
| Notices of foreclosure rate (per 1,000 1-4 family and condo properties) | 23.0 | 33.9 | 41.3 | 23.7 | 10.7 | 12.6 |
| Notices of foreclosure, all residential properties | 818 | 1,227 | 1,519 | 876 | 397 | 461 |
| Notices of foreclosure, initial, 1-4 family and condo properties | 618 | 993 | 1,096 | 380 | 114 | 186 |
| Notices of foreclosure, repeat, 1-4 family and condo properties | 173 | 215 | 396 | 477 | 274 | 271 |
| Pre-foreclosure notice rate (per 1,000 1-4 family and condo properties) | 121.7 | 48.3 | 107.4 | |||
| Pre-foreclosure notices, 1-4 family and condo properties | 4,410 | 1,755 | 3,903 | |||
| Properties entering REO, 1-4 family | 177 | 48 | 213 | |||
| Finance - Lending | ||||||
| FHA/VA-backed home purchase loans (% of home purchase loans) | 1.1% | 84.7% | 46.2% | 45.4% | ||
| Higher-cost home purchase loans (% of home purchase loans) | 59.8% | 3.0% | 19.5% | 9.2% | ||
| Higher-cost refinance loans (% of refinance loans) | 44.9% | 6.7% | 4.7% | 1.1% | ||
| Home purchase loan rate (per 1,000 properties) | 65.9 | 20.4 | 24.4 | 24.2 | ||
| Home purchase loans in LMI tracts (% of home purchase loans) | 25.9% | 16.1% | 14.2% | 14.7% | ||
| Home purchase loans to LMI borrowers (% of home purchase loans) | 2.0% | 25.0% | 10.8% | 11.4% | ||
| Refinance loan rate (per 1,000 properties) | 107.8 | 11.0 | 24.4 | 49.6 | ||
| Sales - Volume | ||||||
| Sales volume, 1 family building | 1,019 | 2,160 | 925 | 803 | 668 | 819 |
| Sales volume, 2-4 family building | 502 | 1,307 | 677 | 430 | 320 | 429 |
| Sales volume, 5+ family building | 3 | 16 | 10 | 11 | 6 | 3 |
| Sales volume, condominium | 1 | 5 | 17 | 7 | 7 | 7 |
| Sales volume, all property types | 1,525 | 3,488 | 1,629 | 1,251 | 1,001 | 1,258 |
| Sales - Median Prices | ||||||
| Median sales price per unit, 1 family building (2022$) | $305,890 | $563,280 | $361,500 | $558,120 | $636,620 | $620,000 |
| Median sales price per unit, 2-4 family building (2022$) | $184,980 | $390,270 | $231,770 | $370,720 | $422,820 | $385,000 |
| Median sales price per unit, 5+ family building (2022$) | $87,800 | $137,500 | $107,060 | $148,660 | $127,650 | $210,000 |
| Median sales price per unit, condominium (2022$) | $140,200 | $290,470 | $352,590 | $325,010 | $363,930 | $310,000 |
| Sales - Housing Price Index | ||||||
| Index of housing price appreciation, 1 family building | 100.0 | 222.3 | 142.8 | 255.6 | 312.1 | 313.7 |
| Index of housing price appreciation, 2-4 family building | 100.0 | 236.1 | 140.9 | 251.7 | 319.9 | 296.3 |
| Index of housing price appreciation, 5+ family building | 100.0 | 208.5 | 161.8 | 205.1 | 396.3 | |
| Index of housing price appreciation, condominium | 100.0 | 308.6 | 300.9 | 394.7 | 336.0 | 503.6 |
| Index of housing price appreciation, all property types | 100.0 | 226.6 | 141.8 | 251.9 | 314.1 | 307.2 |
| Subsidized Housing | ||||||
| Total number of subsidized properties (properties) | 98 | |||||
| HUD Financing or Insurance (properties) | 7 | |||||
| HUD Financing or Insurance (units) | 992 | |||||
| HUD Project-based Rental Assistance Program (properties) | 6 | |||||
| HUD Project-based Rental Assistance Program (units) | 768 | |||||
| Low Income Housing Tax Credit (properties) | 21 | |||||
| Low Income Housing Tax Credit (units) | 2,811 | |||||
| Public Housing (properties) | 12 | |||||
| Public Housing (units) | 2,529 | |||||
| Mitchell-Lama (properties) | 2 | |||||
| Mitchell-Lama (units) | 6,075 | |||||
| 421-a Tax Exemption (properties) | 38 | |||||
| 421-a Tax Exemption (units) | 1,449 | |||||
| 420-c Tax Exemption (properties) | 15 | |||||
| 420-c Tax Exemption (units) | 1,090 | |||||
| NYC Housing Production Programs and Zoning Incentives or Requirements (properties) | 29 | |||||
| Eligible to expire from housing programs between 2023 and 2028 (properties) | 3 | |||||
| Eligible to expire from housing programs between 2023 and 2028 (units) | 425 | |||||
| Eligible to expire from housing programs between 2029 and 2038 (properties) | 2 | |||||
| Eligible to expire from housing programs between 2029 and 2038 (units) | 6,127 | |||||
| Eligible to expire from housing programs in 2039 and later (properties) | 21 | |||||
| Eligible to expire from housing programs in 2039 and later (units) | 2,839 | |||||
| Indicator | 2000 | 2006 | 2010 | 2019 | 2021 | 2022 |
|---|---|---|---|---|---|---|
| Density | ||||||
| Population density (1,000 persons per square mile) | 23.2 | 23.9 | 25.9 | 29.1 | ||
| Development | ||||||
| Units authorized by new residential building permits | 218 | 0 | 47 | 603 | 1,240 | 2,697 |
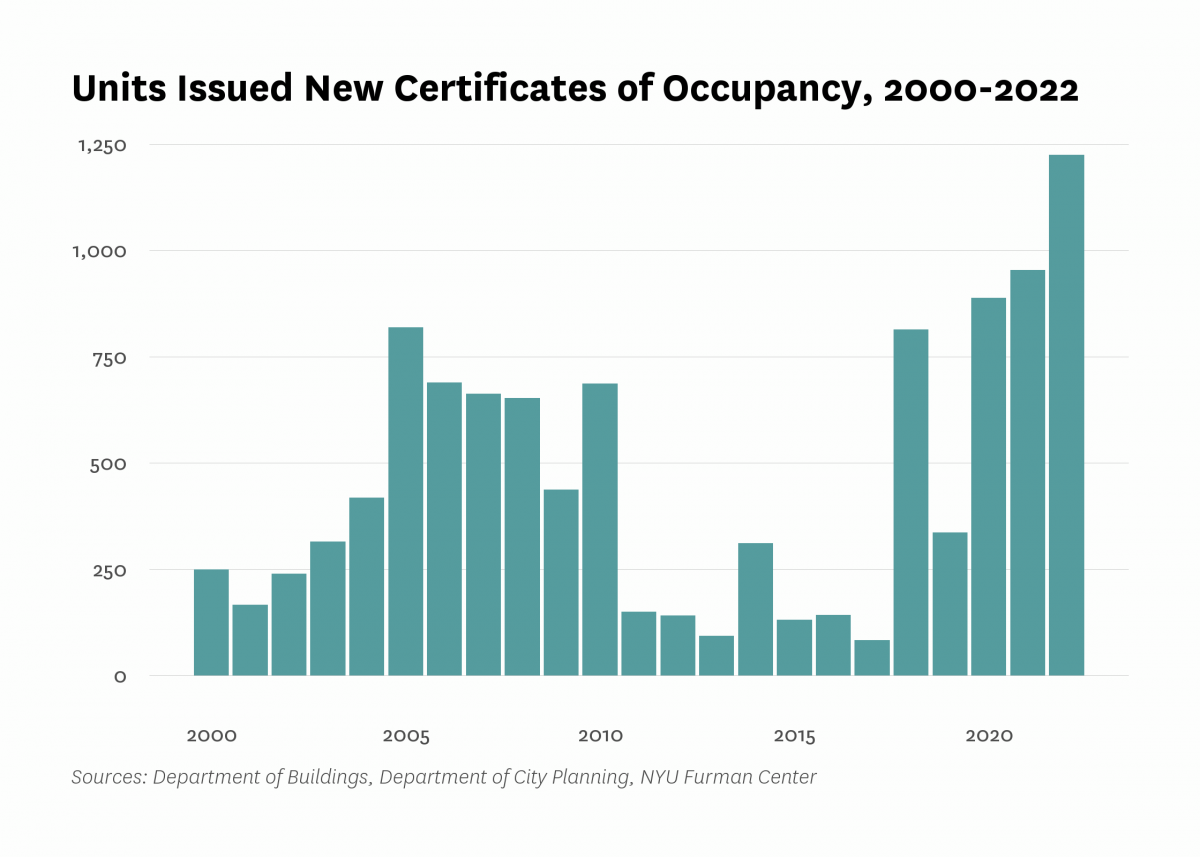
| Units issued new certificates of occupancy | 250 | 689 | 687 | 337 | 954 | 1,224 |
| Indicator | 2000 | 2006 | 2010 | 2019 | 2021 | 2022 |
|---|---|---|---|---|---|---|
| Commute | ||||||
| Car-free commute (% of commuters) | 53.2% | 55.9% | 54.7% | 53.2% | 48.6% | |
| Mean travel time to work (minutes) | 49.3 | 48.8 | 47.5 | 48.4 | 45.9 | |
| Crime and Incarceration | ||||||
| Serious crime rate (per 1,000 residents) | 17.2 | 16.6 | 12.4 | 11.6 | 13.2 | |
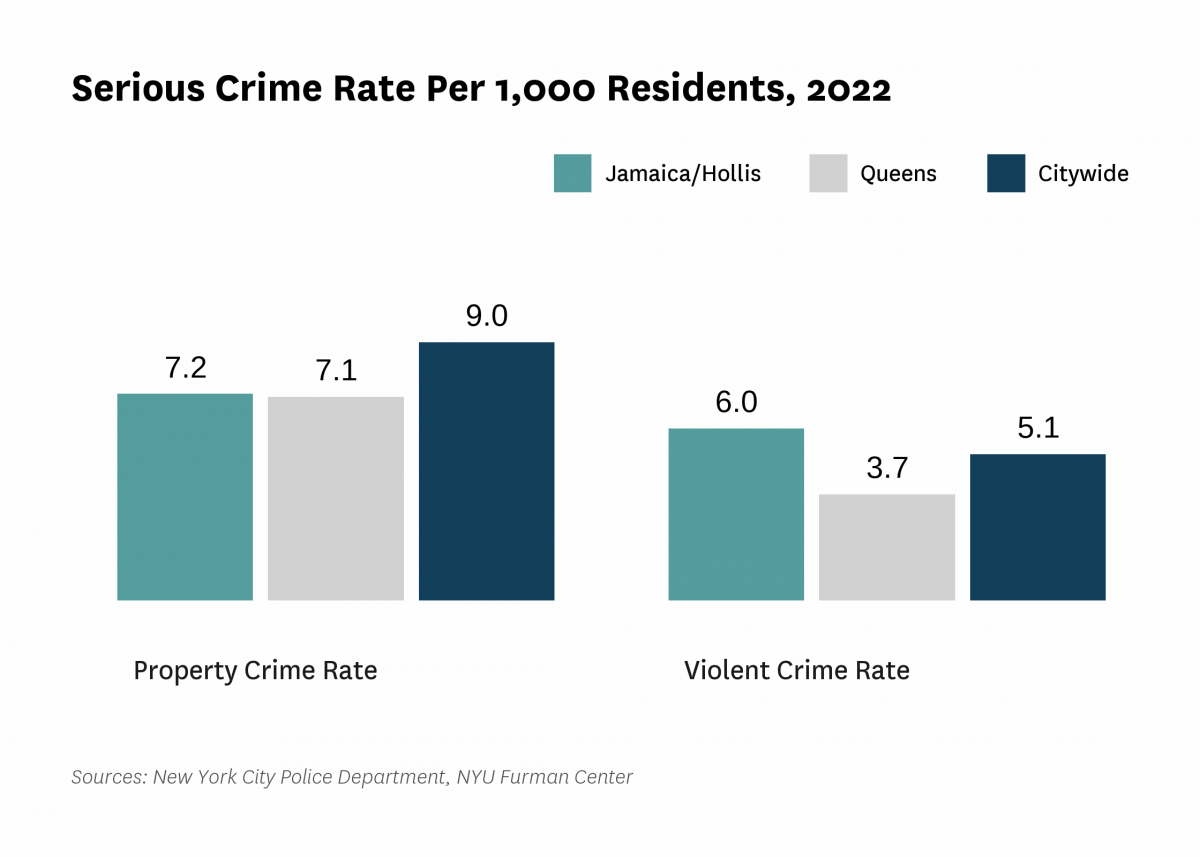
| Serious crime rate, property (per 1,000 residents) | 11.1 | 9.6 | 6.5 | 6.0 | 7.2 | |
| Serious crime rate, violent (per 1,000 residents) | 6.1 | 7.0 | 5.9 | 5.6 | 6.0 | |
| Schools | ||||||
| Students performing at grade level in English language arts, 4th grade | 44.4% | 35.5% | ||||
| Students performing at grade level in math, 4th grade | 37.2% | 30.1% | ||||
| Indicator | 2000 | 2006 | 2010 | 2019 | 2021 | 2022 |
|---|---|---|---|---|---|---|
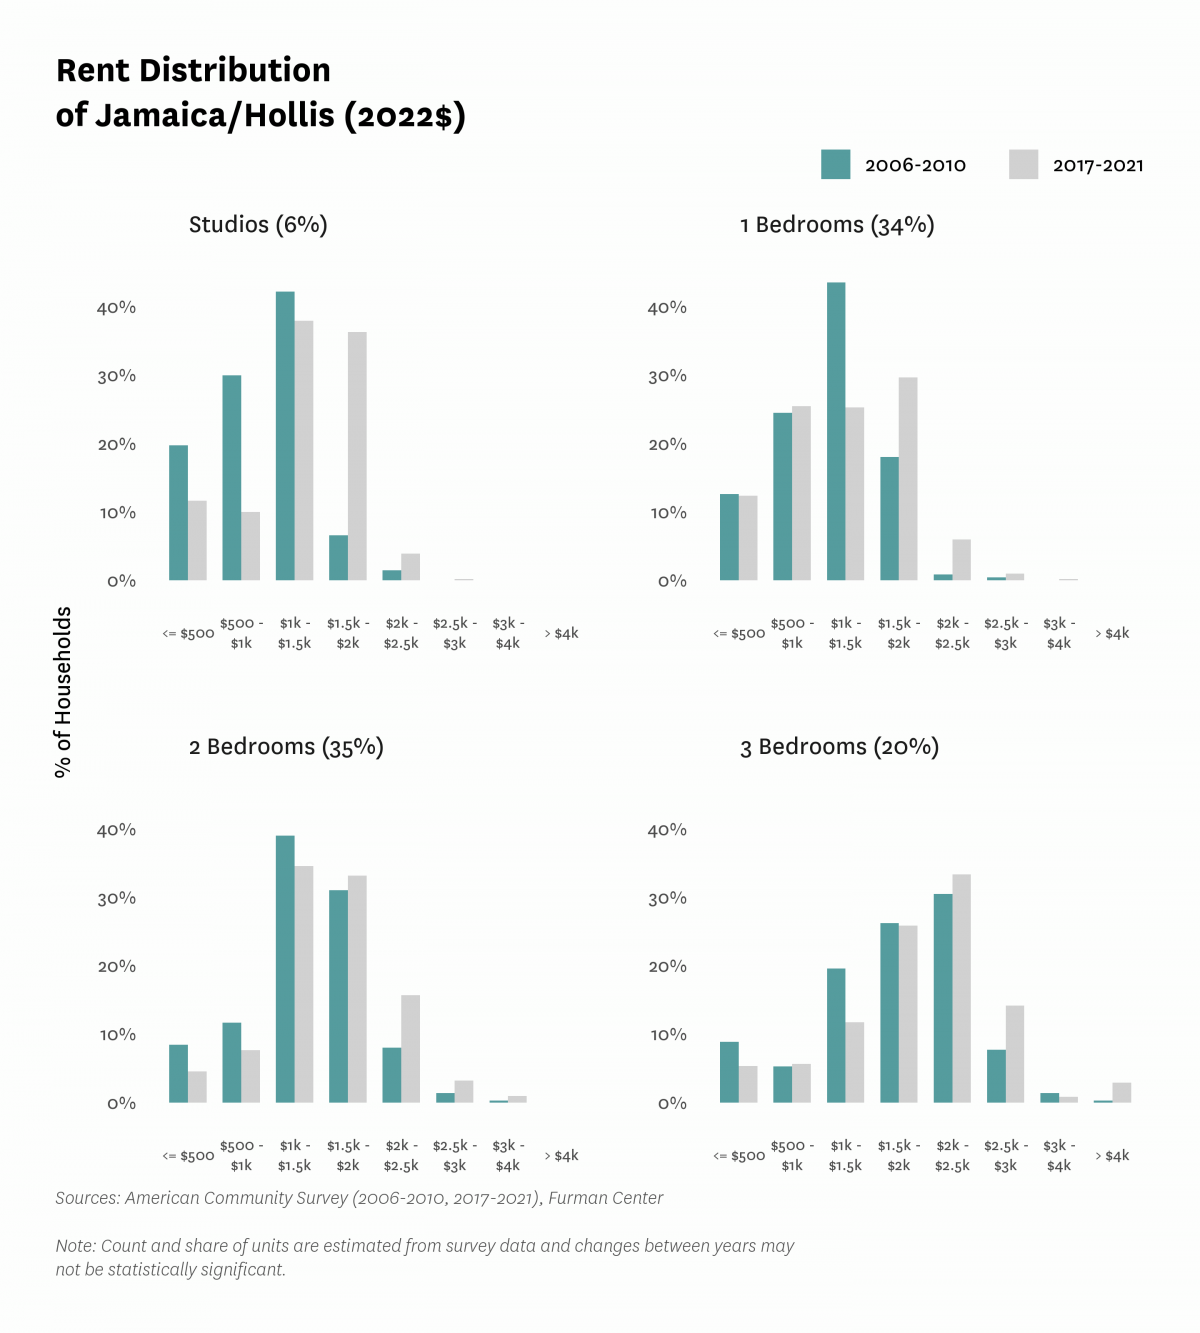
| Median Rent | ||||||
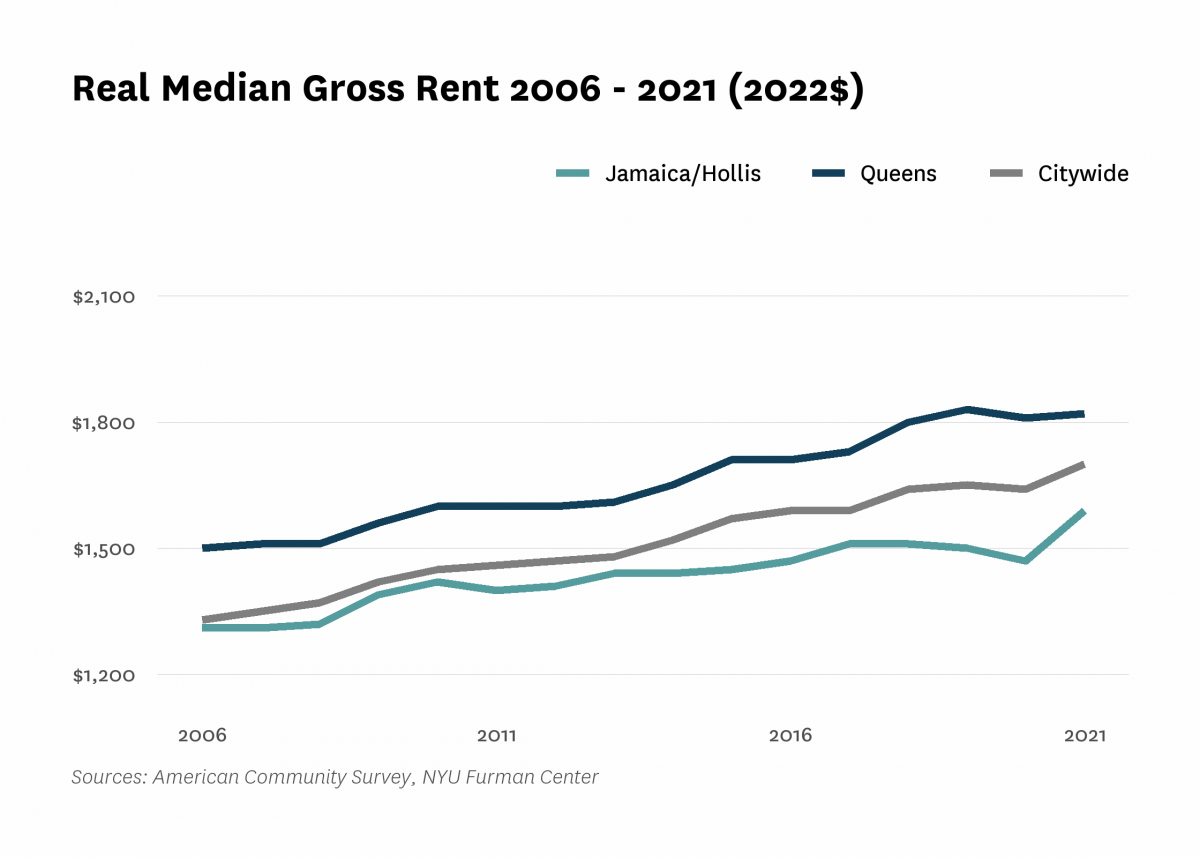
| Median rent, 2- and 3-bedrooms (2022$) | $1,520 | $1,590 | $1,760 | |||
| Median rent, all (2022$) | $1,190 | $1,310 | $1,420 | $1,500 | $1,590 | |
| Median rent, recent movers (2022$) | $1,560 | $1,630 | $1,860 | |||
| Median rent, studios and 1-bedrooms (2022$) | $1,100 | $1,230 | $1,260 | |||
| Change in collected rent (2019-2020) | 3.1% | |||||
| Affordability | ||||||
| Rental units affordable at 30% AMI (% of recently available units) | 6.8% | 7.5% | 9.5% | |||
| Rental units affordable at 80% AMI (% of recently available units) | 66.7% | 79.8% | 75.6% | |||
| Rental units affordable at 120% AMI (% of recently available units) | 98.7% | 99.4% | 100.0% | |||
| Rent Burden | ||||||
| Moderately rent-burdened households | 26.8% | 22.4% | 25.9% | 26.9% | ||
| Moderately rent-burdened households, low income | 31.5% | 32.0% | 31.3% | |||
| Moderately rent-burdened households, moderate income | 11.2% | 6.5% | 12.2% | |||
| Severely rent-burdened households | 23.1% | 30.9% | 28.6% | 30.6% | ||
| Severely rent-burdened households, low income | 43.7% | 40.0% | 42.3% | |||
| Severely rent-burdened households, moderate income | 1.2% | 0.0% | 0.6% | |||
| Rental Subsidy | ||||||
| Housing choice vouchers (% of occupied, privately owned rental units) | 6.0% | 3.4% | ||||
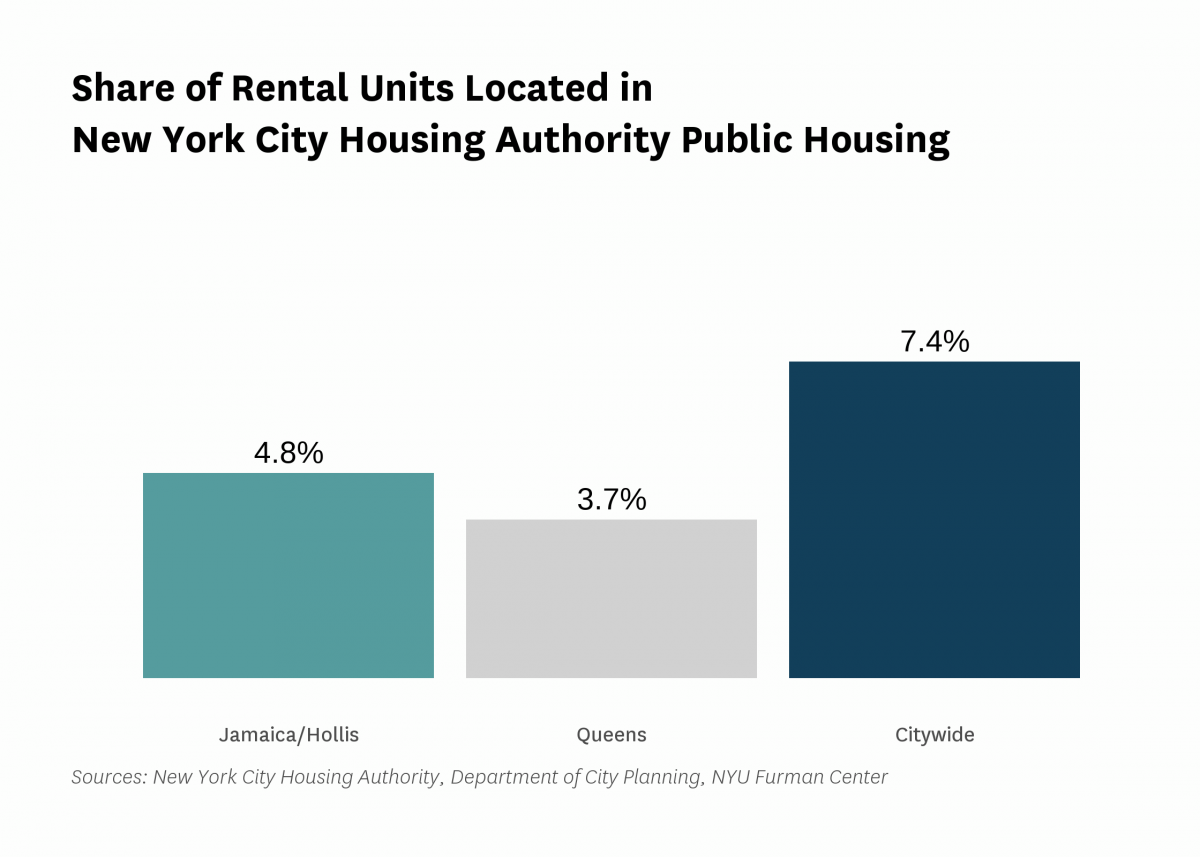
| Public housing (% of rental units) | 4.8% | |||||
Data Notes: See CoreData User Guide for more information about indicator definitions and methods.
Indicators: The rental vacancy rate, severe crowding rate, and the severely rent-burdened households indicators use five-year American Community Survey (ACS) estimates. Data under the 2010 heading comes from the 2006 – 2010 ACS, data under the 2019 heading comes from the 2015 – 2019 ACS and data under the 2021 heading comes from 2017 – 2021 ACS .
All content © 2005 – 2024 Furman Center for Real Estate and Urban Policy | Top of page | Contact Us