| Indicator | 2000 | 2006 | 2010 | 2019 | 2021 | 2022 |
|---|---|---|---|---|---|---|
| Population | ||||||
| Born in New York State | 66.4% | 63.4% | 58.9% | 61.3% | ||
| Disabled population | 9.0% | 15.9% | 11.2% | |||
| Foreign-born population | 24.4% | 24.3% | 25.7% | 32.7% | 28.0% | |
| Population | 106,738 | 120,268 | 124,031 | 121,740 | 134,700 | |
| Population aged 65+ | 14.2% | 13.9% | 13.6% | 17.9% | 17.8% | |
| Households | ||||||
| Households with children under 18 years old | 40.1% | 41.9% | 38.8% | 33.0% | 31.8% | |
| Single-person households | 28.5% | 30.4% | 31.8% | 34.5% | ||
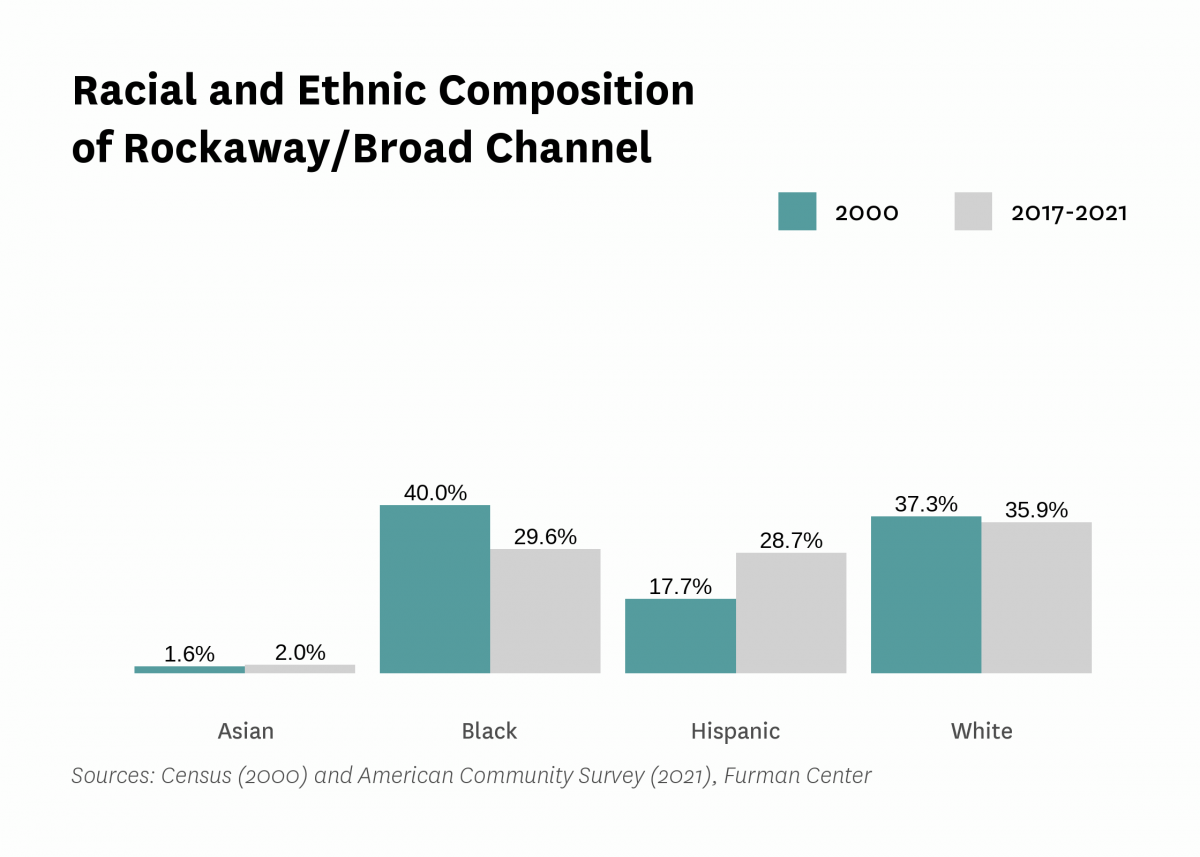
| Race and Ethnicity | ||||||
| Percent Asian | 1.6% | 1.5% | 1.0% | 2.7% | 2.0% | |
| Percent Black | 40.0% | 37.9% | 37.9% | 37.4% | 29.6% | |
| Percent Hispanic | 17.7% | 17.8% | 23.5% | 26.0% | 28.7% | |
| Percent white | 37.3% | 39.6% | 35.8% | 32.3% | 35.9% | |
| Racial diversity index | 0.67 | 0.67 | 0.67 | 0.69 | 0.70 | |
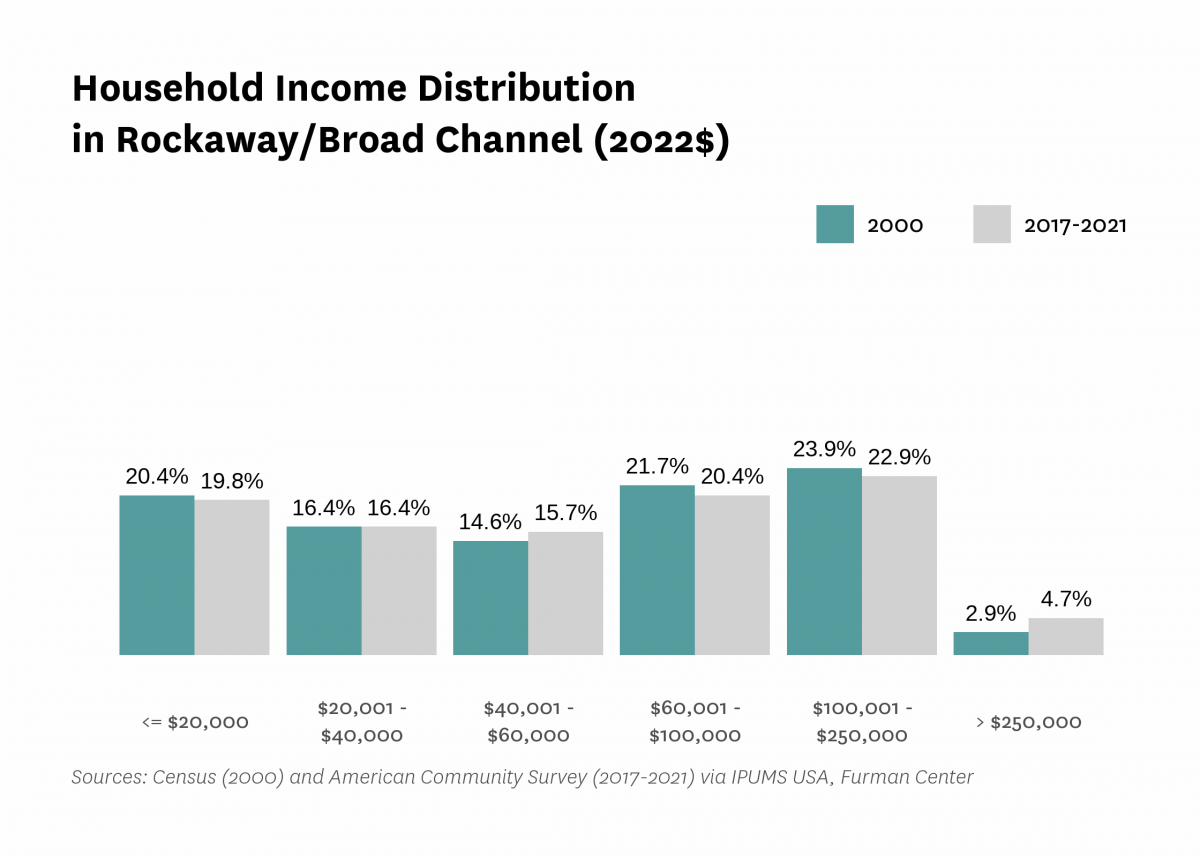
| Income and Poverty | ||||||
| Income diversity ratio | 6.0 | 6.7 | 5.9 | 7.8 | ||
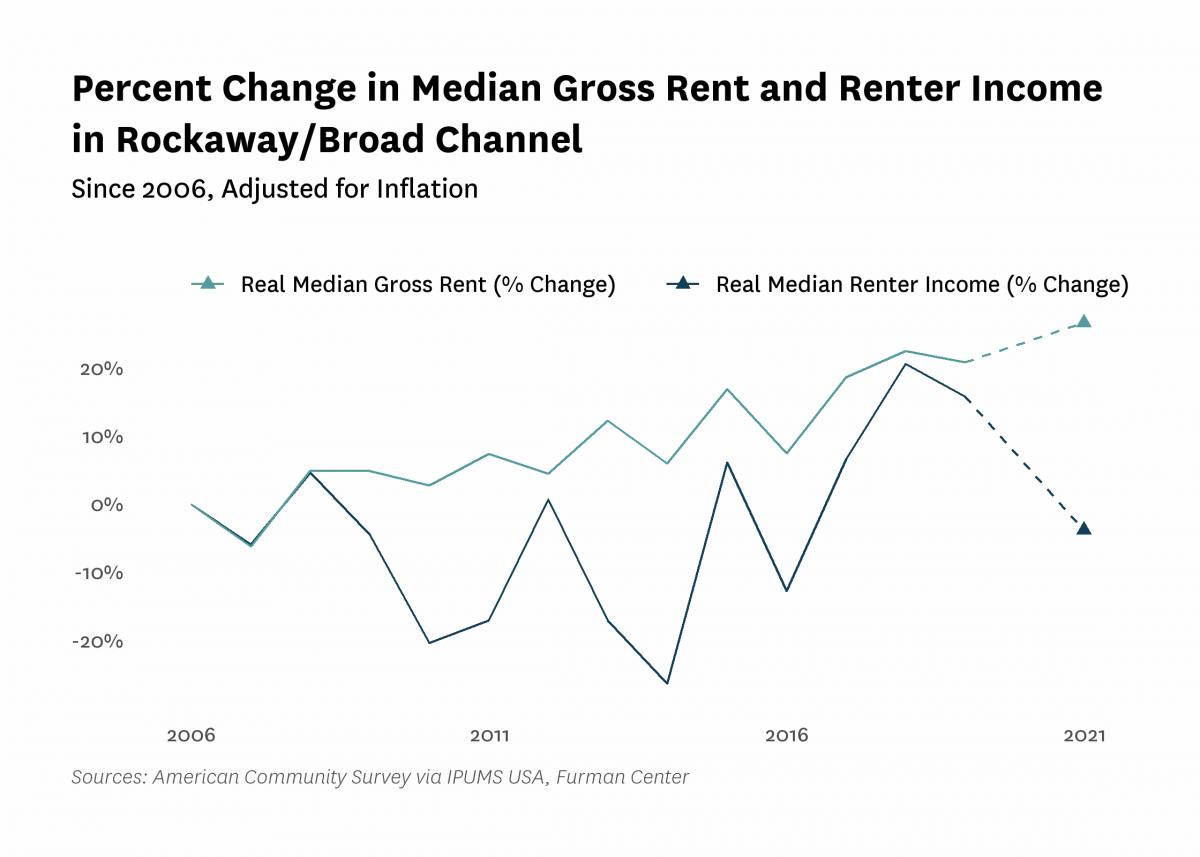
| Median household income (2022$) | $61,150 | $61,230 | $61,710 | $61,360 | $54,790 | |
| Median household income, homeowners (2022$) | $112,550 | $117,080 | $100,960 | $108,090 | ||
| Median household income, renters (2022$) | $42,530 | $33,870 | $49,260 | $40,910 | ||
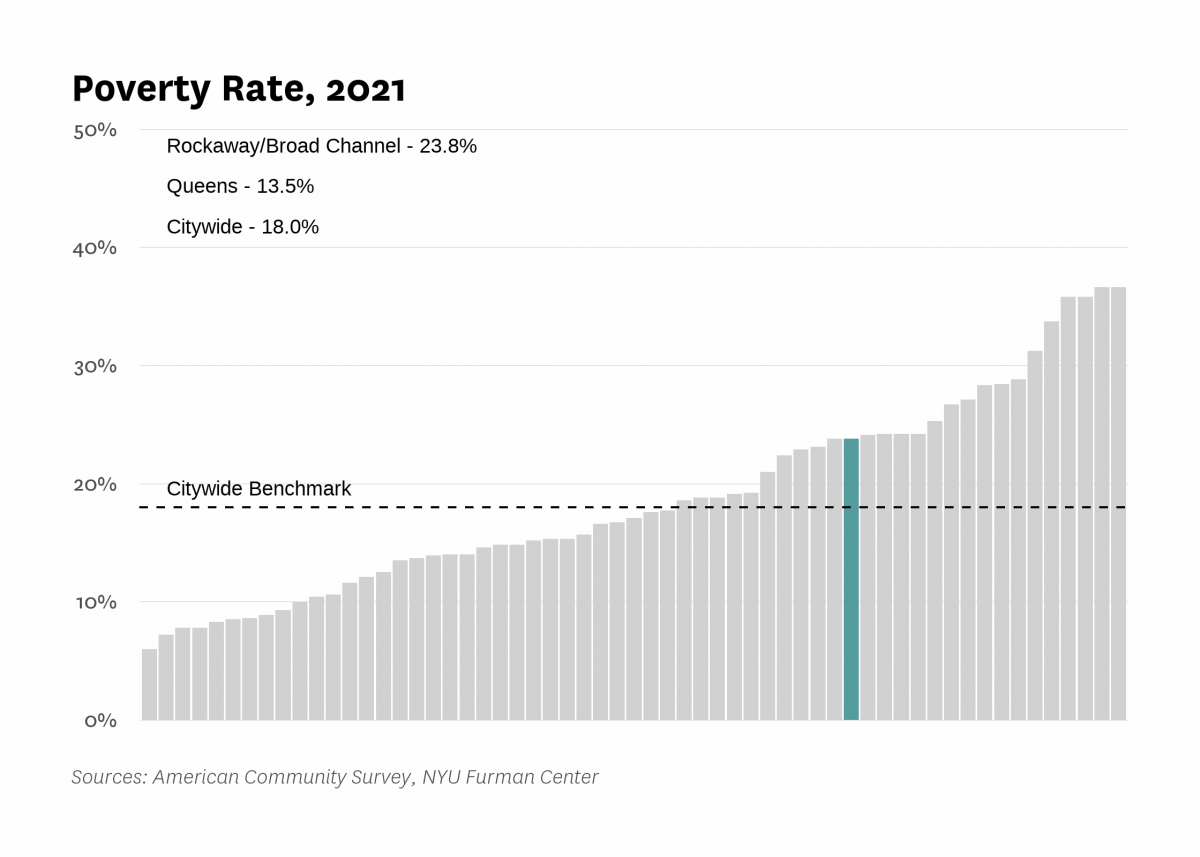
| Poverty rate | 22.4% | 20.3% | 22.4% | 18.1% | 23.8% | |
| Poverty rate, population aged 65+ | 15.1% | 24.7% | 20.0% | 28.9% | ||
| Poverty rate, population under 18 years old | 26.4% | 33.4% | 23.2% | 27.1% | ||
| Labor Market | ||||||
| Labor force participation rate | 55.8% | 56.8% | 57.3% | 54.6% | ||
| Population aged 25+ without a high school diploma | 25.5% | 21.9% | 20.6% | 17.1% | ||
| Unemployment rate | 12.78% | 9.06% | 14.24% | 6.27% | 14.21% | |
| Indicator | 2000 | 2006 | 2010 | 2019 | 2021 | 2022 |
|---|---|---|---|---|---|---|
| Housing Stock | ||||||
| Homeownership rate | 35.1% | 41.1% | 37.8% | 36.6% | 35.4% | |
| Housing units | 44,338 | 47,462 | 44,696 | 49,734 | ||
| Rental vacancy rate | 5.1% | 3.2% | 2.7% | |||
| Serious housing code violations (per 1,000 privately owned rental units) | 34.3 | 39.6 | 65.7 | 85.0 | 127.8 | |
| Severe crowding rate (% of renter households) | 3.4% | 3.9% | 4.4% | |||
| Total housing code violations (per 1,000 privately owned rental units) | 190.9 | 182.1 | 262.6 | 339.8 | 439.8 | |
| Finance - Distress | ||||||
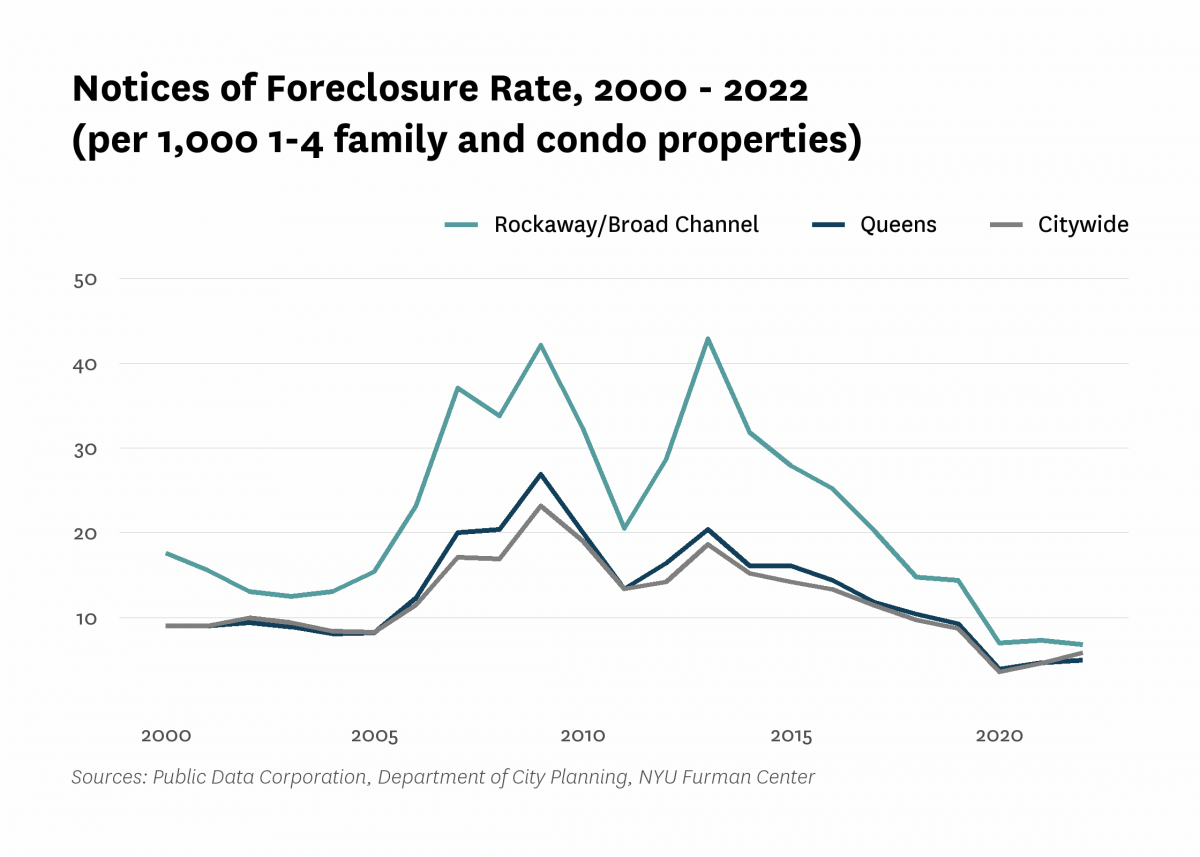
| Notices of foreclosure rate (per 1,000 1-4 family and condo properties) | 17.6 | 23.2 | 32.4 | 14.4 | 7.3 | 6.8 |
| Notices of foreclosure, all residential properties | 182 | 287 | 427 | 196 | 99 | 92 |
| Notices of foreclosure, initial, 1-4 family and condo properties | 149 | 223 | 296 | 74 | 23 | 37 |
| Notices of foreclosure, repeat, 1-4 family and condo properties | 28 | 57 | 124 | 117 | 75 | 54 |
| Pre-foreclosure notice rate (per 1,000 1-4 family and condo properties) | 75.0 | 31.3 | 66.3 | |||
| Pre-foreclosure notices, 1-4 family and condo properties | 996 | 418 | 887 | |||
| Properties entering REO, 1-4 family | 58 | 19 | 45 | |||
| Finance - Lending | ||||||
| FHA/VA-backed home purchase loans (% of home purchase loans) | 1.4% | 41.3% | 24.3% | 24.8% | ||
| Higher-cost home purchase loans (% of home purchase loans) | 30.0% | 1.2% | 8.9% | 2.8% | ||
| Higher-cost refinance loans (% of refinance loans) | 38.4% | 2.5% | 2.4% | 0.5% | ||
| Home purchase loan rate (per 1,000 properties) | 53.9 | 16.6 | 16.2 | 22.6 | ||
| Home purchase loans in LMI tracts (% of home purchase loans) | 58.8% | 9.3% | 32.3% | 30.5% | ||
| Home purchase loans to LMI borrowers (% of home purchase loans) | 3.5% | 31.9% | 9.6% | 7.1% | ||
| Refinance loan rate (per 1,000 properties) | 49.7 | 13.5 | 18.3 | 38.9 | ||
| Sales - Volume | ||||||
| Sales volume, 1 family building | 247 | 328 | 120 | 134 | 155 | 173 |
| Sales volume, 2-4 family building | 280 | 667 | 213 | 157 | 175 | 228 |
| Sales volume, 5+ family building | 12 | 15 | 6 | 16 | 9 | 14 |
| Sales volume, condominium | 12 | 45 | 105 | 43 | 88 | 54 |
| Sales volume, all property types | 551 | 1,055 | 444 | 350 | 427 | 469 |
| Sales - Median Prices | ||||||
| Median sales price per unit, 1 family building (2022$) | $288,900 | $527,320 | $536,790 | $602,080 | $605,850 | $699,000 |
| Median sales price per unit, 2-4 family building (2022$) | $182,690 | $344,290 | $193,140 | $334,920 | $360,220 | $357,500 |
| Median sales price per unit, 5+ family building (2022$) | $74,210 | $127,750 | $36,270 | $109,080 | $59,110 | $108,860 |
| Median sales price per unit, condominium (2022$) | $231,970 | $449,680 | $488,310 | $390,240 | $508,760 | $550,000 |
| Sales - Housing Price Index | ||||||
| Index of housing price appreciation, 1 family building | 100.0 | 219.6 | 169.5 | 261.3 | 271.5 | 302.6 |
| Index of housing price appreciation, 2-4 family building | 100.0 | 235.5 | 139.4 | 249.3 | 304.7 | 291.5 |
| Index of housing price appreciation, 5+ family building | 100.0 | 189.9 | 127.4 | 353.7 | 352.5 | 583.6 |
| Index of housing price appreciation, condominium | 100.0 | 204.3 | 181.8 | 215.7 | 255.0 | 256.0 |
| Index of housing price appreciation, all property types | 100.0 | 230.7 | 155.2 | 250.6 | 284.7 | 296.9 |
| Subsidized Housing | ||||||
| Total number of subsidized properties (properties) | 126 | |||||
| HUD Financing or Insurance (properties) | 15 | |||||
| HUD Financing or Insurance (units) | 4,486 | |||||
| HUD Project-based Rental Assistance Program (properties) | 19 | |||||
| HUD Project-based Rental Assistance Program (units) | 3,902 | |||||
| Low Income Housing Tax Credit (properties) | 20 | |||||
| Low Income Housing Tax Credit (units) | 4,012 | |||||
| Public Housing (properties) | 6 | |||||
| Public Housing (units) | 2,620 | |||||
| Mitchell-Lama (properties) | 7 | |||||
| Mitchell-Lama (units) | 3,944 | |||||
| 421-a Tax Exemption (properties) | 30 | |||||
| 421-a Tax Exemption (units) | 1,102 | |||||
| 420-c Tax Exemption (properties) | 14 | |||||
| 420-c Tax Exemption (units) | 2,495 | |||||
| NYC Housing Production Programs and Zoning Incentives or Requirements (properties) | 39 | |||||
| Eligible to expire from housing programs between 2023 and 2028 (properties) | 0 | |||||
| Eligible to expire from housing programs between 2023 and 2028 (units) | 0 | |||||
| Eligible to expire from housing programs between 2029 and 2038 (properties) | 5 | |||||
| Eligible to expire from housing programs between 2029 and 2038 (units) | 1,061 | |||||
| Eligible to expire from housing programs in 2039 and later (properties) | 27 | |||||
| Eligible to expire from housing programs in 2039 and later (units) | 5,584 | |||||
| Indicator | 2000 | 2006 | 2010 | 2019 | 2021 | 2022 |
|---|---|---|---|---|---|---|
| Density | ||||||
| Population density (1,000 persons per square mile) | 10.7 | 11.0 | 10.8 | 11.9 | ||
| Development | ||||||
| Units authorized by new residential building permits | 1,070 | 0 | 332 | 696 | 726 | 526 |
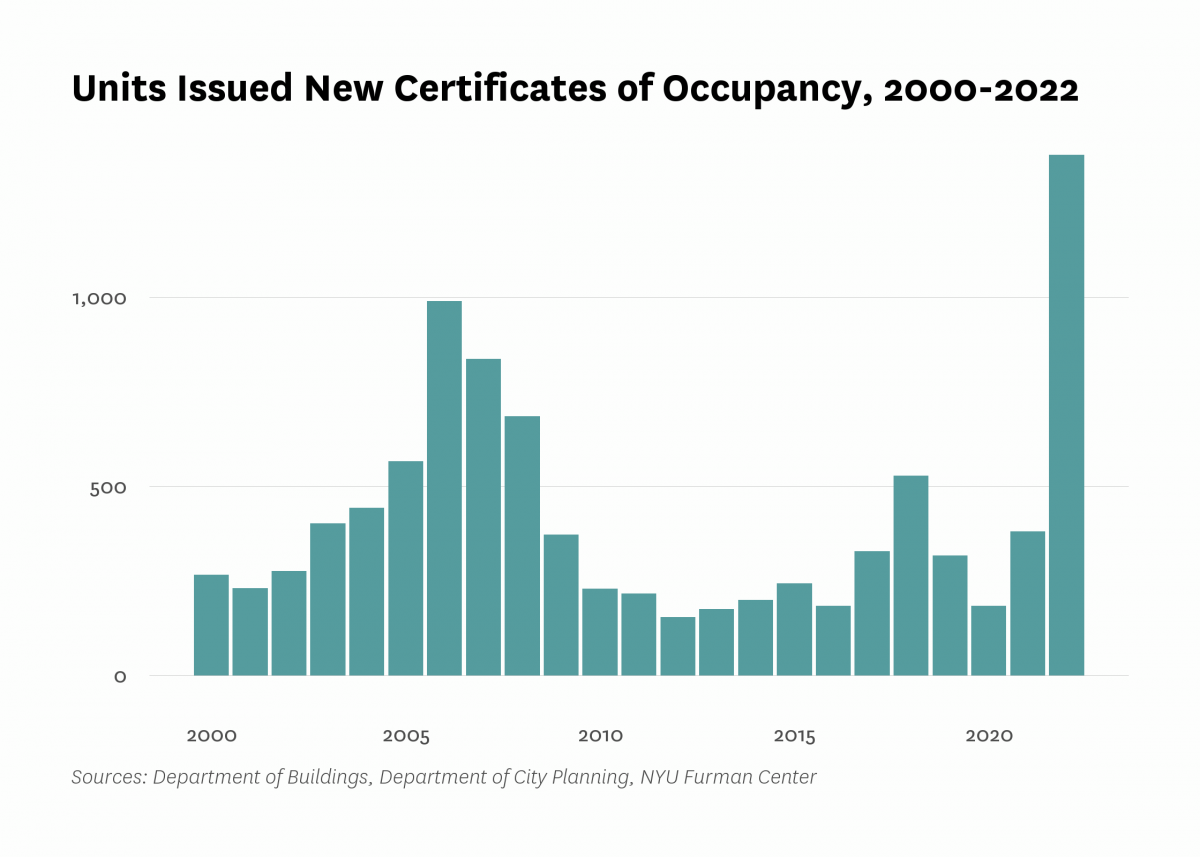
| Units issued new certificates of occupancy | 266 | 990 | 229 | 318 | 381 | 1,376 |
| Indicator | 2000 | 2006 | 2010 | 2019 | 2021 | 2022 |
|---|---|---|---|---|---|---|
| Commute | ||||||
| Car-free commute (% of commuters) | 44.2% | 49.8% | 49.5% | 40.4% | 39.2% | |
| Mean travel time to work (minutes) | 45.6 | 41.7 | 44.7 | 49.2 | 43.1 | |
| Crime and Incarceration | ||||||
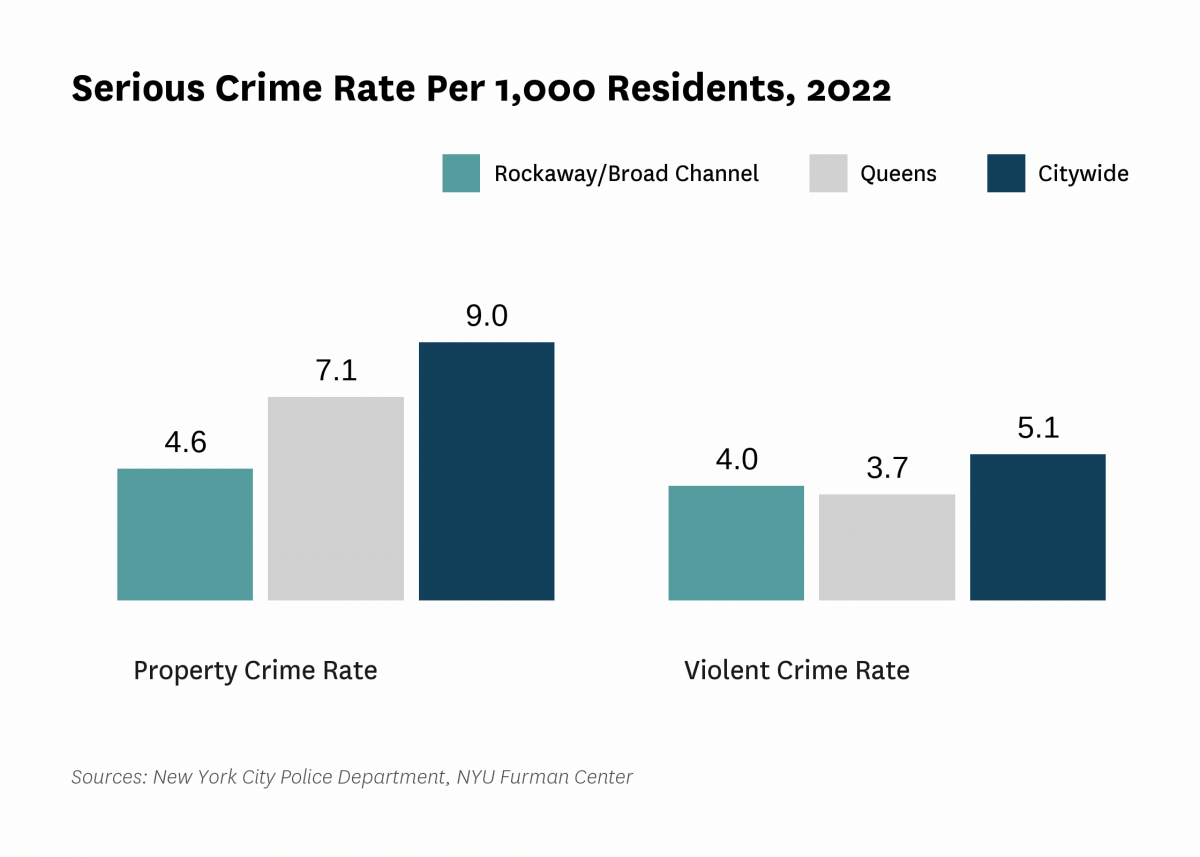
| Serious crime rate (per 1,000 residents) | 8.4 | 8.4 | 11.0 | 8.4 | 8.5 | |
| Serious crime rate, property (per 1,000 residents) | 4.4 | 4.5 | 5.2 | 4.0 | 4.6 | |
| Serious crime rate, violent (per 1,000 residents) | 4.1 | 3.9 | 5.8 | 4.3 | 4.0 | |
| Schools | ||||||
| Students performing at grade level in English language arts, 4th grade | 37.3% | 26.9% | ||||
| Students performing at grade level in math, 4th grade | 37.7% | 27.7% | ||||
| Indicator | 2000 | 2006 | 2010 | 2019 | 2021 | 2022 |
|---|---|---|---|---|---|---|
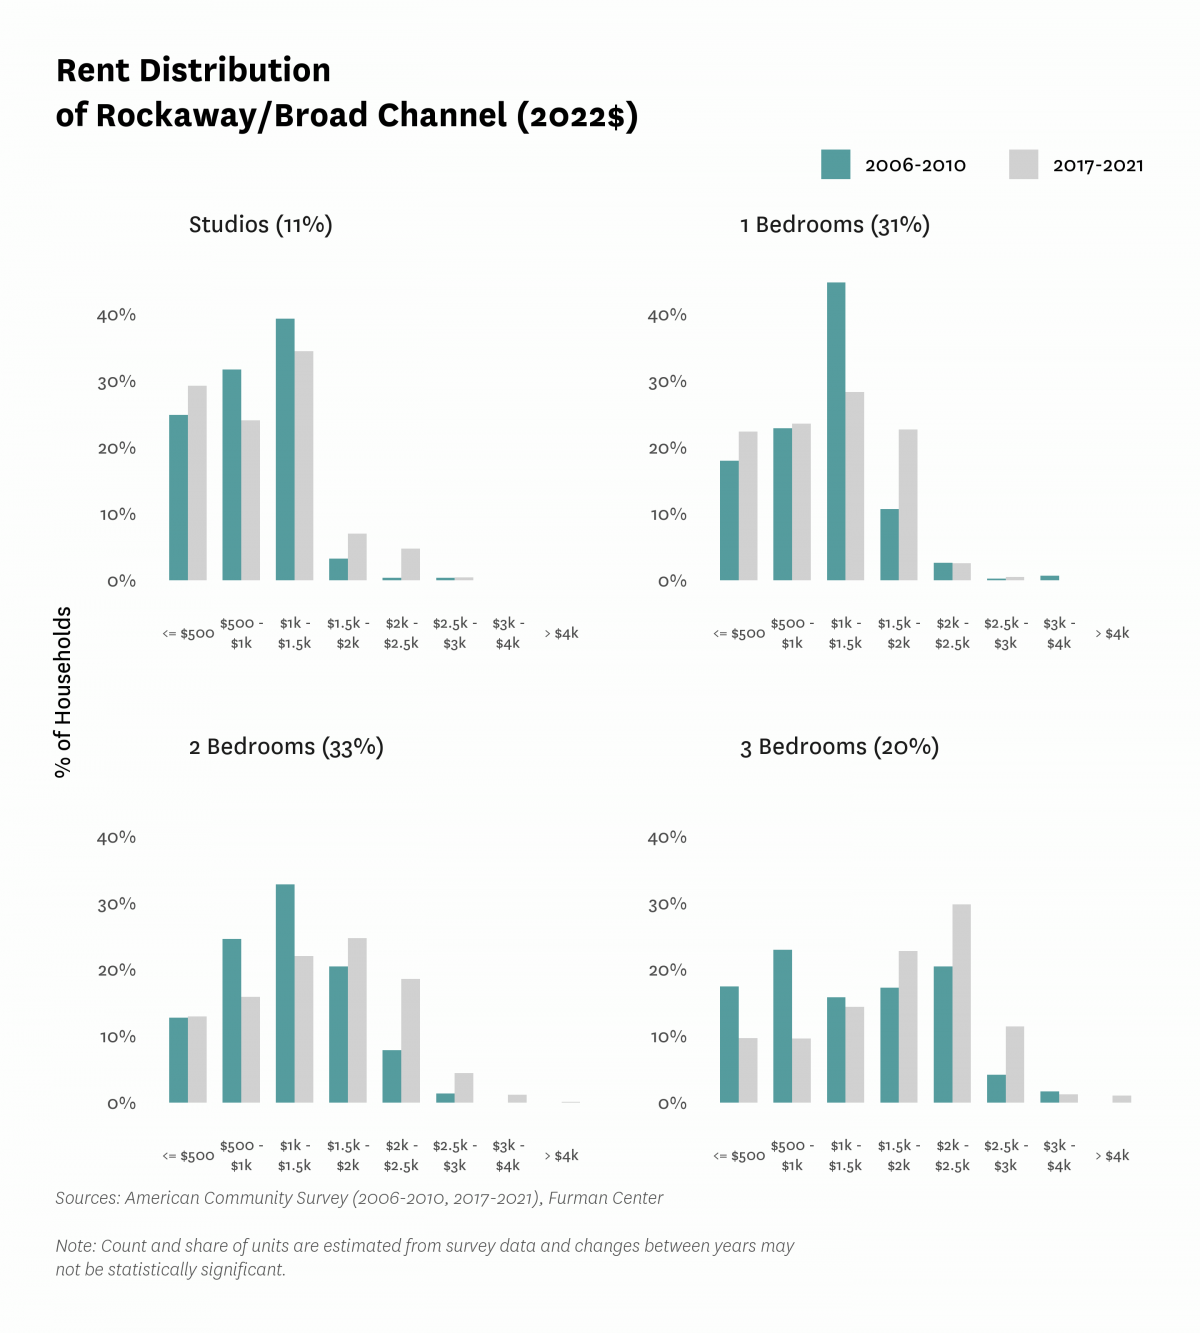
| Median Rent | ||||||
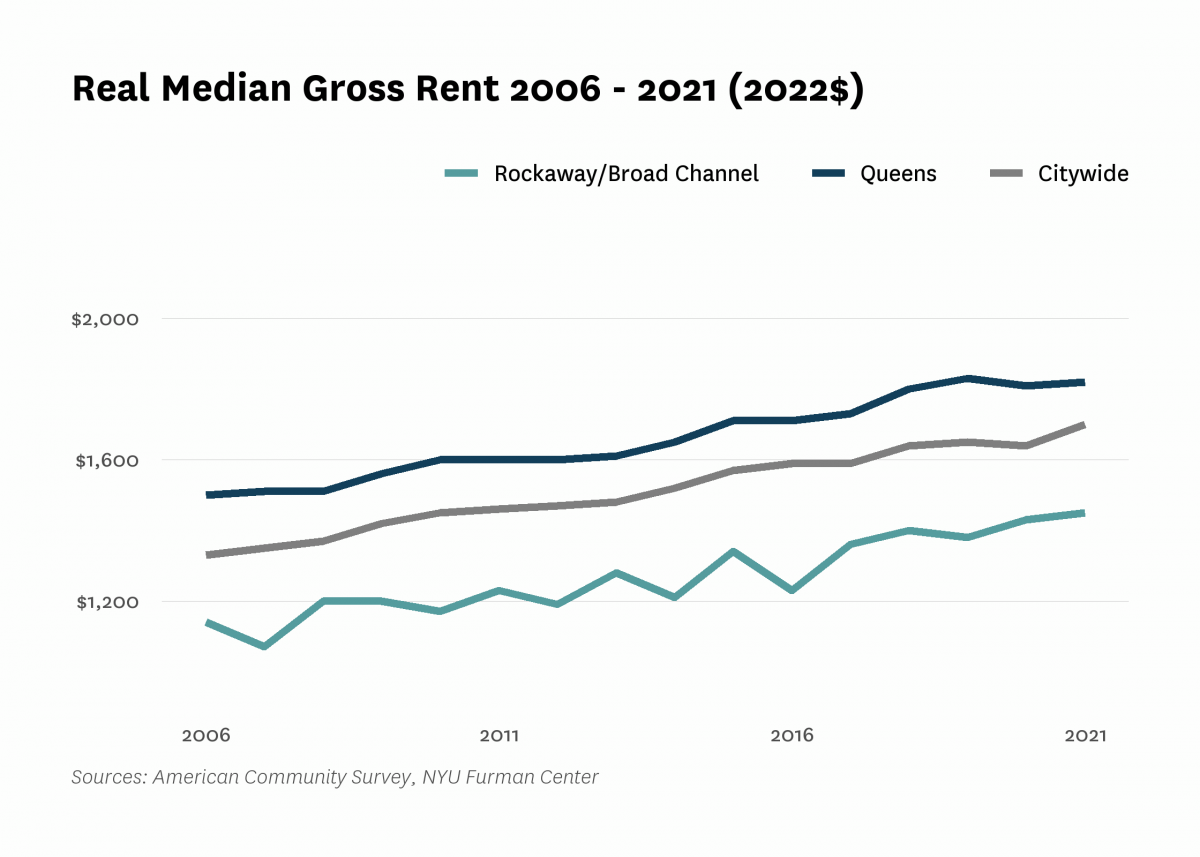
| Median rent, 2- and 3-bedrooms (2022$) | $1,250 | $1,450 | $1,670 | |||
| Median rent, all (2022$) | $980 | $1,140 | $1,170 | $1,380 | $1,450 | |
| Median rent, recent movers (2022$) | $1,360 | $1,780 | $1,880 | |||
| Median rent, studios and 1-bedrooms (2022$) | $1,060 | $1,100 | $1,110 | |||
| Change in collected rent (2019-2020) | 1.5% | |||||
| Affordability | ||||||
| Rental units affordable at 30% AMI (% of recently available units) | 12.4% | |||||
| Rental units affordable at 80% AMI (% of recently available units) | 77.1% | |||||
| Rental units affordable at 120% AMI (% of recently available units) | 100.0% | |||||
| Rent Burden | ||||||
| Moderately rent-burdened households | 21.9% | 19.0% | 27.1% | 30.8% | ||
| Moderately rent-burdened households, low income | 25.1% | 32.8% | 33.9% | |||
| Moderately rent-burdened households, moderate income | 11.0% | 11.8% | 10.4% | |||
| Severely rent-burdened households | 24.9% | 29.8% | 25.6% | 26.3% | ||
| Severely rent-burdened households, low income | 42.5% | 34.3% | 34.4% | |||
| Severely rent-burdened households, moderate income | 0.0% | 0.0% | 0.0% | |||
| Rental Subsidy | ||||||
| Housing choice vouchers (% of occupied, privately owned rental units) | 17.8% | 20.1% | ||||
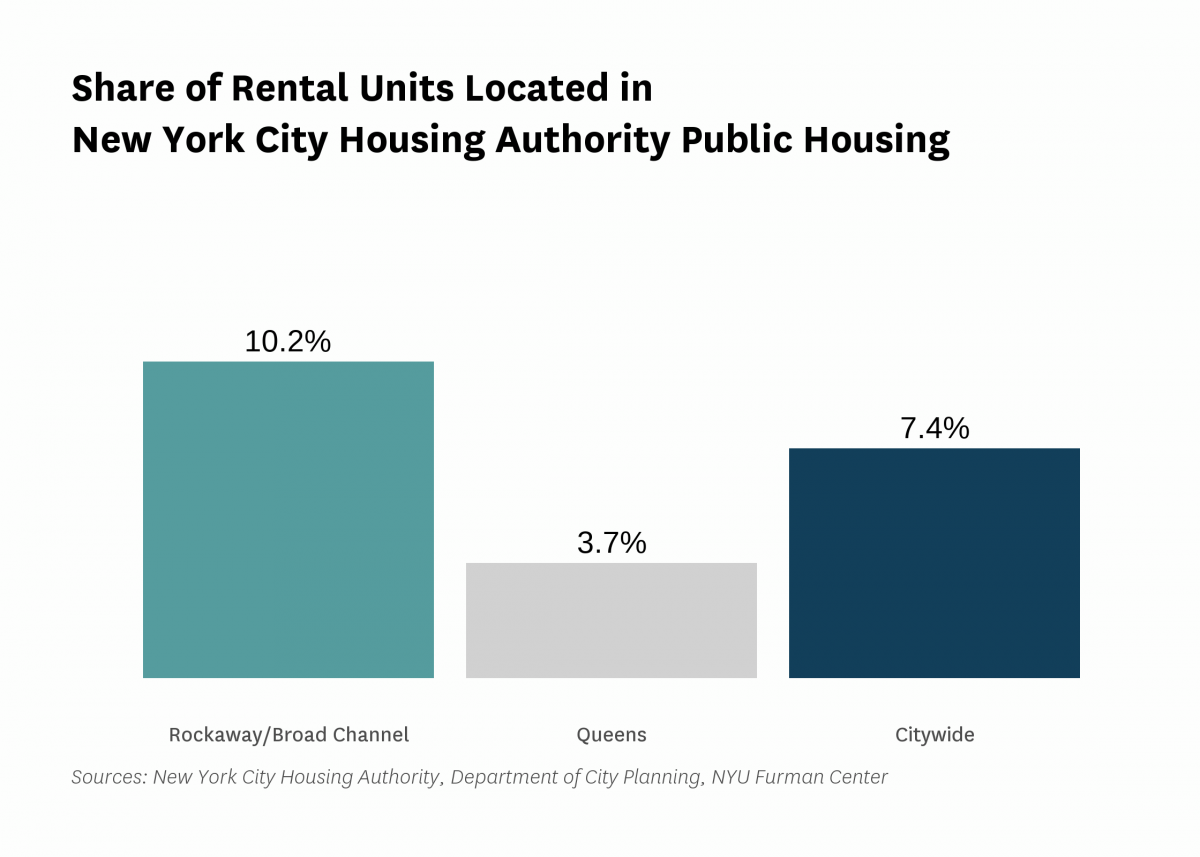
| Public housing (% of rental units) | 10.2% | |||||
Data Notes: See CoreData User Guide for more information about indicator definitions and methods.
Indicators: The rental vacancy rate, severe crowding rate, and the severely rent-burdened households indicators use five-year American Community Survey (ACS) estimates. Data under the 2010 heading comes from the 2006 – 2010 ACS, data under the 2019 heading comes from the 2015 – 2019 ACS and data under the 2021 heading comes from 2017 – 2021 ACS .
All content © 2005 – 2024 Furman Center for Real Estate and Urban Policy | Top of page | Contact Us