State of the City 2022
| New York City Indicators | ||||||
| 2000 | 2006 | 2010 | 2019 | 2021 | 2022 | |
|---|---|---|---|---|---|---|
| Demographics | ||||||
| Population | 8,008,278 | 8,214,426 | 8,184,899 | 8,336,817 | 8,467,513 | — |
| Population aged 65+ | 11.7% | 12.1% | 12.2% | 15.4% | 16.3% | — |
| Foreign-born population | 35.9% | 37.0% | 37.2% | 36.2% | 36.4% | — |
| Households with children under 18 years old | 34.0% | 32.3% | 31.5% | 27.1% | 25.8% | — |
| Racial diversity index | 0.74 | 0.73 | 0.74 | 0.75 | 0.76 | — |
| Income diversity ratio | — | 6.1 | 5.9 | 6.3 | 6.3 | — |
| Median household income (2022$) | $67,100 | $65,320 | $62,760 | $77,390 | $72,150 | — |
| Poverty rate | 21.2% | 19.2% | 20.1% | 16.0% | 18.0% | — |
| Unemployment rate | 9.6% | 7.8% | 11.2% | 5.1% | 11.8% | — |
| Population aged 25+ with a bachelor's degree or higher | 27.4% | 32.1% | 33.4% | 39.2% | 41.0% | — |
| Population aged 25+ without a high school diploma | — | 21.3% | 20.4% | 16.8% | 16.1% | — |
| Housing Market and Conditions | ||||||
| Homeownership rate | 30.2% | 34.4% | 32.1% | 31.9% | 33.3% | — |
| Rental vacancy rate | — | 3.8% | 4.4% | 3.3% | 4.5% | — |
| Severe crowding rate (% of renter households) | — | — | 4.2% | 4.5% | 5.3% | — |
| Serious housing code violations (per 1,000 privately owned rental units)1 | — | 60.9 | 60.2 | 85.6 | 87.9 | 100.2 |
| Notices of foreclosure rate (per 1,000 1-4 unit and condo properties) | 9.0 | 11.5 | 19.1 | 8.7 | 4.6 | 5.9 |
| Home purchase loan rate (per 1,000 properties) | — | 42.8 | 20.2 | 20.2 | 29.7 | — |
| Median sales price per unit, 1 unit building (2022$) | $373,870 | $641,220 | $534,060 | $668,970 | $721,500 | $720,000 |
| Median sales price per unit, 2-4 unit building (2022$) | $209,590 | $377,660 | $289,710 | $420,520 | $456,240 | $449,500 |
| Median sales price per unit, 5+ unit building (2022$) | $73,640 | $145,620 | $129,410 | $278,740 | $256,410 | $250,000 |
| Median sales price per unit, condominium (2022$) | $456,650 | $857,110 | $798,320 | $1,075,930 | $1,048,140 | $1,050,000 |
| Sales volume, all property types | 33,454 | 53,415 | 27,657 | 26,315 | 32,520 | 35,201 |
| Sales volume, 1 unit building | 13,586 | 16,667 | 7,514 | 8,531 | 9,667 | 10,995 |
| Sales volume, 2-4 unit building | 13,702 | 20,773 | 7,809 | 7,464 | 7,301 | 10,597 |
| Sales volume, 5+ unit building | 1,324 | 2,358 | 1,227 | 963 | 1,158 | 1,363 |
| Sales volume, condominium | 4,842 | 13,617 | 11,107 | 9,357 | 14,394 | 12,246 |
| Land Use and Development | ||||||
| Population density (1,000 persons per square mile) | — | 27.3 | 27.2 | 27.8 | 28.2 | — |
| Units authorized by new residential building permits | 15,544 | 44 | 7,328 | 28,666 | 23,352 | 68,610 |
| Units issued new certificates of occupancy | 13,603 | 24,982 | 22,074 | 25,135 | 28,381 | 25,814 |
| Neighborhood Services and Conditions | ||||||
| Car-free commute (% of commuters) | 63.8% | 67.3% | 69.4% | 70.5% | 62.2% | — |
| Mean travel time to work (minutes) | 40.0 | 39.0 | 38.7 | 41.7 | 39.8 | — |
| Serious crime rate (per 1,000 residents) | 23.1 | 15.8 | 12.9 | 11.6 | 11.7 | 14.2 |
| Students performing at grade level in ELA, 4th grade | — | — | — | 49.6% | — | 43.6% |
| Students performing at grade level in math, 4th grade | — | — | — | 49.4% | — | 41.9% |
| Renters | ||||||
| Median rent, all (2022$) | $1,200 | $1,330 | $1,450 | $1,650 | $1,700 | — |
| Median rent, recent movers (2022$) | — | $1,670 | $1,840 | $2,240 | $2,130 | — |
| Rental units affordable at 80% AMI (% of recently available units) | — | 52.5% | 44.9% | 40.7% | 40.7% | — |
| Rental units affordable at 120% AMI (% of recently available units) | — | 81.7% | 78.1% | 76.0% | 76.0% | — |
| Severely rent-burdened households | 23.7% | 27.9% | 29.1% | 26.2% | 30.1% | — |
| Severely rent-burdened households, low income households | — | 43.9% | 45.7% | 44.1% | 44.1% | — |
| Housing choice vouchers (% of occupied, privately owned rental units) | — | — | 6.9% | 6.1% | — | — |
| Public housing (% of rental units) | — | — | — | — | — | 7.4% |
| 1 In 2019 some violations types were reclassified into the most serious class, resulting in an increase in this indicator. | ||||||
| New York City Indicators by Race and Ethnicity | ||||
| Asian | Black | Hispanic | White | |
|---|---|---|---|---|
| Demographics | ||||
| Population | 1,217,790 | 1,827,639 | 2,464,120 | 2,614,667 |
| Percentage change since 2000 | 56.1% | −6.9% | 14.1% | −6.7% |
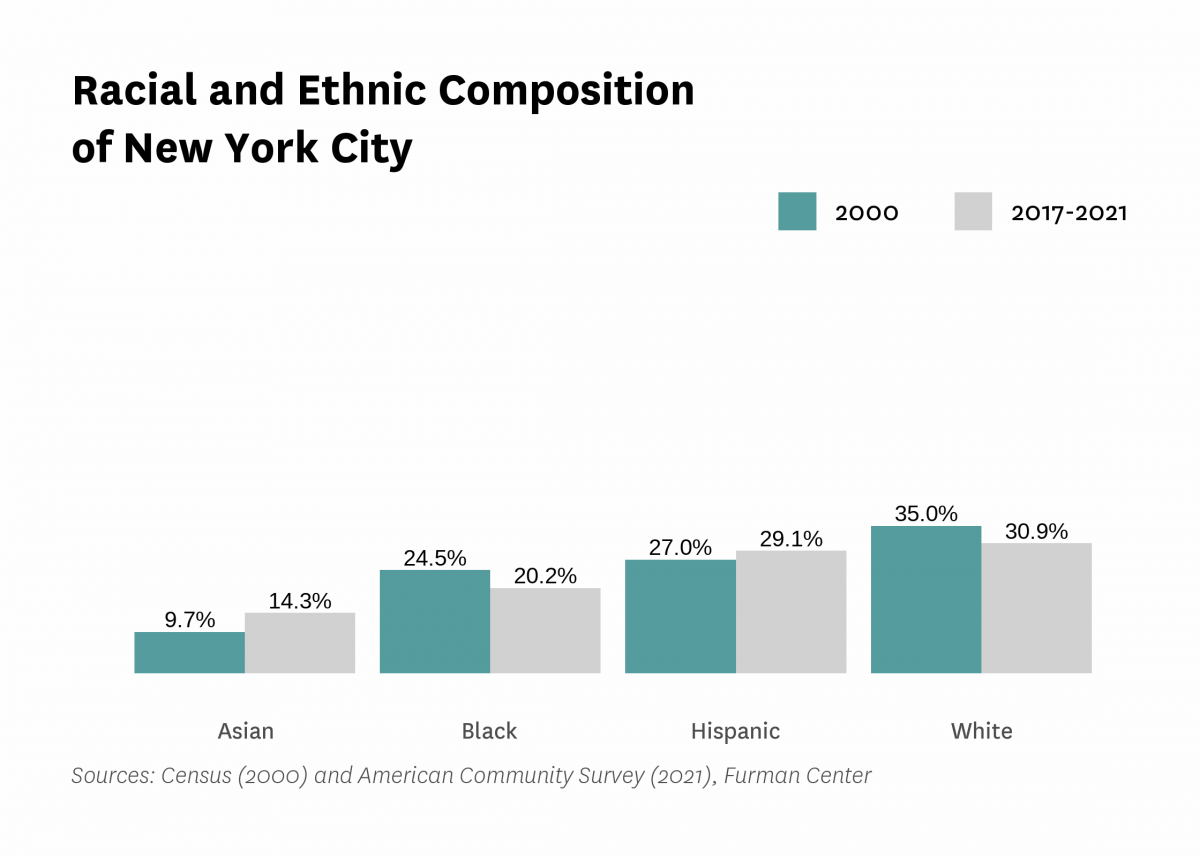
| Share of New York City population | 14.4% | 21.6% | 29.1% | 30.9% |
| Percentage point change since 2000 | 4.7 | −2.9 | 2.1 | −4.1 |
| 1 Foreign-born population | 68.5% | 30.2% | 39.6% | 21.9% |
| Percentage point change since 2000 | −9.0 | 1.1 | −1.6 | −1.3 |
| 1 Population under 18 years old | 17.3% | 21.7% | 24.9% | 17.0% |
| Percentage point change since 2000 | −13.4 | −7.6 | −5.7 | −1.7 |
| 1 Population aged 65+ | 17.7% | 21.1% | 24.4% | 17.4% |
| Percentage point change since 2000 | 10.2 | 12.6 | 18.0 | 0.5 |
| 1 Disabled population | 4.4% | 10.7% | 10.9% | 6.7% |
| Median household income (2022$) | $77,227 | $55,382 | $51,265 | $103,033 |
| Percentage change since 1999 | 7.2% | 1.8% | 5.4% | 15.9% |
| 1 Poverty rate | 16.6% | 20.9% | 24.2% | 11.4% |
| Percentage point change since 2000 | −3.0 | −4.8 | −6.6 | −0.1 |
| 1 Poverty rate, population under 18 years old | 19.1% | 28.1% | 30.6% | 15.5% |
| Percentage point change since 2000 | −4.9 | −5.7 | −9.3 | −0.6 |
| 1 Poverty rate, population aged 65+ | 23.7% | 17.4% | 25.7% | 11.9% |
| Percentage point change since 2000 | −0.6 | −5.9 | −4.3 | 0.1 |
| 1 Unemployment rate | 10.6% | 15.2% | 14.1% | 8.4% |
| Percentage point change since 2000 | 4.2 | 1.0 | 0.3 | 3.1 |
| 1 Population aged 25+ with a bachelor's degree or higher | 44.9% | 27.6% | 22.3% | 62.7% |
| Percentage point change since 2000 | 8.8 | 11.8 | 11.8 | 20.8 |
| 1 Population aged 25+ without a high school diploma | 22.8% | 13.9% | 28.0% | 5.0% |
| Percentage point change since 2000 | −7.7 | −15.7 | −18.5 | −10.2 |
| Housing Market and Conditions | ||||
| 1 Homeownership rate | 45.2% | 27.6% | 17.2% | 43.3% |
| Percentage point change since 2000 | 10.6 | 3.1 | 3.2 | 6.8 |
| Severe crowding rate (% of renter households) | 9.4% | 3.6% | 7.1% | 3.1% |
| 2 Share of home purchase loans | 36.7% | 8.7% | 8.8% | 44.3% |
| Percentage point change since 2006 | 0.2 | −0.1 | −0.1 | 0.0 |
| 3 Share of refinance loans | 21.2% | 14.6% | 10.5% | 52.4% |
| Percentage point change since 2006 | 0.1 | −0.2 | −0.1 | 0.1 |
| Neighborhood Services and Conditions | ||||
| Car-free commute (% of commuters) | 66.6% | 67.3% | 71.1% | 73.7% |
| Mean travel time to work (minutes) | 39.0 | 45.0 | 41.4 | 34.9 |
| Students performing at grade level in ELA, 4th grade | 65.7% | 29.7% | 29.4% | 63.0% |
| Students performing at grade level in math, 4th grade | 71.3% | 24.0% | 25.4% | 62.7% |
| Renters | ||||
| Median rent burden | 37.1% | 35.5% | 36.6% | 30.2% |
| Moderately rent-burdened households | 22.9% | 23.9% | 26.3% | 22.5% |
| Severely rent-burdened households | 33.4% | 33.9% | 33.8% | 26.1% |
| 1 It is not possible to disaggregate the data for Black and Asian New Yorkers by Hispanic ethnicity, therefore some double counting may occur. | ||||
| 2 Values indicate race/ethnic share of all home purchase loans. | ||||
| 3 Values indicate race/ethnic share of all refinance loans. | ||||
All content © 2005 – 2024 Furman Center for Real Estate and Urban Policy | Top of page | Contact Us