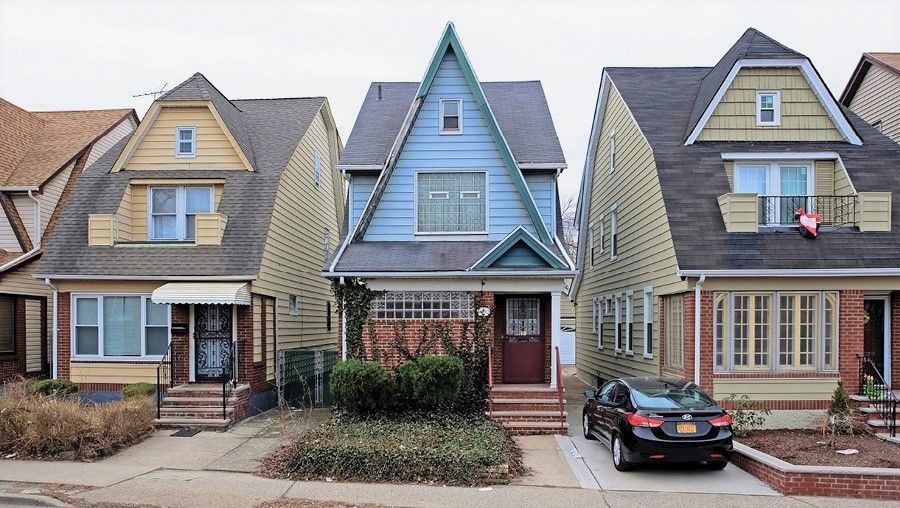
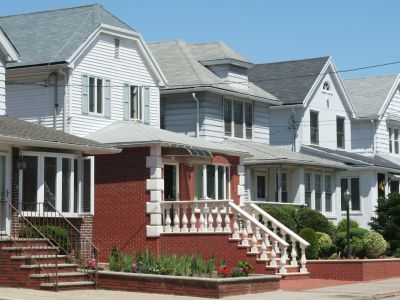
State of the City’s Housing & Neighborhoods
The Furman Center is pleased to present the 2011 edition of the State of New York City’s Housing and Neighborhoods. In this annual report, the Furman Center compiles statistics on housing, demographics and quality of life in the City, its five boroughs and 59 community districts.
This year we examine the distribution of the burden of New York City’s property tax, analyze the changing racial and ethnic makeup of city neighborhoods, evaluate the state of mortgage lending in New York City and highlight the Furman Center’s latest research on public and subsidized rental housing.
Each section may be downloaded as an individual PDF file below.
Download the report (PDF, 22.53 MB)
Each section may be downloaded as an individual PDF file below.
- Front Matter Acknowledgments and Table of Contents
- Executive Summary Introduction to the 2011 edition and a summary of key findings
- Distribution of the Burden of New York City’s Property Tax
- The Changing Racial and Ethnic Makeup of NYC Neighborhoods
- The State of Mortgage Lending in New York City
- Subsidized Housing: A Cross-City Comparison
- User’s Guide
- New York City Data and analysis of trends on New York city as a whole
- State of New Yorkers Data and analysis of a number of neighborhood quality indicators by race rather than geography
- The Bronx Data and analysis of trends in the Bronx and its 12 community districts
- Brooklyn Data and analysis of trends in Brooklyn and its 18 community districts
- Manhattan Data and analysis of trends in Manhattan and its 12 community districts
- Queens Data and analysis of trends in Queens and its 14 community districts
- Staten Island Data and analysis of trends in Staten Island and its three community districts
- Indicator Definitions and Rankings Data indicator definitions, source information, and geography and year for which data is available. This section also provides rankings for each indicator, showing the neighborhoods that have the highest and lowest totals.
- Methods This section includes a description of our data methods.
- The Furman Center Data Search Tool
- About the Furman Center
The data for each community district may be downloaded as an individual PDF file below.
Bronx
- BX 01 Mott Haven / Melrose
- BX 02 Hunts Point / Longwood
- BX 03 Morrisania / Crotona
- BX 04 Highbridge / Concourse
- BX 05 Fordham / University Heights
- BX 06 Belmont / East Tremont
- BX 07 Kingsbridge Heights / Bedford
- BX 08 Riverdale / Fieldston
- BX 09 Parkchester / Soundview
- BX 10 Throgs Neck / Co-op City
- BX 11 Morris Park / Bronxdale
- BX 12 Williamsbridge / Baychester
Brooklyn
- BK 01 Greenpoint / Williamsburg
- BK 02 Fort Greene / Brooklyn Heights
- BK 03 Bedford Stuyvesant
- BK 04 Bushwick
- BK 05 East New York / Starrett City
- BK 06 Park Slope / Carroll Gardens
- BK 07 Sunset Park
- BK 08 Crown Hts / Prospect Hts
- BK 09 S. Crown Hts / Lefferts Gardens
- BK 10 Bay Ridge / Dyker Heights
- BK 11 Bensonhurst
- BK 12 Borough Park
- BK 13 Coney Island
- BK 14 Flatbush / Midwood
- BK 15 Sheepshead Bay
- BK 16 Brownsville
- BK 17 East Flatbush
- BK 18 Flatlands / Canarsie
Staten Island
Manhattan
- MN 01 Financial District
- MN 02 Greenwich Village / Soho
- MN 03 Lower East Side / Chinatown
- MN 04 Clinton / Chelsea
- MN 05 Midtown
- MN 6 Stuyvesant Town / Turtle Bay
- MN 07 Upper West Side
- MN 08 Upper East Side
- MN 09 Morningside Heights / Hamilton
- MN 10 Central Harlem
- MN 11 East Harlem
- MN 12 Washington Heights / Inwood
Queens
- QN 01 Astoria
- QN 02 Woodside / Sunnyside
- QN 03 Jackson Heights
- QN 04 Elmhurst / Corona
- QN 05 Ridgewood / Maspeth
- QN 06 Rego Park / Forest Hills
- QN 07 Flushing / Whitestone
- QN 08 Hillcrest / Fresh Meadows
- QN 09 Kew Gardens / Woodhaven
- QN 10 S. Ozone Park / Howard Beach
- QN 11 Bayside / Little Neck
- QN 12 Jamaica / Hollis
- QN 13 Queens Village
- QN 14 Rockaway / Broad Channel

