State of the City 2022
In this section we describe high-level trends on the economic recovery from the COVID-19 pandemic, the city’s homeless shelter population, and how the composition of New Yorkers by income has changed since 2000. We looked at American Community Survey and U.S. Bureau of Labor and Statistics data to understand recent trends in unemployment. Unemployment reached a peak in Q2 2020, and while it has steadily declined since then, the rate began to rise in the fourth quarter of 2022 at a faster pace than the state and country. Additionally, while subway ridership marginally increased between 2021 and 2022, turnstile entries remain well below pre-pandemic counts. An increase in both sheltered families and single adults lead to an 8 percent increase in the city’s sheltered homeless population between 2021 and 2022. A long-standing trend has been the shift in population by income. We noticed a decline in owner households with an annual income between $100,000 and $250,000 in 2021 compared to the year 2000, whereas the share of renter households in the same income bracket increased during the same time period.
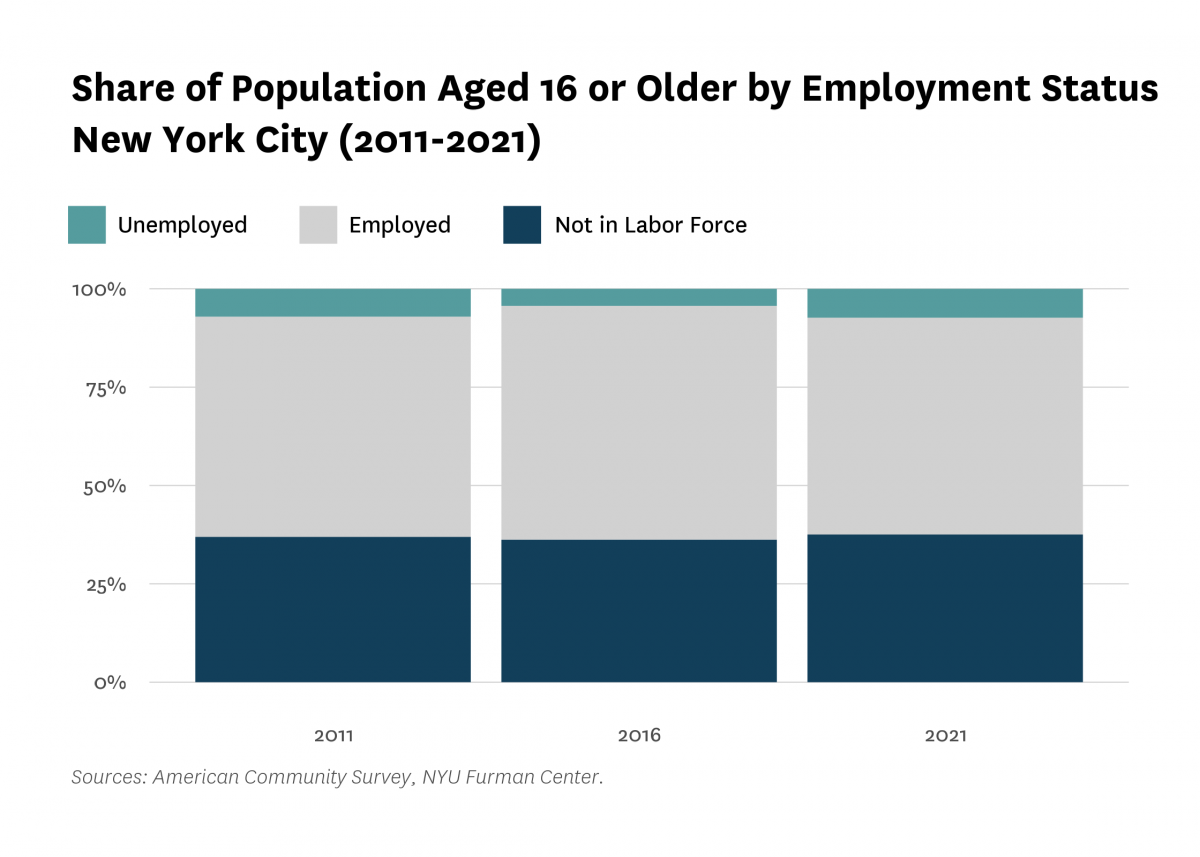
The share of unemployed New York City residents increased in 2021.
In 2021, 7.3 percent of New Yorkers aged 16 or older were unemployed, an increase of 3.0 percentage points from 2016 and 0.3 percentage points from 2011 (2011 included an initial period of economic recovery after the Great Recession). According to 2021 ACS data, 55.1 percent of New Yorkers were employed in 2021, which was a 4.3 percentage point decrease from 2016 and a 0.9 percentage point decrease from 2011. The share of the population not in the labor force in 2021 was 37.5 percent, an increase of 1.3 percentage points from 2016 and 0.6 percentage points from 2011.
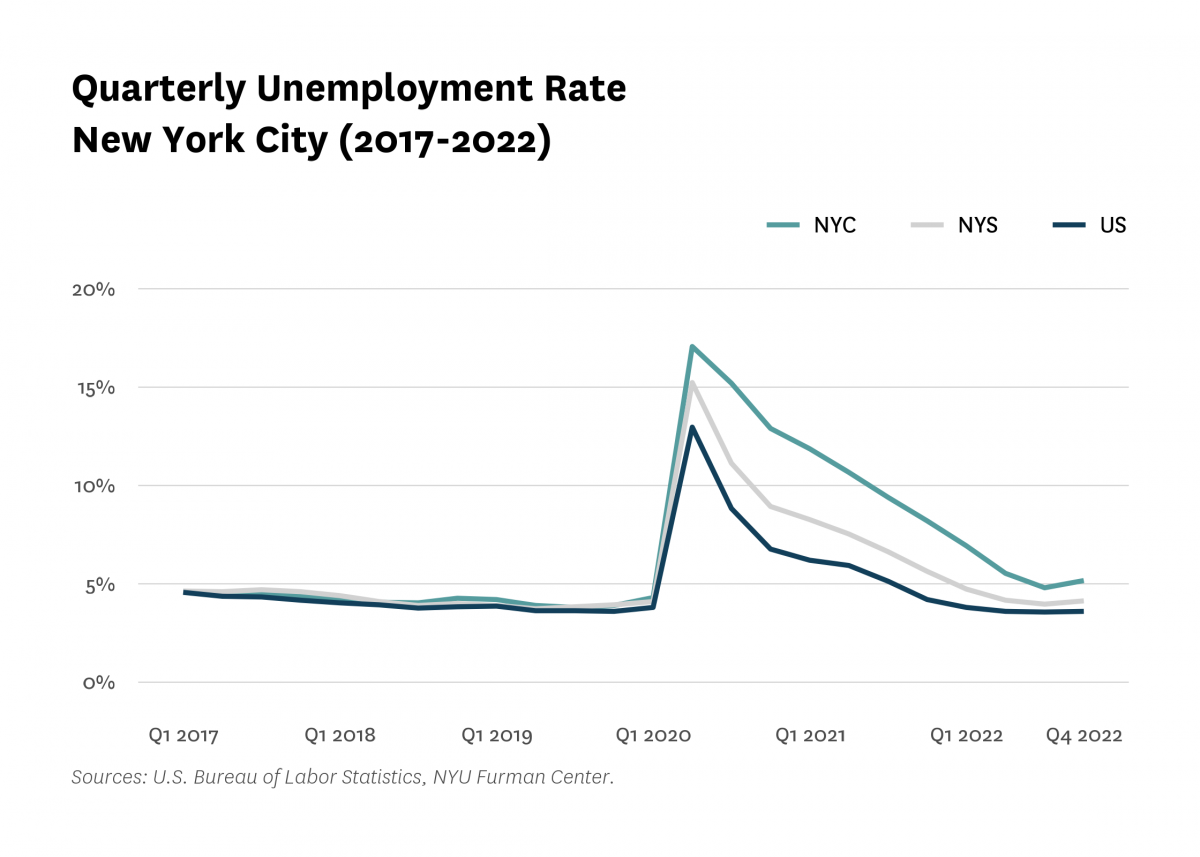
Unemployment declined during the first three quarters of 2022, but increased in the fourth quarter of 2022.
Data from the Department of Labor shows that between the third quarter of 2022 and the fourth quarter of 2022, the unemployment rate increased by 0.4 percentage points in New York City and 0.2 percentage points in New York State. In contrast, it remained flat nationwide. While both the city and state began this period with unemployment rates higher than the national average, New York City’s unemployment rate also increased at a faster rate than New York State or the country. The city ended 2022 with a 5.2 percent unemployment rate, compared with 4.1 percent for New York State, and 3.6 percent for the United States.
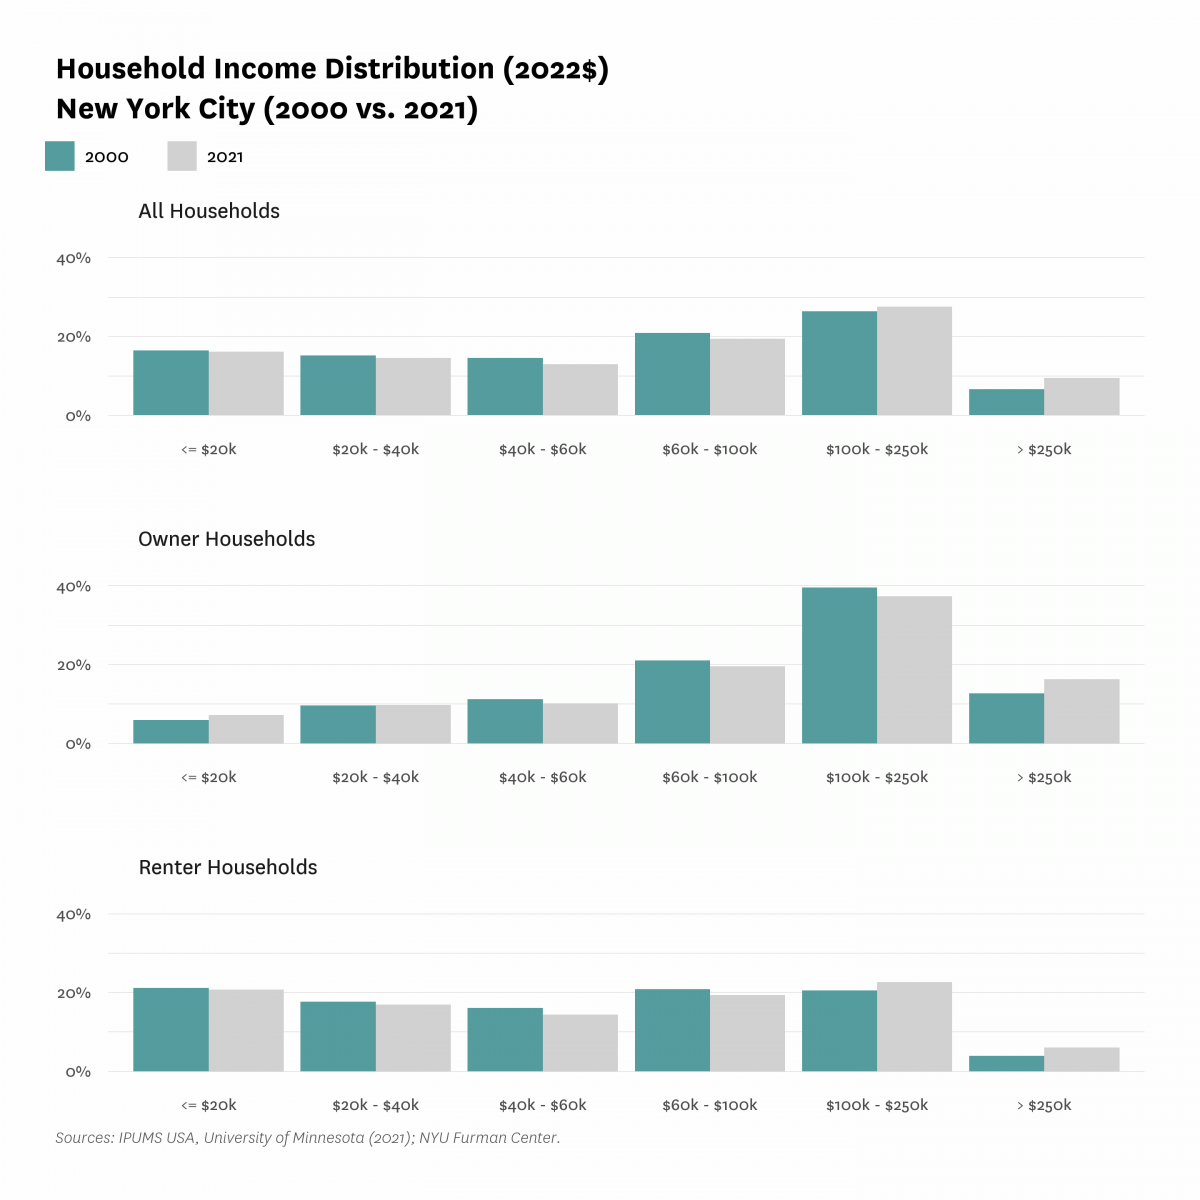
Between 2000 and 2021, the share of owner households with annual incomes between $100,000 and $250,000 decreased, while the share of renter households in the same income bracket increased.
When controlling for inflation, we find that the composition of households by income has slightly changed since 2000. The share of owner households with earnings between $100,000 to $250,000 decreased by 2.3 percentage points between 2000 and 2021, while the share of renter households in the same income bracket increased by 2.1 percentage points. The shares of both owner and renter households with annual incomes over $250,000 increased by 3.6 percentage points and 2.1 percentage points, respectively. On the other end of the income spectrum, the share of owner households with an annual income lower than or equal to $20,000 increased by 1.3 percentage points, while it decreased slightly for renter households by 0.4 percentage points. The share of all households with earnings between $40,000 to $60,000 and $60,000 to $100,000 decreased by 1.6 percentage points and 1.5 percentage points, respectively.
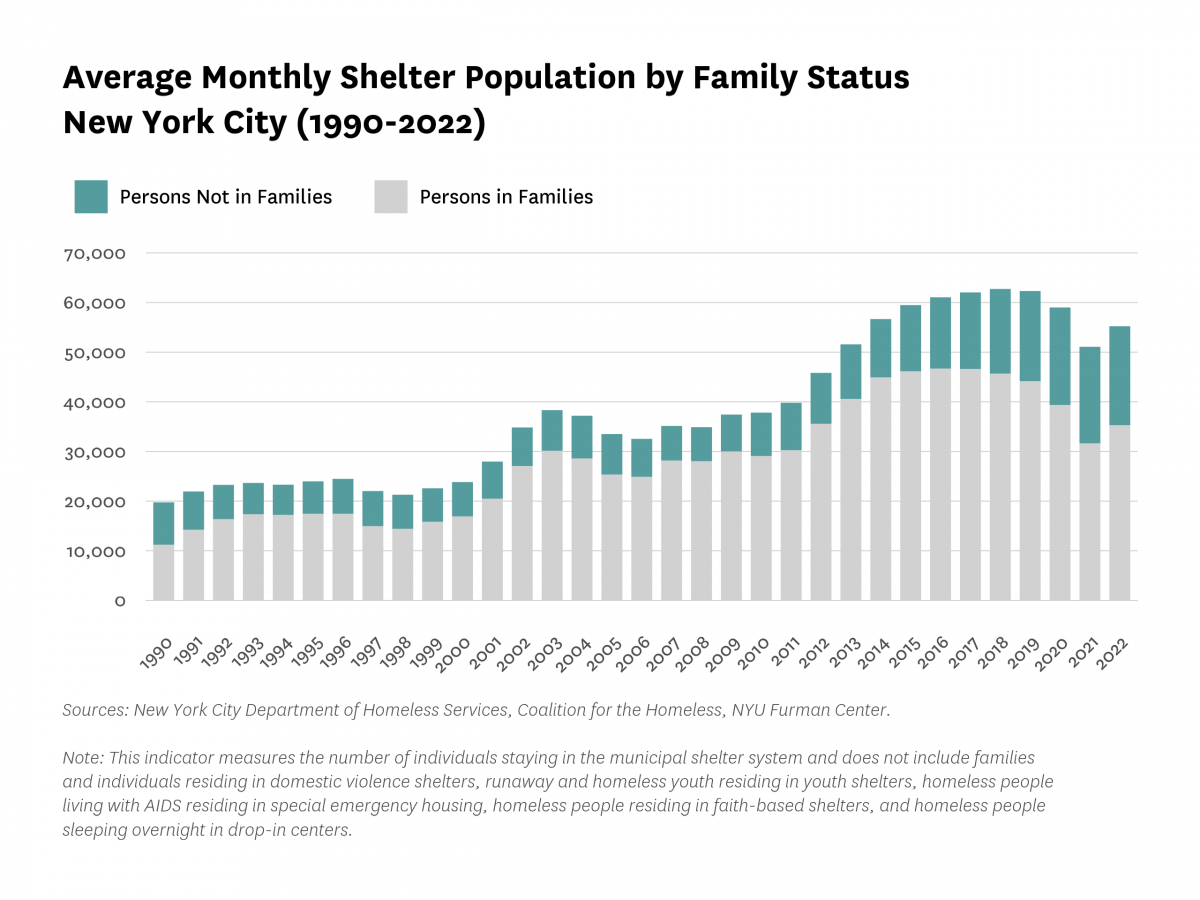
The overall number of people who lived in homeless shelters increased between 2021 and 2022.
The total homeless shelter population increased by about 8.1 percent between 2021 and 2022, from 51,090 to 55,227. The overall increase was largely driven by an 11.5 percent increase in the number of families who lived in homeless shelters. The number of single adults increased to 19,963 individuals, surpassing 2020’s record by 1.6 percent for the largest single adult population since the City of New York made data available in 1990. Despite the increases, the total average monthly shelter population remained below a peak of 62,739 in 2018. It is important to note that the data from the New York City Department of Homeless Services only accounts for the sheltered homeless population, which does not capture the total number of individuals experiencing homelessness.
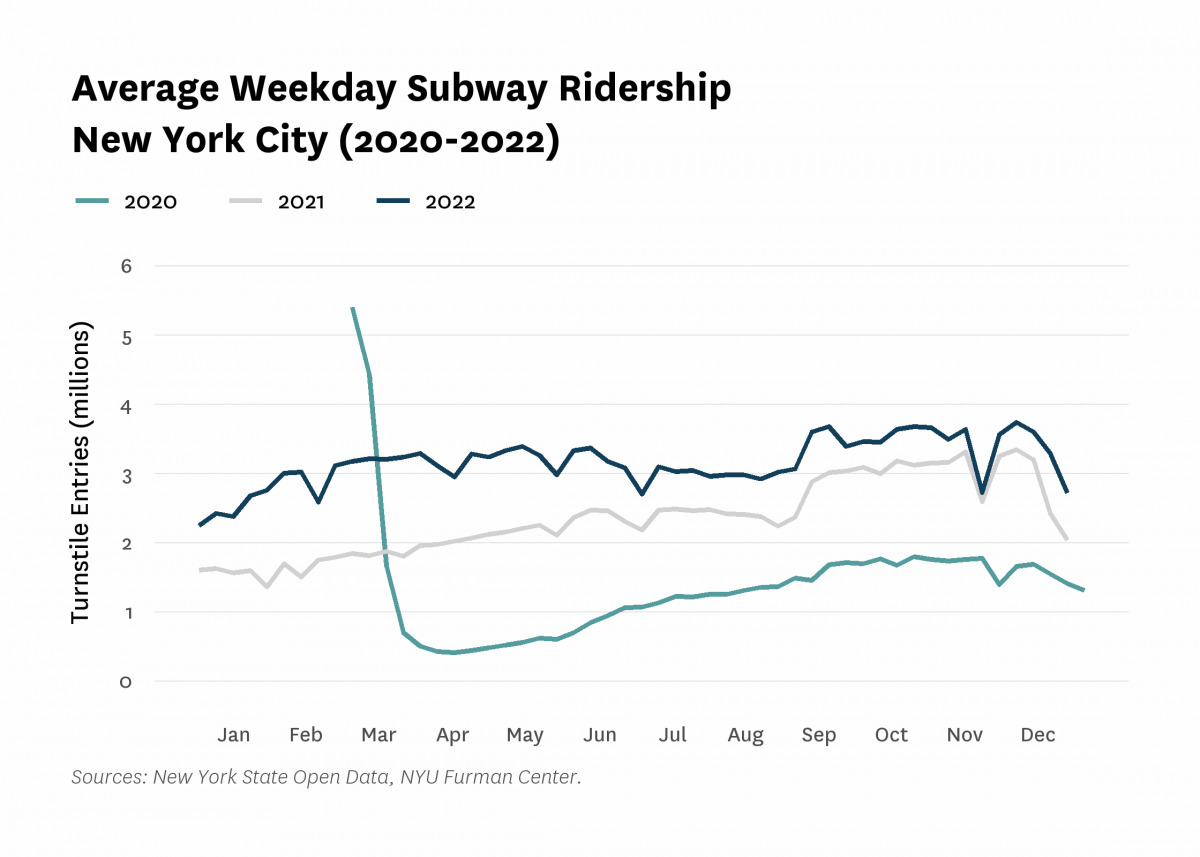
Average weekday subway ridership increased between 2021 and 2022, but remained well below pre-pandemic levels.
Weekday subway ridership slightly recovered in 2022, ranging from about 2.25M entries in early January to a peak of over 3.7M entries in early December. Ridership in early March 2022 was 72.6 percent higher than the same time period in 2021, but was still 41.2 percent lower than the ridership of 5.4M entries in early March 2020, just prior to the start of the pandemic and economic shutdown. Subway ridership counts are likely the results of a few macroeconomic trends, including a combination of employer work from home policies and preferences, tourism patterns, and the availability of alternative modes of transportation.
All content © 2005 – 2024 Furman Center for Real Estate and Urban Policy | Top of page | Contact Us