| Indicator | 2000 | 2006 | 2010 | 2019 | 2021 | 2022 |
|---|---|---|---|---|---|---|
| Population | ||||||
| Born in New York State | 59.7% | 60.1% | 62.7% | 52.8% | ||
| Disabled population | 10.5% | 11.7% | 14.4% | |||
| Foreign-born population | 23.6% | 28.3% | 28.8% | 25.6% | 35.9% | |
| Population | 116,790 | 116,936 | 115,433 | 128,369 | 123,956 | |
| Population aged 65+ | 7.2% | 9.1% | 9.4% | 12.5% | 15.1% | |
| Households | ||||||
| Households with children under 18 years old | 51.7% | 45.1% | 45.1% | 30.5% | 25.4% | |
| Single-person households | 27.8% | 26.5% | 36.7% | 33.6% | ||
| Race and Ethnicity | ||||||
| Percent Asian | 0.6% | 0.3% | 0.4% | 0.9% | 1.7% | |
| Percent Black | 75.9% | 77.3% | 74.0% | 68.4% | 65.9% | |
| Percent Hispanic | 20.4% | 20.3% | 24.6% | 25.6% | 20.9% | |
| Percent white | 0.7% | 0.8% | 0.4% | 3.8% | 2.8% | |
| Racial diversity index | 0.38 | 0.36 | 0.39 | 0.47 | 0.52 | |
| Income and Poverty | ||||||
| Income diversity ratio | 6.8 | 6.0 | 6.8 | 6.2 | ||
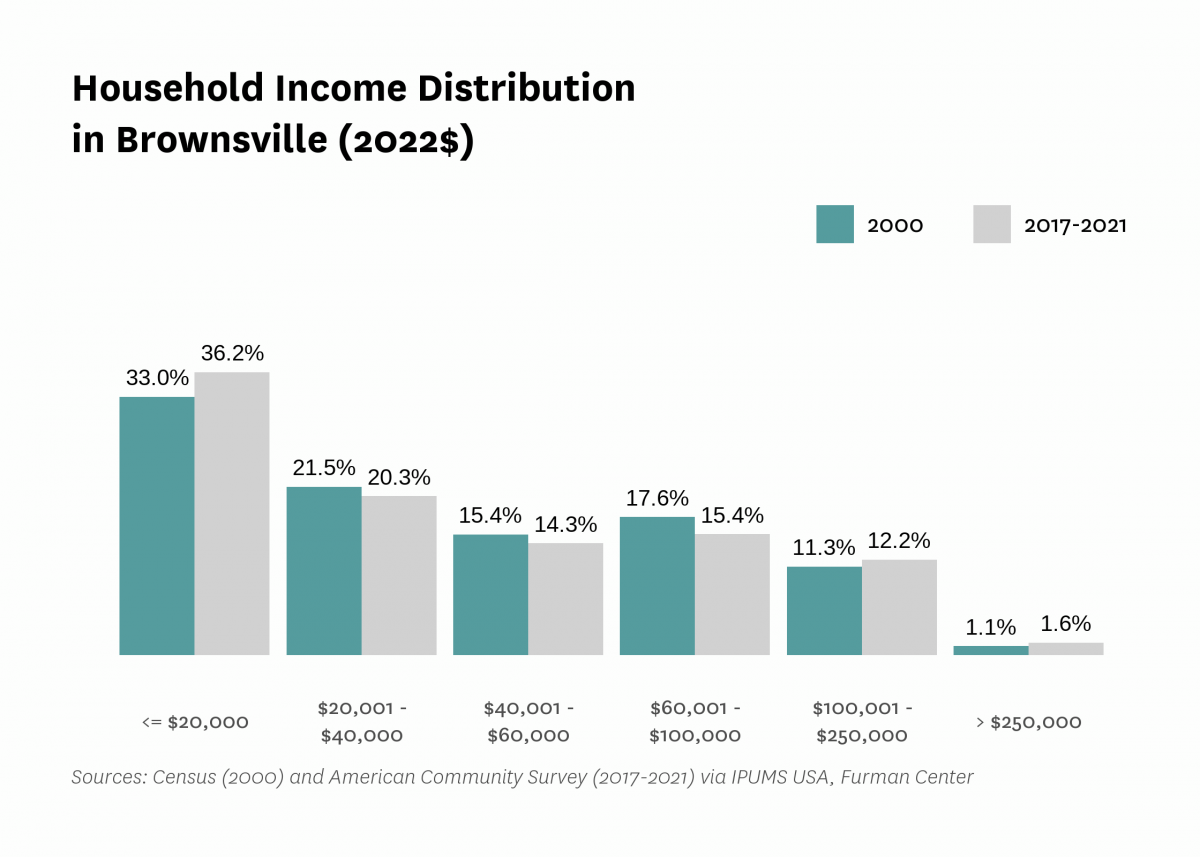
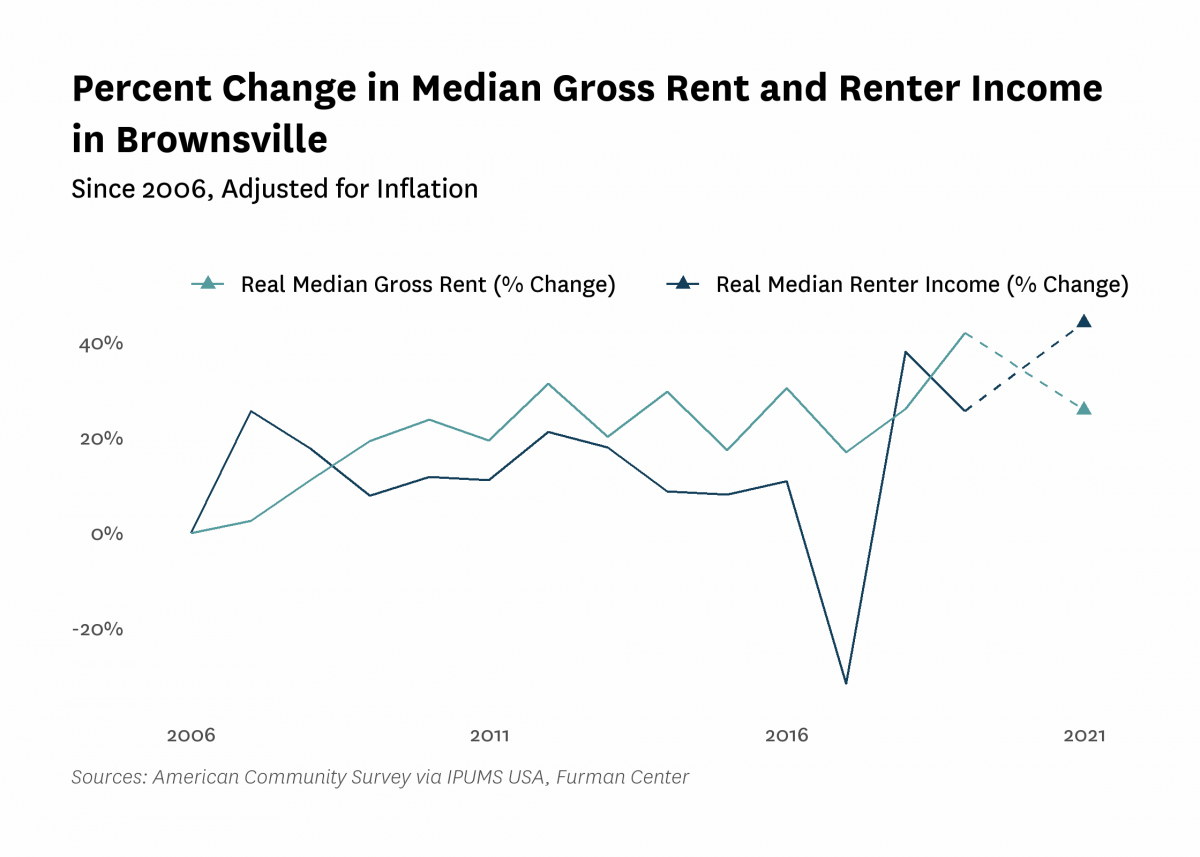
| Median household income (2022$) | $37,320 | $32,290 | $33,780 | $34,950 | $40,620 | |
| Median household income, homeowners (2022$) | $78,640 | $80,610 | $82,070 | $80,380 | ||
| Median household income, renters (2022$) | $23,460 | $26,220 | $29,470 | $33,820 | ||
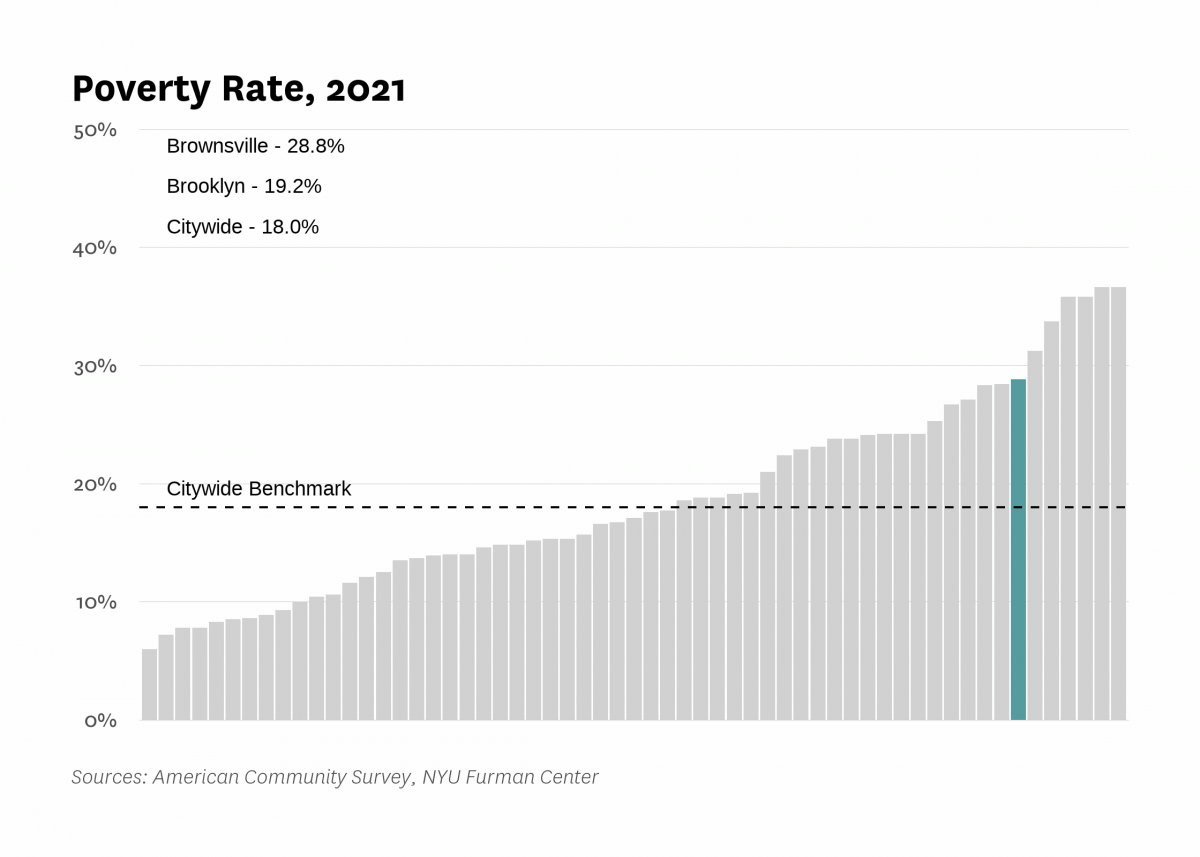
| Poverty rate | 42.6% | 38.7% | 39.8% | 34.3% | 28.8% | |
| Poverty rate, population aged 65+ | 39.5% | 25.4% | 33.9% | 23.6% | ||
| Poverty rate, population under 18 years old | 51.7% | 53.4% | 47.4% | 38.3% | ||
| Labor Market | ||||||
| Labor force participation rate | 51.2% | 54.1% | 54.5% | 56.2% | ||
| Population aged 25+ without a high school diploma | 33.0% | 27.7% | 23.9% | 15.1% | ||
| Unemployment rate | 22.30% | 13.10% | 15.58% | 7.62% | 18.02% | |
| Indicator | 2000 | 2006 | 2010 | 2019 | 2021 | 2022 |
|---|---|---|---|---|---|---|
| Housing Stock | ||||||
| Homeownership rate | 16.8% | 21.6% | 17.5% | 17.7% | 21.4% | |
| Housing units | 44,350 | 45,117 | 55,188 | 50,473 | ||
| Rental vacancy rate | 5.3% | 3.9% | 2.5% | |||
| Serious housing code violations (per 1,000 privately owned rental units) | 136.4 | 143.7 | 175.9 | 156.3 | 164.1 | |
| Severe crowding rate (% of renter households) | 2.0% | 1.6% | 2.1% | |||
| Total housing code violations (per 1,000 privately owned rental units) | 572.5 | 473.1 | 641.1 | 613.4 | 578.3 | |
| Finance - Distress | ||||||
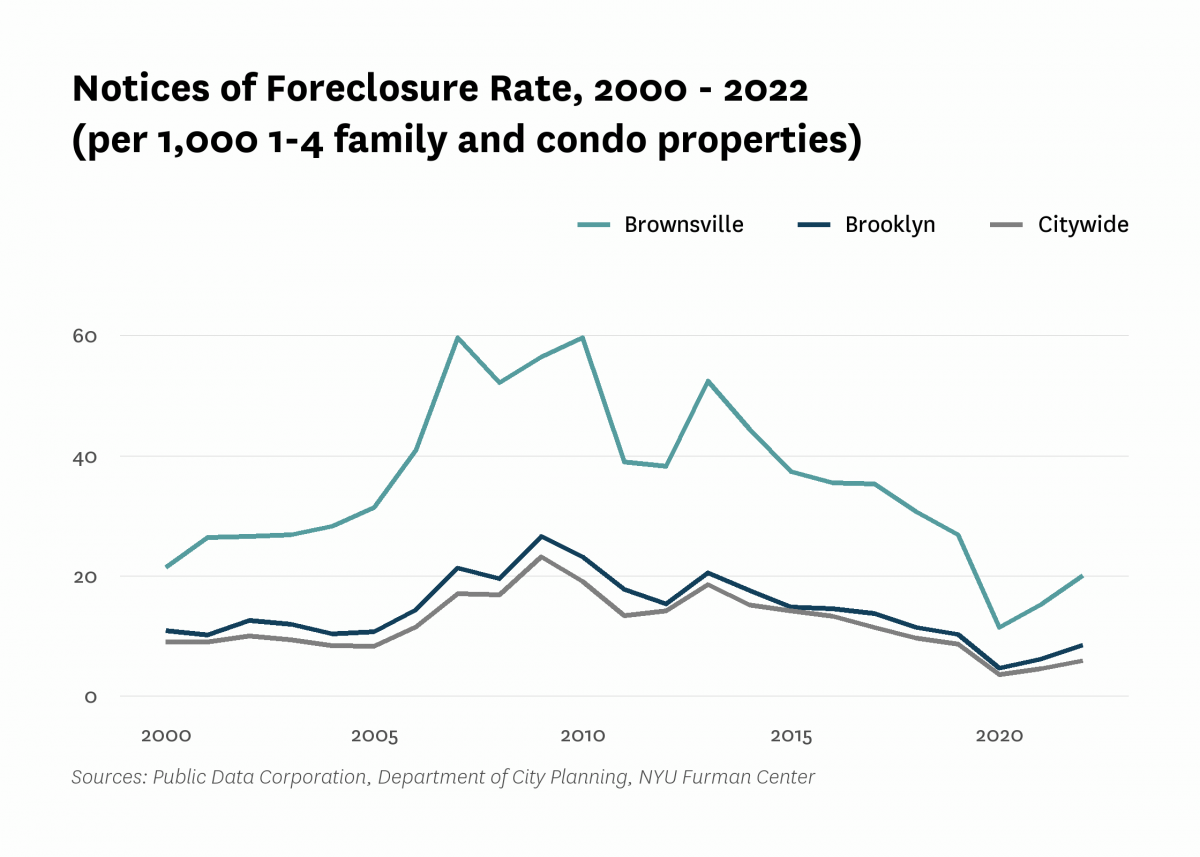
| Notices of foreclosure rate (per 1,000 1-4 family and condo properties) | 21.4 | 41.0 | 59.7 | 26.9 | 15.3 | 20.1 |
| Notices of foreclosure, all residential properties | 154 | 255 | 371 | 178 | 95 | 131 |
| Notices of foreclosure, initial, 1-4 family and condo properties | 92 | 193 | 198 | 65 | 20 | 46 |
| Notices of foreclosure, repeat, 1-4 family and condo properties | 11 | 34 | 145 | 90 | 69 | 71 |
| Pre-foreclosure notice rate (per 1,000 1-4 family and condo properties) | 99.7 | 41.8 | 96.4 | |||
| Pre-foreclosure notices, 1-4 family and condo properties | 575 | 243 | 561 | |||
| Properties entering REO, 1-4 family | 23 | 13 | 14 | |||
| Finance - Lending | ||||||
| FHA/VA-backed home purchase loans (% of home purchase loans) | 1.4% | 83.2% | 33.8% | 34.0% | ||
| Higher-cost home purchase loans (% of home purchase loans) | 57.2% | 0.8% | 17.6% | 5.2% | ||
| Higher-cost refinance loans (% of refinance loans) | 49.9% | 7.7% | 5.7% | 1.3% | ||
| Home purchase loan rate (per 1,000 properties) | 74.6 | 13.5 | 14.6 | 19.6 | ||
| Home purchase loans in LMI tracts (% of home purchase loans) | 94.9% | 15.4% | 88.0% | 88.5% | ||
| Home purchase loans to LMI borrowers (% of home purchase loans) | 4.3% | 96.2% | 7.2% | 7.9% | ||
| Refinance loan rate (per 1,000 properties) | 99.0 | 10.7 | 21.5 | 39.2 | ||
| Sales - Volume | ||||||
| Sales volume, 1 family building | 35 | 69 | 19 | 29 | 21 | 51 |
| Sales volume, 2-4 family building | 220 | 451 | 103 | 105 | 73 | 118 |
| Sales volume, 5+ family building | 28 | 40 | 19 | 13 | 7 | 8 |
| Sales volume, condominium | 1 | 7 | 12 | 18 | 19 | 24 |
| Sales volume, all property types | 284 | 567 | 153 | 165 | 120 | 201 |
| Sales - Median Prices | ||||||
| Median sales price per unit, 1 family building (2022$) | $254,910 | $505,890 | $366,970 | $528,740 | $577,730 | $540,000 |
| Median sales price per unit, 2-4 family building (2022$) | $161,440 | $299,790 | $164,820 | $408,820 | $387,860 | $387,250 |
| Median sales price per unit, 5+ family building (2022$) | $56,220 | $135,970 | $84,100 | $183,970 | $265,260 | $234,900 |
| Median sales price per unit, condominium (2022$) | $142,680 | $252,950 | $419,760 | $551,900 | $546,430 | $491,360 |
| Sales - Housing Price Index | ||||||
| Index of housing price appreciation, 1 family building | 100.0 | 220.0 | 183.3 | 286.5 | 349.7 | 298.9 |
| Index of housing price appreciation, 2-4 family building | 100.0 | 231.5 | 149.0 | 336.9 | 379.2 | 387.1 |
| Index of housing price appreciation, 5+ family building | 100.0 | 279.8 | 144.1 | 380.8 | 208.6 | 625.6 |
| Index of housing price appreciation, condominium | 100.0 | 54.9 | 33.2 | 85.6 | 87.4 | |
| Index of housing price appreciation, all property types | 100.0 | 234.2 | 147.4 | 332.6 | 363.0 | 379.8 |
| Subsidized Housing | ||||||
| Total number of subsidized properties (properties) | 583 | |||||
| HUD Financing or Insurance (properties) | 13 | |||||
| HUD Financing or Insurance (units) | 831 | |||||
| HUD Project-based Rental Assistance Program (properties) | 31 | |||||
| HUD Project-based Rental Assistance Program (units) | 2,707 | |||||
| Low Income Housing Tax Credit (properties) | 119 | |||||
| Low Income Housing Tax Credit (units) | 4,712 | |||||
| Public Housing (properties) | 48 | |||||
| Public Housing (units) | 8,613 | |||||
| Mitchell-Lama (properties) | 13 | |||||
| Mitchell-Lama (units) | 1,486 | |||||
| 421-a Tax Exemption (properties) | 32 | |||||
| 421-a Tax Exemption (units) | 547 | |||||
| 420-c Tax Exemption (properties) | 116 | |||||
| 420-c Tax Exemption (units) | 3,700 | |||||
| NYC Housing Production Programs and Zoning Incentives or Requirements (properties) | 212 | |||||
| Eligible to expire from housing programs between 2023 and 2028 (properties) | 50 | |||||
| Eligible to expire from housing programs between 2023 and 2028 (units) | 1,559 | |||||
| Eligible to expire from housing programs between 2029 and 2038 (properties) | 37 | |||||
| Eligible to expire from housing programs between 2029 and 2038 (units) | 2,003 | |||||
| Eligible to expire from housing programs in 2039 and later (properties) | 57 | |||||
| Eligible to expire from housing programs in 2039 and later (units) | 3,492 | |||||
| Indicator | 2000 | 2006 | 2010 | 2019 | 2021 | 2022 |
|---|---|---|---|---|---|---|
| Density | ||||||
| Population density (1,000 persons per square mile) | 45.1 | 44.6 | 49.6 | 47.9 | ||
| Development | ||||||
| Units authorized by new residential building permits | 34 | 0 | 403 | 683 | 357 | 987 |
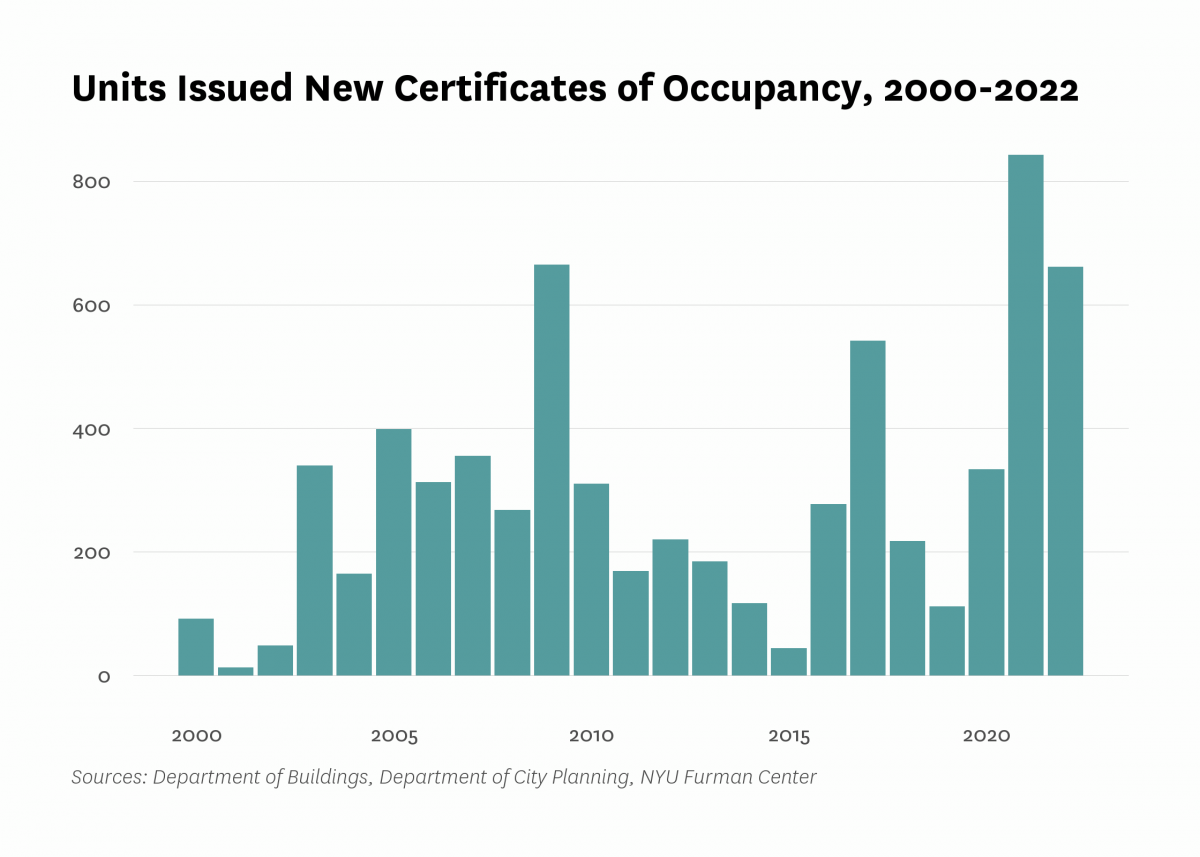
| Units issued new certificates of occupancy | 92 | 313 | 310 | 112 | 842 | 661 |
| Indicator | 2000 | 2006 | 2010 | 2019 | 2021 | 2022 |
|---|---|---|---|---|---|---|
| Commute | ||||||
| Car-free commute (% of commuters) | 73.1% | 76.7% | 78.7% | 74.5% | ||
| Mean travel time to work (minutes) | 48.1 | 43.4 | 47.2 | 47.0 | ||
| Crime and Incarceration | ||||||
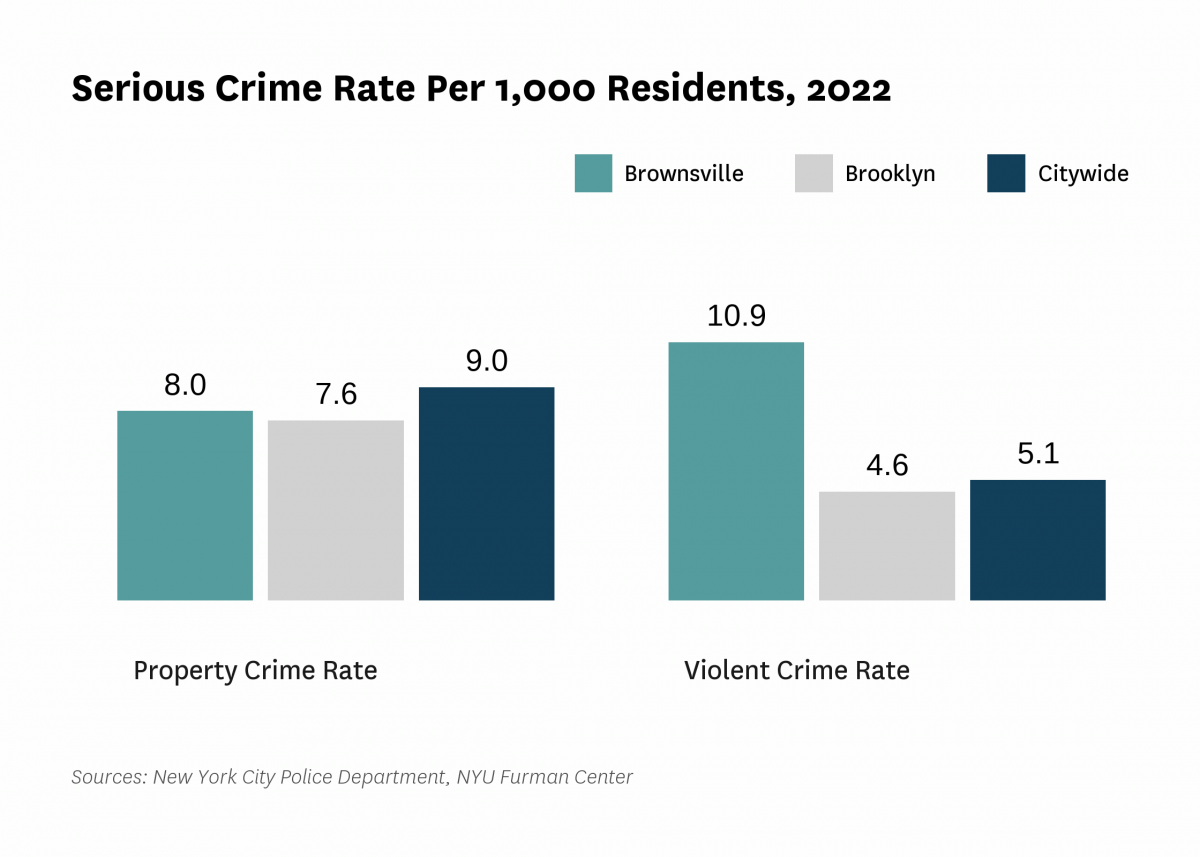
| Serious crime rate (per 1,000 residents) | 23.9 | 23.3 | 16.8 | 16.0 | 18.9 | |
| Serious crime rate, property (per 1,000 residents) | 10.6 | 10.3 | 6.7 | 7.0 | 8.0 | |
| Serious crime rate, violent (per 1,000 residents) | 13.3 | 13.0 | 10.0 | 9.0 | 10.9 | |
| Schools | ||||||
| Students performing at grade level in English language arts, 4th grade | 28.8% | 28.0% | ||||
| Students performing at grade level in math, 4th grade | 25.5% | 19.4% | ||||
| Indicator | 2000 | 2006 | 2010 | 2019 | 2021 | 2022 |
|---|---|---|---|---|---|---|
| Median Rent | ||||||
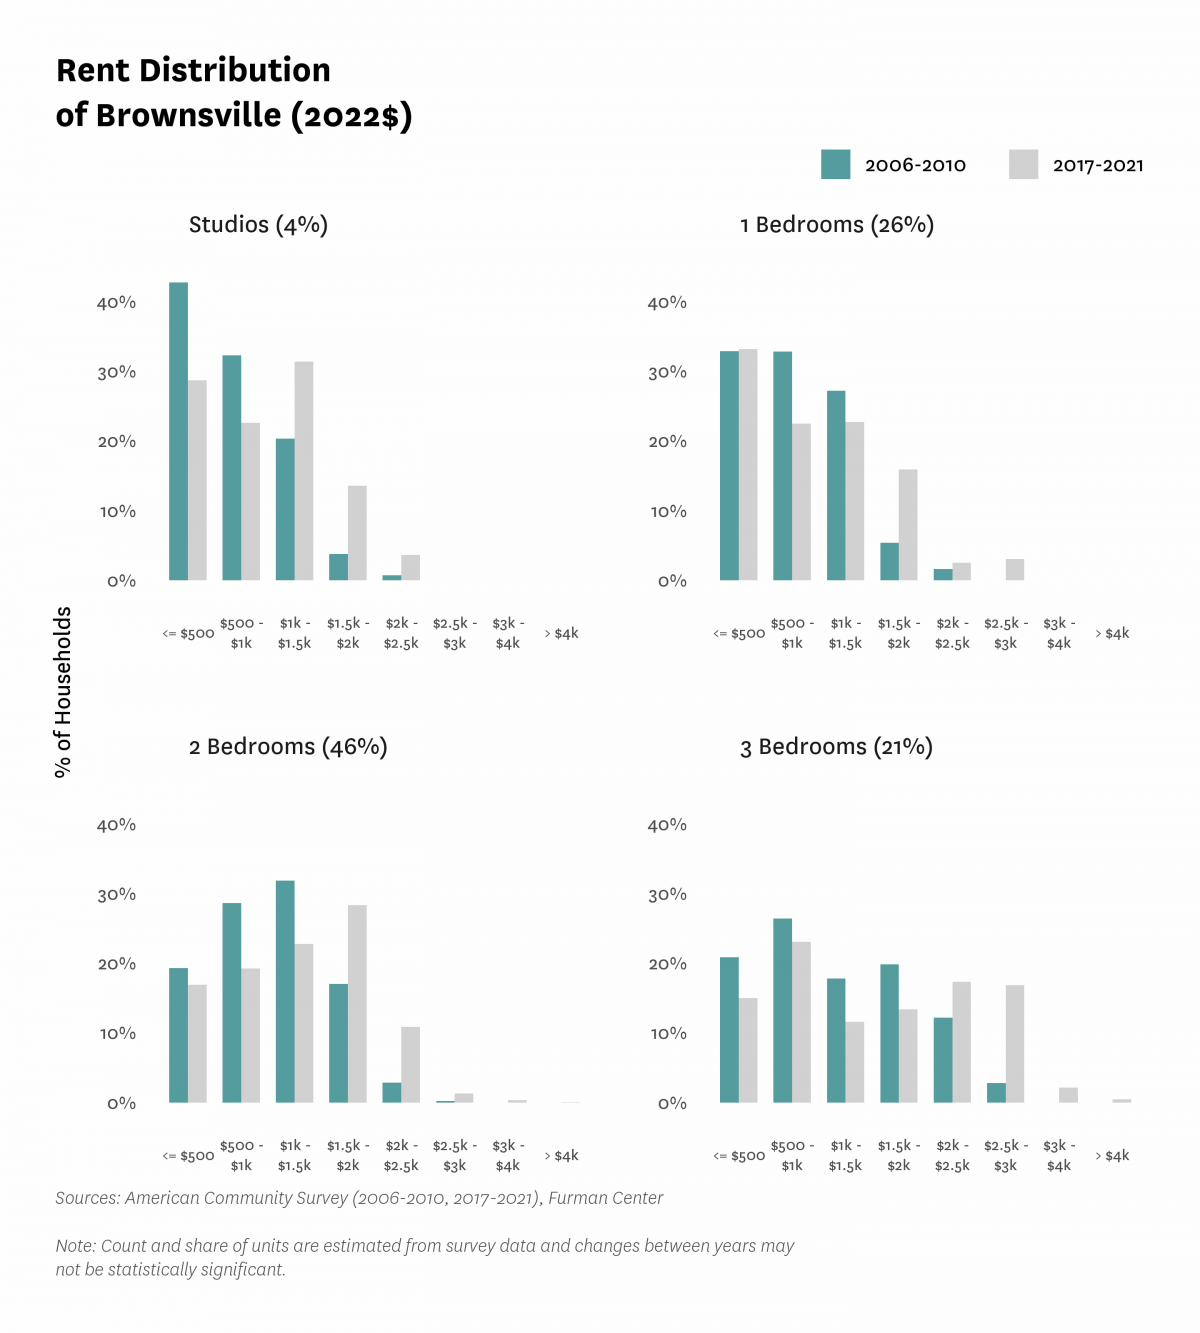
| Median rent, 2- and 3-bedrooms (2022$) | $1,070 | $1,220 | $1,310 | |||
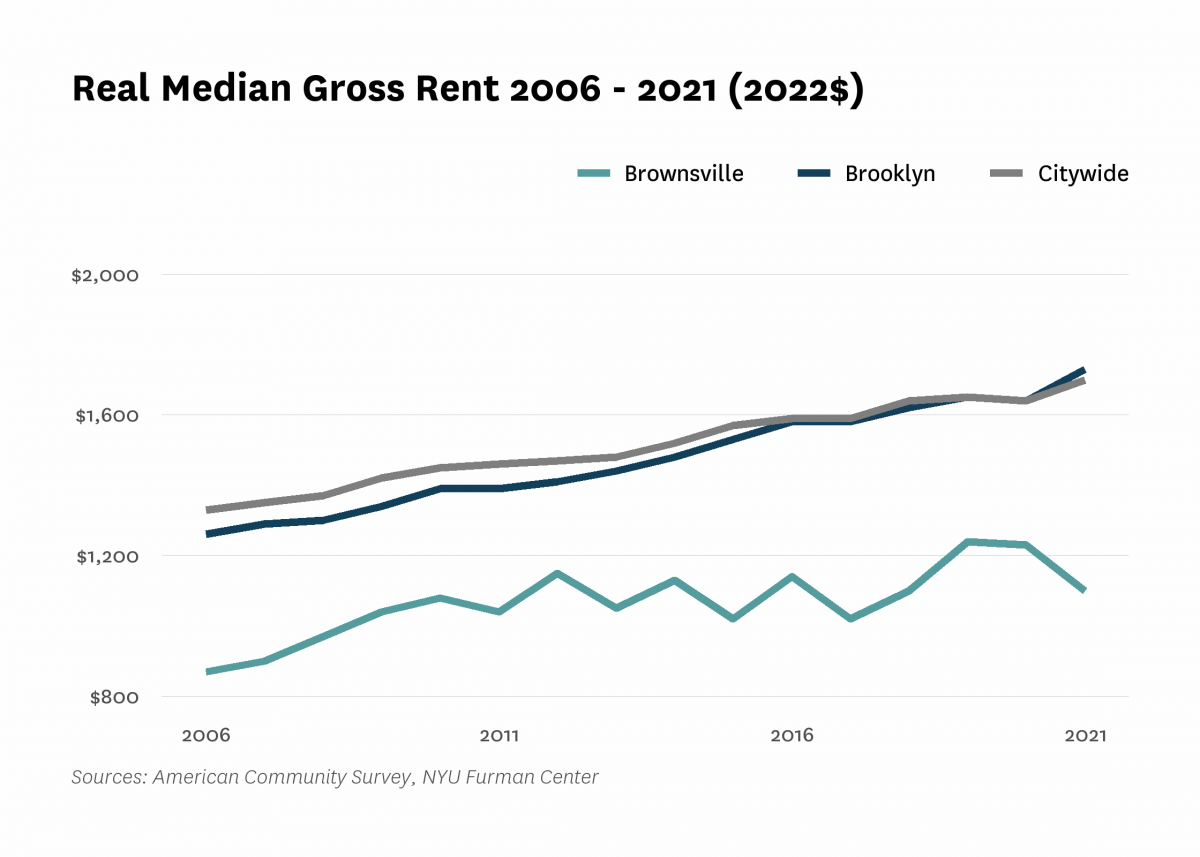
| Median rent, all (2022$) | $850 | $870 | $1,080 | $1,240 | $1,100 | |
| Median rent, recent movers (2022$) | $1,270 | $1,450 | $1,440 | |||
| Median rent, studios and 1-bedrooms (2022$) | $780 | $840 | $900 | |||
| Change in collected rent (2019-2020) | 0.1% | |||||
| Affordability | ||||||
| Rental units affordable at 30% AMI (% of recently available units) | 28.9% | 24.3% | ||||
| Rental units affordable at 80% AMI (% of recently available units) | 86.4% | 75.7% | ||||
| Rental units affordable at 120% AMI (% of recently available units) | 100.0% | 99.0% | ||||
| Rent Burden | ||||||
| Moderately rent-burdened households | 25.1% | 22.8% | 24.2% | 28.6% | ||
| Moderately rent-burdened households, low income | 27.6% | 28.3% | 29.6% | |||
| Moderately rent-burdened households, moderate income | 5.5% | 9.5% | 8.4% | |||
| Severely rent-burdened households | 29.6% | 32.2% | 37.7% | 36.0% | ||
| Severely rent-burdened households, low income | 39.0% | 45.7% | 42.2% | |||
| Severely rent-burdened households, moderate income | 0.0% | 0.0% | 0.0% | |||
| Rental Subsidy | ||||||
| Housing choice vouchers (% of occupied, privately owned rental units) | 12.3% | 9.3% | ||||
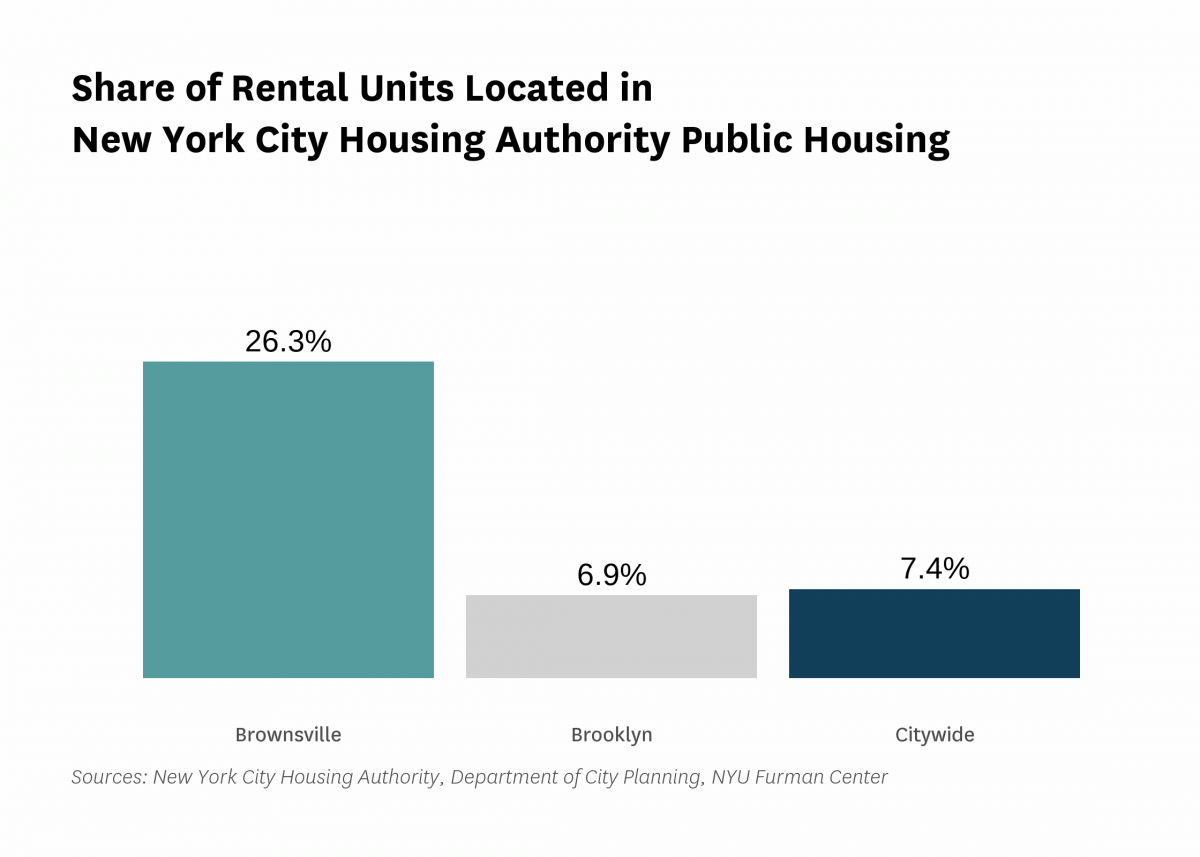
| Public housing (% of rental units) | 26.3% | |||||


Data Notes: See Indicator Definitions, Rankings, and Methods for more information.
Indicators: The rental vacancy rate, severe crowding rate, and the severely rent-burdened households indicators use five-year American Community Survey (ACS) estimates. Data under the 2010 heading comes from the 2006 – 2010 ACS, data under the 2019 heading comes from the 2015 – 2019 ACS and data under the 2021 heading comes from 2017 – 2021 ACS .
All content © 2005 – 2024 Furman Center for Real Estate and Urban Policy | Top of page | Contact Us