State of the City 2019
In addition to indicator definitions, we report the five neighborhoods with the highest and lowest values for the indicator. The neighborhood with the highest value will be ranked first, even if higher values are not considered better, as with crime rates. Rankings are provided for the most recent year that data are available for each indicator. In the event of a tie, rank numbers are repeated. Where data are unavailable for a given neighborhood, we report rankings out of all neighborhoods for which the indicator can be calculated. Rankings are listed for community districts, though some indicators are reported at the sub-borough area level. See the Index of Community Districts for more information.
This indicator measures the percentage of workers who commute primarily by foot, bicycle, or public transportation, as a share of all workers over the age of 16 who do not work at home. The types of transportation included as public transportation are bus, subway, railroad, and ferry boat. To be consistent with the way commute transportation modes are tabulated in the American Community Survey (ACS), public transit rates from the 2000 Census exclude those commuting by taxi. For this indicator, “Car” refers to personal motor vehicles, including motorcycles. Respondents were asked to report the “principal” means of getting from home to work, defined as the means used most often and for the longest distance among any other means used.
Sources: U.S. Census (2000), American Community Survey (2006, 2010, 2018), NYU Furman Center
Geography: City, Borough, Sub-borough Area
| 2018-2019 Rank | CD # | Name | Value |
|---|---|---|---|
| Highest | |||
| 1 | MN 11 | East Harlem | 91.6% |
| 2 | MN 09 | Morningside Heights/Hamilton Heights | 91.0% |
| 3 | MN 01, 02 | Greenwich Village/Financial District | 90.9% |
| 4 | MN 04, 05 | Chelsea/Clinton/Midtown | 89.6% |
| 5 | MN 06 | Stuyvesant Town/Turtle Bay | 89.1% |
| Lowest | |||
| 51 | SI 01 | North Shore | 42.5% |
| 52 | QN 13 | Queens Village | 39.4% |
| 53 | QN 11 | Bayside/Little Neck | 36.9% |
| 54 | SI 02 | Mid-Island | 32.6% |
| 55 | SI 03 | South Shore | 25.1% |
This indicator measures the share of the population that is foreign-born. Foreign-born includes all those born outside the United States or Puerto Rico, regardless of whether they currently are United States citizens. Children born abroad to parents who are U.S. citizens are not counted as foreign born.
Sources: U.S. Census (2000), American Community Survey (2006, 2010, 2018), NYU Furman Center
Geography: City, Borough, Sub-borough Area
| 2018-2019 Rank | CD # | Name | Value |
|---|---|---|---|
| Highest | |||
| 1 | QN 04 | Elmhurst/Corona | 64.2% |
| 2 | QN 03 | Jackson Heights | 59.9% |
| 3 | QN 07 | Flushing/Whitestone | 56.8% |
| 4 | BK 13 | Coney Island | 55.0% |
| 5 | QN 02 | Sunnyside/Woodside | 54.7% |
| Lowest | |||
| 51 | BK 01 | Williamsburg/Greenpoint | 20.0% |
| 52 | BK 03 | Bedford Stuyvesant | 19.5% |
| 53 | BK 02 | Brooklyn Heights/Fort Greene | 18.7% |
| 54 | SI 03 | South Shore | 17.8% |
| 55 | BK 06 | Park Slope/Carroll Gardens | 17.2% |
This indicator measures the home purchase loan rate by dividing the number of first-lien home purchase loan originations for owner-occupied one- to four-family buildings, condominiums, or cooperative apartments by the total number of one- to four-family buildings, condominiums, and cooperative apartments in the given geography and then multiplying by 1,000 to establish a rate. This year we have made minor changes to the classification of property types used in the denominator of this indicator, so the values for this indicator differ slightly from what we have published previously. For more information on Home Mortgage Disclosure Act data, please refer to the Methods section of this report.
Sources: Home Mortgage Disclosure Act, New York City Department of Finance Final Tax Roll File, NYU Furman Center
Geography: City, Borough, Sub-borough Area
| 2018-2019 Rank | CD # | Name | Value |
|---|---|---|---|
| Highest | |||
| 1 | SI 03 | South Shore | 33.6 |
| 2 | BK 06 | Park Slope/Carroll Gardens | 32.0 |
| 3 | BK 08 | North Crown Heights/Prospect Heights | 30.5 |
| 4 | SI 02 | Mid-Island | 29.8 |
| 5 | BK 02 | Brooklyn Heights/Fort Greene | 27.8 |
| Lowest | |||
| 51 | BX 01, 02 | Mott Haven/Hunts Point | 12.4 |
| 52 | BX 09 | Soundview/Parkchester | 12.3 |
| 53 | BX 03, 06 | Morrisania/Belmont | 9.7 |
| 54 | MN 11 | East Harlem | 8.9 |
| 54 | BX 04 | Highbridge/South Concourse | 8.9 |
This indicator measures the number of owner-occupied units divided by the total number of occupied housing units.
Sources: U.S. Census (2000), American Community Survey (2006, 2010, 2018), NYU Furman Center
Geography: City, Borough, Sub-borough Area
| 2018-2019 Rank | CD # | Name | Value |
|---|---|---|---|
| Highest | |||
| 1 | SI 03 | South Shore | 82.1% |
| 2 | QN 13 | Queens Village | 76.2% |
| 3 | SI 02 | Mid-Island | 71.5% |
| 4 | QN 10 | South Ozone Park/Howard Beach | 68.6% |
| 5 | QN 11 | Bayside/Little Neck | 67.5% |
| Lowest | |||
| 51 | MN 11 | East Harlem | 7.6% |
| 52 | BX 07 | Kingsbridge Heights/Mosholu | 7.0% |
| 53 | BX 03, 06 | Morrisania/Belmont | 5.4% |
| 54 | BX 04 | Highbridge/South Concourse | 4.9% |
| 55 | BX 05 | University Heights/Fordham | 3.4% |
This indicator measures the percentage of households with children under 18 present.
Sources: U.S. Census (2000), American Community Survey (2006, 2010, 2018), NYU Furman Center
Geography: City, Borough, Sub-borough Area
| 2018-2019 Rank | CD # | Name | Value |
|---|---|---|---|
| Highest | |||
| 1 | BX 05 | University Heights/Fordham | 42.2% |
| 2 | BK 12 | Borough Park | 40.5% |
| 3 | BX 03, 06 | Morrisania/Belmont | 39.7% |
| 4 | BX 07 | Kingsbridge Heights/Mosholu | 39.3% |
| 5 | BX 01, 02 | Mott Haven/Hunts Point | 38.7% |
| Lowest | |||
| 51 | MN 01, 02 | Greenwich Village/Financial District | 17.0% |
| 52 | MN 08 | Upper East Side | 16.0% |
| 53 | MN 03 | Lower East Side/Chinatown | 12.6% |
| 54 | MN 04, 05 | Chelsea/Clinton/Midtown | 11.5% |
| 55 | MN 06 | Stuyvesant Town/Turtle Bay | 10.1% |
This indicator measures the share of households with household income in one of six brackets: less than $20,000; $20,000-39,999; $40,000-59,999; $60,000-99,999; $100,000- 249,999; and $250,000 or more. Household income is the total income of all members of a household aged 15 years or older. All figures have been adjusted to 2019 dollars. We report data from five-year American Community Survey estimates at the borough and sub-borough levels.
The U.S. Census Bureau advises against comparisons of income data between the decennial census and the American Community Survey (ACS) due to differences in question construction and sampling, and so we urge caution when comparing this indicator over time, particularly at the neighborhood level. For more information on comparisons across years and across U.S. Census Bureau products, please refer to the Methods section of this report.
Sources: IPUMS-USA, University of Minnesota, NYU Furman Center
Geography: City, Borough, Sub-borough Area
This indicator measures the share of all rental households in privately owned units whose occupants use a housing choice voucher from the U.S. Department of Housing and Urban Development. Because tenants cannot use their vouchers to rent units in public housing, we report this indicator as a percentage of occupied, privately owned rental units. The denominator consists of occupied rental housing units (that is, rental households) from the American Community Survey (ACS) minus the total number of public housing units. For more information about the calculation of this indicator, see the “Housing Choice Vouchers” section of the Methods section. Due to inconsistencies in data collection and reporting before 2009 from the Picture of Subsidized Households, the source of housing choice voucher data, we do not present this indicator before 2009.
Sources: Picture of Subsidized Households, American Community Survey, New York City Housing Authority, NYU Furman Center
Geography: City, Borough, Sub-borough Area
| 2018-2019 Rank | CD # | Name | Value |
|---|---|---|---|
| Highest | |||
| 1 | QN 14 | Rockaways | 20.4% |
| 2 | BX 03, 06 | Morrisania/Belmont | 18.7% |
| 2 | BX 05 | University Heights/Fordham | 18.7% |
| 2 | BK 13 | Coney Island | 18.7% |
| 5 | BX 01, 02 | Mott Haven/Hunts Point | 17.3% |
| Lowest | |||
| 50 | MN 01, 02 | Greenwich Village/Financial District | 0.7% |
| 50 | QN 08 | Hillcrest/Fresh Meadows | 0.7% |
| 52 | QN 02 | Sunnyside/Woodside | 0.6% |
| 53 | QN 01 | Astoria | 0.5% |
| 53 | QN 07 | Flushing/Whitestone | 0.5% |
| 55 | QN 11 | Bayside/Little Neck | 0.0% |
This indicator measures income diversity by dividing the income earned by the 80th percentile household by the income earned by the 20th percentile household, excluding all households without positive income. For example, if the 80th percentile income is $75,000 and the 20th percentile income is $15,000, then the income diversity ratio is 5.0. A higher ratio indicates a broader spread of incomes. The income diversity ratio does not measure the distribution of income. To give a better sense of the distribution, each page also includes a chart showing the percentage of households in a given geographic area that fall into each of several income categories. The percentages in the charts may not add up to 100 percent because of rounding.
Sources: IPUMS-USA, University of Minnesota, NYU Furman Center
Geography: City, Borough, Sub-borough Area
| 2018-2019 Rank | CD # | Name | Value |
|---|---|---|---|
| Highest | |||
| 1 | MN 04, 05 | Chelsea/Clinton/Midtown | 9.7 |
| 2 | MN 03 | Lower East Side/Chinatown | 9.2 |
| 3 | MN 07 | Upper West Side | 8.8 |
| 4 | MN 10 | Central Harlem | 8.6 |
| 5 | BK 01 | Williamsburg/Greenpoint | 8.1 |
| Lowest | |||
| 50 | QN 12 | Jamaica | 4.1 |
| 50 | SI 02 | Mid-Island | 4.1 |
| 52 | BK 17 | East Flatbush | 3.9 |
| 53 | QN 04 | Elmhurst/Corona | 3.8 |
| 53 | QN 13 | Queens Village | 3.8 |
| 55 | QN 11 | Bayside/Little Neck | 3.6 |
This indicator measures the mean commute time in minutes for commuters residing in the geographic area. The mean is calculated by dividing the aggregate commute time in minutes for each area by the number of workers 16 years old and older who did not work from home.
Sources: U.S. Census (2000), American Community Survey (2006, 2010, 2018), NYU Furman Center
Geography: City, Borough, Sub-borough Area
| 2018-2019 Rank | CD # | Name | Value |
|---|---|---|---|
| Highest | |||
| 1 | BK 15 | Sheepshead Bay/Gravesend | 50.4 |
| 2 | QN 14 | Rockaways | 50.2 |
| 3 | BK 18 | Flatlands/Canarsie | 50.0 |
| 4 | BK 17 | East Flatbush | 49.5 |
| 5 | QN 13 | Queens Village | 49.3 |
| Lowest | |||
| 51 | MN 03 | Lower East Side/Chinatown | 31.1 |
| 52 | MN 08 | Upper East Side | 30.8 |
| 53 | MN 06 | Stuyvesant Town/Turtle Bay | 28.9 |
| 54 | MN 04, 05 | Chelsea/Clinton/Midtown | 26.3 |
| 55 | MN 01, 02 | Greenwich Village/Financial District | 25.3 |
Household income is the total income of all members of a household aged 15 years or older. All figures have been adjusted to 2019 dollars. The U.S. Census Bureau advises against comparing income data between the decennial census and the American Community Survey (ACS) due to differences in question construction and sampling, so we urge caution when comparing this indicator over time, particularly at the neighborhood level. For more information on comparisons across years and across U.S. Census Bureau products, please refer to the Methods section of this report.
Sources: U.S. Census (2000), American Community Survey (2006, 2010, 2018), NYU Furman Center
Geography: National, City, Borough, Sub-borough Area
| 2018-2019 Rank | CD # | Name | Value |
|---|---|---|---|
| Highest | |||
| 1 | MN 01, 02 | Greenwich Village/Financial District | $150,600 |
| 2 | MN 06 | Stuyvesant Town/Turtle Bay | $137,130 |
| 3 | BK 06 | Park Slope/Carroll Gardens | $124,670 |
| 4 | MN 07 | Upper West Side | $123,840 |
| 5 | MN 08 | Upper East Side | $123,710 |
| Lowest | |||
| 51 | MN 11 | East Harlem | $33,090 |
| 52 | BK 16 | Brownsville/Ocean Hill | $32,980 |
| 53 | BX 05 | University Heights/Fordham | $30,970 |
| 54 | BX 03, 06 | Morrisania/Belmont | $26,910 |
| 55 | BX 01, 02 | Mott Haven/Hunts Point | $26,150 |
The monthly rent we report is gross rent, which includes two components: the amount agreed to or specified in the lease regardless of whether furnishings, utilities, or services are included; and the estimated monthly electricity and heating fuel costs paid by the renter. Because the pre-compiled summary tables from the American Community Survey (ACS) do not report estimates for median gross rent when the median is above $2,000, medians above that level come from the Public Use Microdata Sample of the ACS. Although the U.S. Census Bureau advises that rent estimates from the 2000 decennial census are not generally comparable to rent estimates from the ACS, the incompatibility stems from the ways in which rents for properties with large areas of undeveloped land were calculated; because New York City has very few such properties, we report 2000 estimates for median rent but advise some caution in comparing those figures to later years. For more information on comparisons across years, please refer to the Methods section of this report.
Sources: U.S. Census (2000), American Community Survey (2006, 2010, 2018), NYU Furman Center
Geography: City, Borough, Sub-borough Area
| 2018-2019 Rank | CD # | Name | Value |
|---|---|---|---|
| Highest | |||
| 1 | MN 01, 02 | Greenwich Village/Financial District | $2,690 |
| 2 | MN 06 | Stuyvesant Town/Turtle Bay | $2,490 |
| 3 | MN 08 | Upper East Side | $2,340 |
| 4 | MN 07 | Upper West Side | $2,270 |
| 5 | BK 02 | Brooklyn Heights/Fort Greene | $2,150 |
| 5 | BK 06 | Park Slope/Carroll Gardens | $2,150 |
| Lowest | |||
| 51 | BK 13 | Coney Island | $1,140 |
| 52 | BX 03, 06 | Morrisania/Belmont | $1,060 |
| 53 | MN 11 | East Harlem | $1,040 |
| 54 | BK 16 | Brownsville/Ocean Hill | $990 |
| 55 | BX 01, 02 | Mott Haven/Hunts Point | $940 |
As with the above indicator Median Rent, All, this indicator reports the monthly gross rent, but we restrict to only households in which every household member moved into the unit within the previous 12 months (prior to the date of their ACS interview, which could have happened at any time during the calendar year). By restricting to these recent mover households this measure of median rents should more closely reflect the rents that a household would face when moving into a rental unit, because it excludes households that may have lower rents as a result of long term tenure. To allow for this sample restriction we cannot use the pre-compiled summary tables from the American Community Survey (ACS), and instead rely solely on the Public Use Microdata Sample of the ACS.
Sources: IPUMS-USA, University of Minnesota, NYU Furman Center
Geography: City, Borough, Sub-borough Area
| 2018-2019 Rank | CD # | Name | Value |
|---|---|---|---|
| Highest | |||
| 1 | MN 01, 02 | Greenwich Village/Financial District | $3,000 |
| 2 | MN 04, 05 | Chelsea/Clinton/Midtown | $2,880 |
| 3 | MN 06 | Stuyvesant Town/Turtle Bay | $2,870 |
| 4 | BK 02 | Brooklyn Heights/Fort Greene | $2,760 |
| 5 | BK 01 | Williamsburg/Greenpoint | $2,660 |
| Lowest | |||
| 50 | BX 04 | Highbridge/South Concourse | $1,310 |
| 50 | BX 05 | University Heights/Fordham | $1,310 |
| 52 | BK 05 | East New York/Starrett City | $1,270 |
| 53 | BK 16 | Brownsville/Ocean Hill | $1,250 |
| 54 | BX 03, 06 | Morrisania/Belmont | $1,210 |
| 55 | BX 01, 02 | Mott Haven/Hunts Point | $1,010 |
This indicator measures the number of mortgage foreclosure actions initiated per 1,000 one- to four unit properties and condominium units. For this indicator, we report the number of one- to four-family properties and condominium units that have received a mortgage-related lis pendens in the given calendar year per 1,000 one- to four-family properties and condominium units. Cooperative apartments are not included in this rate. If a property received multiple lis pendens within 90 days of each other, only the first lis pendens is counted here. This year we have made minor changes to the classification of property types used in the denominator of this indicator, so the values for this indicator differ slightly from what we have published previously. For a more detailed description of our lis pendens methodology, please refer to the Methods section of this report.
Sources: Public Data Corporation, New York City Department of Finance Final Tax Roll File, NYU Furman Center
Geography: City, Borough, Community District
| 2018-2019 Rank | CD # | Name | Value |
|---|---|---|---|
| Highest | |||
| 1 | BX 04 | Highbridge/Concourse | 29.3 |
| 2 | BK 16 | Brownsville | 26.9 |
| 3 | QN 12 | Jamaica/Hollis | 23.7 |
| 4 | BK 05 | East New York/Starrett City | 22.2 |
| 5 | BX 02 | Hunts Point/Longwood | 21.4 |
| Lowest | |||
| 54 | MN 05 | Midtown | 1.6 |
| 54 | MN 08 | Upper East Side | 1.6 |
| 56 | MN 01 | Financial District | 1.5 |
| 57 | MN 02 | Greenwich Village/Soho | 1.2 |
| 58 | MN 03 | Lower East Side/Chinatown | 0.9 |
| 59 | MN 12 | Washington Heights/Inwood | 0.7 |
The U.S. Census Bureau defines population as all people, both children and adults, living in a given geographic area.
Sources: U.S. Census (2000), American Community Survey (2006, 2010, 2018), NYU Furman Center
Geography: City, Borough, Sub-borough Area
This indicator measures the population aged 25 and older who have attained at least a bachelor’s degree, including those with a master’s, professional or doctoral degree, as a percentage of the entire population in a given geographic area.
Sources: U.S. Census (2000), American Community Survey (2006, 2010, 2018), NYU Furman Center
Geography: City, Borough, Sub-borough Area
| 2018-2019 Rank | CD # | Name | Value |
|---|---|---|---|
| Highest | |||
| 1 | MN 01, 02 | Greenwich Village/Financial District | 83.1% |
| 2 | MN 06 | Stuyvesant Town/Turtle Bay | 81.8% |
| 3 | MN 08 | Upper East Side | 79.2% |
| 4 | MN 07 | Upper West Side | 78.6% |
| 5 | MN 04, 05 | Chelsea/Clinton/Midtown | 73.3% |
| Lowest | |||
| 51 | BK 16 | Brownsville/Ocean Hill | 15.1% |
| 52 | BX 04 | Highbridge/South Concourse | 14.7% |
| 53 | BX 03, 06 | Morrisania/Belmont | 14.5% |
| 54 | BX 01, 02 | Mott Haven/Hunts Point | 12.5% |
| 55 | BX 05 | University Heights/Fordham | 11.7% |
This indicator measures the population aged 25 and older who have not graduated from high school and have not received a GED, as a percentage of the entire population in a given geographic area.
Sources: U.S. Census (2000), American Community Survey (2006, 2010, 2018), NYU Furman Center
Geography: City, Borough, Sub-borough Area
| 2018-2019 Rank | CD # | Name | Value |
|---|---|---|---|
| Highest | |||
| 1 | BX 05 | University Heights/Fordham | 36.8% |
| 2 | BX 01, 02 | Mott Haven/Hunts Point | 33.7% |
| 3 | BK 07 | Sunset Park | 32.5% |
| 4 | BX 03, 06 | Morrisania/Belmont | 31.8% |
| 5 | BX 04 | Highbridge/South Concourse | 31.7% |
| Lowest | |||
| 51 | MN 07 | Upper West Side | 5.8% |
| 52 | MN 01, 02 | Greenwich Village/Financial District | 4.9% |
| 53 | MN 04, 05 | Chelsea/Clinton/Midtown | 4.8% |
| 54 | MN 06 | Stuyvesant Town/Turtle Bay | 2.7% |
| 55 | MN 08 | Upper East Side | 2.0% |
This indicator measures residents who are aged 65 years and older as a percentage of the entire population in a given geographic area.
Sources: U.S. Census (2000), American Community Survey (2006, 2010, 2018), NYU Furman Center
Geography: City, Borough, Sub-borough Area
| 2018-2019 Rank | CD # | Name | Value |
|---|---|---|---|
| Highest | |||
| 1 | BK 13 | Coney Island | 26.2% |
| 2 | QN 06 | Rego Park/Forest Hills | 23.0% |
| 3 | MN 07 | Upper West Side | 22.0% |
| 4 | MN 08 | Upper East Side | 21.5% |
| 5 | QN 07 | Flushing/Whitestone | 21.4% |
| Lowest | |||
| 51 | BK 03 | Bedford Stuyvesant | 9.9% |
| 52 | BK 01 | Williamsburg/Greenpoint | 9.4% |
| 53 | BX 01, 02 | Mott Haven/Hunts Point | 9.0% |
| 54 | BK 04 | Bushwick | 8.9% |
| 55 | BX 05 | University Heights/Fordham | 8.2% |
Population density is calculated by dividing a geographic area’s population by its land area and is reported in thousands of people per square mile. The U.S. Census Bureau advises that American Community Survey (ACS) population estimates should be compared with caution across years. For more information on comparisons across years, please refer to the Methods section of this report.
Sources: U.S. Census (2000), American Community Survey (2006, 2010, 2018), NYU Furman Center
Geography: City, Borough, Sub-borough Area
| 2018-2019 Rank | CD # | Name | Value |
|---|---|---|---|
| Highest | |||
| 1 | MN 08 | Upper East Side | 102.8 |
| 2 | MN 10 | Central Harlem | 102.3 |
| 3 | BX 05 | University Heights/Fordham | 92.5 |
| 4 | MN 03 | Lower East Side/Chinatown | 89.1 |
| 5 | MN 06 | Stuyvesant Town/Turtle Bay | 88.6 |
| Lowest | |||
| 51 | QN 11 | Bayside/Little Neck | 12.4 |
| 52 | QN 14 | Rockaways | 11.3 |
| 53 | QN 13 | Queens Village | 9.5 |
| 54 | SI 03 | South Shore | 8.0 |
| 55 | SI 02 | Mid-Island | 5.9 |
This indicator measures the number of people below the poverty threshold divided by the number of people for whom poverty status was determined. Poverty status is determined by the U.S. Census Bureau based on household size, composition, the number of children under 18 years of age, and individual or family income. The U.S. Census Bureau advises that American Community Survey (ACS) poverty data should be compared with caution across years. For more information on comparisons across years, please refer to the Methods section of this report.
Sources: U.S. Census (2000), American Community Survey (2006, 2010, 2018), NYU Furman Center
Geography: City, Borough, Sub-borough Area
| 2018-2019 Rank | CD # | Name | Value |
|---|---|---|---|
| Highest | |||
| 1 | BX 01, 02 | Mott Haven/Hunts Point | 37.7% |
| 1 | BX 03, 06 | Morrisania/Belmont | 37.7% |
| 3 | BX 05 | University Heights/Fordham | 36.4% |
| 4 | BX 04 | Highbridge/South Concourse | 32.4% |
| 5 | MN 11 | East Harlem | 31.1% |
| Lowest | |||
| 51 | SI 03 | South Shore | 7.4% |
| 52 | QN 13 | Queens Village | 7.1% |
| 53 | MN 01, 02 | Greenwich Village/Financial District | 6.6% |
| 54 | QN 11 | Bayside/Little Neck | 6.1% |
| 55 | MN 08 | Upper East Side | 5.4% |
This indicator measures the number of public housing units divided by the number of renter occupied housing units. Counts of public housing units are calculated from building-level data files provided by the New York City Housing Authority (NYCHA). The number of renter occupied housing units are derived from American Community Survey (ACS) estimates.
Sources: New York City Housing Authority, American Community Survey (2018), NYU Furman Center
Geography: City, Borough, Sub-borough Area
| 2018-2019 Rank | CD # | Name | Value |
|---|---|---|---|
| Highest | |||
| 1 | MN 11 | East Harlem | 33.7% |
| 2 | BX 01, 02 | Mott Haven/Hunts Point | 23.3% |
| 3 | BK 16 | Brownsville/Ocean Hill | 23.2% |
| 4 | MN 03 | Lower East Side/Chinatown | 22.6% |
| 5 | BK 13 | Coney Island | 17.8% |
| Lowest | |||
| 42 | MN 01, 02 | Greenwich Village/Financial District | 0.0% |
| 42 | BK 07 | Sunset Park | 0.0% |
| 42 | BK 10 | Bay Ridge | 0.0% |
| 42 | BK 11 | Bensonhurst | 0.0% |
| 42 | BK 12 | Borough Park | 0.0% |
| 42 | BK 14 | Flatbush | 0.0% |
| 42 | QN 02 | Sunnyside/Woodside | 0.0% |
| 42 | QN 03 | Jackson Heights | 0.0% |
| 42 | QN 04 | Elmhurst/Corona | 0.0% |
| 42 | QN 05 | Middle Village/Ridgewood | 0.0% |
| 42 | QN 06 | Rego Park/Forest Hills | 0.0% |
| 42 | QN 09 | Ozone Park/Woodhaven | 0.0% |
| 42 | QN 11 | Bayside/Little Neck | 0.0% |
| 42 | SI 03 | South Shore | 0.0% |
The Racial Diversity Index (RDI) measures the probability that two randomly chosen people in a given geographic area will be of a different race. The NYU Furman Center uses the categories of Asian (non-Hispanic), Black (non-Hispanic), Hispanic (of any race), and white (non-Hispanic) to calculate the index. People identifying as some other race or reporting more than one race are excluded from this calculation. Nonetheless, the groups we focus on accounted for 96.8 percent of New York City’s population in 2018. The RDI is calculated using the following formula:
RDI = 1 – (P2 Asian + P2 Black + P2 Hispanic + P2 white)
A higher number indicates a more racially diverse population. For instance, if an area is inhabited by a single racial/ethnic group, its RDI would be zero. If the population of a neighborhood is evenly distributed among the four groups (25% of residents are Asian, 25% Black, 25% Hispanic, and 25% white), its RDI would be 0.75. In practice, in neighborhoods with a large share of residents who do not fall into any of the four groups, the RDI may be slightly greater than 0.75.
Sources: U.S. Census (2000), American Community Survey (2006, 2010, 2018), NYU Furman Center
Geography: City, Borough, Sub-borough Area
| 2018-2019 Rank | CD # | Name | Value |
|---|---|---|---|
| Highest | |||
| 1 | QN 10 | South Ozone Park/Howard Beach | 0.81 |
| 2 | QN 08 | Hillcrest/Fresh Meadows | 0.74 |
| 3 | MN 03 | Lower East Side/Chinatown | 0.73 |
| 4 | QN 09 | Ozone Park/Woodhaven | 0.72 |
| 4 | SI 01 | North Shore | 0.72 |
| Lowest | |||
| 49 | BX 05 | University Heights/Fordham | 0.44 |
| 49 | BX 07 | Kingsbridge Heights/Mosholu | 0.44 |
| 49 | BK 16 | Brownsville/Ocean Hill | 0.44 |
| 52 | BK 12 | Borough Park | 0.43 |
| 53 | MN 08 | Upper East Side | 0.41 |
| 54 | SI 03 | South Shore | 0.33 |
| 55 | BK 17 | East Flatbush | 0.25 |
This indicator measures the percentage of the total population made up of each of the following racial/ethnic groups: Asian (non-Hispanic), Black (non-Hispanic), Hispanic (of any race), and white (non-Hispanic). The percentages of the four groups may not add up to 100 because people of other races or two or more races are not displayed.
Sources: U.S. Census (2000), American Community Survey (2018), NYU Furman Center
Geography: City, Borough, Sub-borough Area
Recently available units are defined as affordable to a household if its gross rent (rent plus electricity and heating fuel costs; see median rent definition) is less than 30 percent of the household’s gross monthly income. In order to represent the experiences of households with different incomes, we report shares of rental units affordable at 30 percent (the “extremely low-income” limit), 50 percent (the “very low-income” limit), 80 percent (the “low-income” limit), and 120 percent (the “moderate-income” limit) of the area median income (AMI) as defined by the U.S. Department of Housing and Urban Development’s Section 8 and HOME program guidelines. For units without bedrooms (studios), we determine affordability based on one-person income limits; one-bedroom units use two-person income limits; two-bedroom units use three-person income limits; and units with three or more bedrooms use four-person income limits.
Sources: IPUMS-USA, University of Minnesota, U.S. Department of Housing and Urban Development, NYU Furman Center
Geography: City, Borough, Sub-borough Area
| 2018-2019 Rank | CD # | Name | Value |
|---|---|---|---|
| Highest | |||
| 1 | BX 03, 06 | Morrisania/Belmont | 93.7% |
| 2 | BX 01, 02 | Mott Haven/Hunts Point | 92.0% |
| 3 | BX 07 | Kingsbridge Heights/Mosholu | 91.1% |
| 4 | BX 05 | University Heights/Fordham | 88.6% |
| 5 | BK 05 | East New York/Starrett City | 86.0% |
| Lowest | |||
| 43 | MN 01, 02 | Greenwich Village/Financial District | 15.9% |
| 44 | BK 02 | Brooklyn Heights/Fort Greene | 15.4% |
| 45 | MN 06 | Stuyvesant Town/Turtle Bay | 13.9% |
| 46 | BK 06 | Park Slope/Carroll Gardens | 13.5% |
| 47 | MN 08 | Upper East Side | 8.8% |
This indicator measures habitable, for-rent rental units that are vacant as a percentage of renter-occupied units plus the vacant, habitable, for-rent units. This calculation excludes housing units in group quarters, such as hospitals, jails, mental institutions, and college dormitories, as well as units that are rented but not occupied and units that are in such poor condition that they are not habitable. We report data from five-year American Community Survey (ACS) estimates at the sub-borough level.
Sources: U.S. Census (2000), American Community Survey (2006-2010, 2014-2018), NYU Furman Center
Geography: City, Borough, Sub-borough Area
| 2018-2019 Rank | CD # | Name | Value |
|---|---|---|---|
| Highest | |||
| 1 | SI 01 | North Shore | 8.4% |
| 2 | MN 06 | Stuyvesant Town/Turtle Bay | 7.1% |
| 3 | MN 04, 05 | Chelsea/Clinton/Midtown | 6.6% |
| 4 | BK 10 | Bay Ridge | 6.5% |
| 5 | SI 03 | South Shore | 6.1% |
| Lowest | |||
| 51 | BK 13 | Coney Island | 1.7% |
| 52 | MN 12 | Washington Heights/Inwood | 1.6% |
| 52 | BX 01, 02 | Mott Haven/Hunts Point | 1.6% |
| 54 | BX 10 | Throgs Neck/Co-op City | 1.3% |
| 54 | QN 04 | Elmhurst/Corona | 1.3% |
The New York City Police Department (NYPD) collects data on criminal complaints, which the department reports consistent with classifications set primarily by the New York State Penal Law. A crime is considered serious if it is classified as a major felony as defined by the NYPD. This category contains most types of assault, burglary, larceny, motor vehicle theft, murder (including non-negligent manslaughter), rape, and robbery. Serious property crimes include most types of burglary, larceny, and motor vehicle theft. Serious violent crime includes most types of assault, murder (including non-negligent manslaughter), rape, and robbery. Rates are calculated as the number of crimes committed in a given geographic area per 1,000 residents (based on decennial population counts) and it is possible that perpetrators or victims of crimes may reside in other neighborhoods or outside of New York City. For data from 2006 and later, we use NYC Open Data. For years prior to 2006, we use NYPD data. Because precise geographic information is not available for rape and sex crime offenses, we exclude these crimes from the rate calculation at the community district level.
Sources: New York City Police Department, U.S. Census, NYU Furman Center
Geography: City, Borough, Community District
| 2018-2019 Rank | CD # | Name | Value |
|---|---|---|---|
| Highest | |||
| 1 | MN 05 | Midtown | 90.9 |
| 2 | MN 02 | Greenwich Village/Soho | 26.7 |
| 3 | BX 01 | Mott Haven/Melrose | 24.0 |
| 4 | MN 04 | Clinton/Chelsea | 23.5 |
| 5 | BK 02 | Fort Greene/Brooklyn Heights | 20.9 |
| Lowest | |||
| 55 | BK 12 | Borough Park | 4.6 |
| 55 | QN 09 | Kew Gardens/Woodhaven | 4.6 |
| 57 | QN 06 | Rego Park/Forest Hills | 4.4 |
| 57 | SI 02 | South Beach/Willowbrook | 4.4 |
| 59 | SI 03 | Tottenville/Great Kills | 2.7 |
The New York City Department of Housing Preservation and Development (HPD) investigates housing code complaints from tenants in privately owned units and issues code violations if housing inspections reveal problems. Serious housing code violations are coded as class C (“immediately hazardous”). These numbers include all violations that HPD opened in a given time period, regardless of their current status. The New York City Housing Authority has a parallel process for recording and inspecting housing violations within public housing. Their violations are not included in this indicator, so we exclude public housing units from the denominator. For data from 2012 and later, we use NYC Open Data. For years prior to 2012, we use HPD data. The base data for this file is all violations open as of October 1, 2012. All violations issued since that date have been added to the file and the current status of the violation is provided. The file is updated daily with status changes and newly issued violations. An open violation is a violation which is still active on the Department records. In 2019 some violation types relating to pests were reclassified from B to C class resulting in a shift in the number of violations from B to C.
Sources: New York City Department of Housing Preservation and Development, New York City Department of Finance Final Tax Roll File, New York City Housing Authority, NYU Furman Center
Geography: City, Borough, Community District
| 2018-2019 Rank | CD # | Name | Value |
|---|---|---|---|
| Highest | |||
| 1 | BX 05 | Fordham/University Heights | 219.4 |
| 2 | BX 04 | Highbridge/Concourse | 214.2 |
| 3 | BX 06 | Belmont/East Tremont | 188.1 |
| 4 | BK 17 | East Flatbush | 187.8 |
| 5 | MN 12 | Washington Heights/Inwood | 180.8 |
| Lowest | |||
| 55 | MN 06 | Stuyvesant Town/Turtle Bay | 11.2 |
| 56 | MN 05 | Midtown | 10.9 |
| 57 | QN 11 | Bayside/Little Neck | 7.0 |
| 58 | MN 01 | Financial District | 4.9 |
| 59 | SI 03 | Tottenville/Great Kills | 4.4 |
A severely crowded household is defined as one in which there are more than 1.5 household members for each room (excluding bathrooms) in the unit. We present the indicator as a share of all renter households. For the 2009 American Community Survey (ACS), the Census Bureau substantially changed its survey question and processing pertaining to the number of rooms in a housing unit. These changes prevent comparison with earlier years. Due to small sample sizes, we report the 2006-2010 and 2014-2018 five-year estimates from the ACS for sub-borough areas.
Sources: American Community Survey, NYU Furman Center
Geography: City, Borough, Sub-borough Area
| 2018-2019 Rank | CD # | Name | Value |
|---|---|---|---|
| Highest | |||
| 1 | QN 04 | Elmhurst/Corona | 12.6% |
| 2 | BK 12 | Borough Park | 9.9% |
| 3 | QN 03 | Jackson Heights | 9.7% |
| 4 | BK 07 | Sunset Park | 9.2% |
| 5 | BX 04 | Highbridge/South Concourse | 8.6% |
| Lowest | |||
| 51 | MN 10 | Central Harlem | 2.1% |
| 52 | QN 13 | Queens Village | 2.0% |
| 53 | BX 10 | Throgs Neck/Co-op City | 1.9% |
| 54 | BK 16 | Brownsville/Ocean Hill | 1.7% |
| 55 | SI 03 | South Shore | 1.6% |
This indicator measures the share of renter households whose gross rent (rent plus electricity and heating fuel costs; see median rent definition) equaled at least 50 percent of their income. These households are classified as severely rent burdened. Low-income households have incomes at or below 80 percent of the area median income as defined by the U.S. Department of Housing and Urban Development’s Section 8 and HOME program guidelines. Comparisons between the overall rate of severe rent burden and the rate of severe rent burden among low-income renters should be made with caution as the data sources differ slightly. The overall rate comes from pre-compiled summary tables of the 2000 decennial census and the American Community Survey (ACS) 5-year estimates while the rate among moderate- income renters is calculated from the Public Use Microdata Sample. Subsidized renters may be erroneously classified as rent burdened by the ACS under certain circumstances.
Sources: U.S. Census (2000), American Community Survey (2006-2010, 2014-2018), IPUMS-USA, University of Minnesota, U.S. Department of Housing and Urban Development Section 8/HOME Program Income Guidelines, NYU Furman Center
Geography: City, Borough, Sub-borough Area
| 2018-2019 Rank | CD # | Name | Value |
|---|---|---|---|
| Highest | |||
| 1 | BK 12 | Borough Park | 44.7% |
| 2 | BX 05 | University Heights/Fordham | 41.3% |
| 3 | QN 07 | Flushing/Whitestone | 40.8% |
| 4 | BX 04 | Highbridge/South Concourse | 39.0% |
| 5 | BK 16 | Brownsville/Ocean Hill | 38.5% |
| Lowest | |||
| 51 | MN 07 | Upper West Side | 20.2% |
| 52 | BK 02 | Brooklyn Heights/Fort Greene | 19.2% |
| 53 | MN 08 | Upper East Side | 18.6% |
| 54 | MN 01, 02 | Greenwich Village/Financial District | 17.6% |
| 55 | BK 06 | Park Slope/Carroll Gardens | 17.5% |
| 2018-2019 Rank | CD # | Name | Value |
|---|---|---|---|
| Highest | |||
| 1 | MN 06 | Stuyvesant Town/Turtle Bay | 66.1% |
| 2 | MN 08 | Upper East Side | 62.0% |
| 3 | MN 01, 02 | Greenwich Village/Financial District | 57.2% |
| 4 | BK 12 | Borough Park | 57.0% |
| 5 | QN 06 | Rego Park/Forest Hills | 56.7% |
| Lowest | |||
| 51 | BK 13 | Coney Island | 37.2% |
| 52 | QN 14 | Rockaways | 35.5% |
| 53 | MN 03 | Lower East Side/Chinatown | 34.3% |
| 54 | MN 10 | Central Harlem | 33.4% |
| 55 | MN 11 | East Harlem | 28.3% |
These indicators report the percentage of fourth-grade students performing at or above grade level (termed “proficient”). The New York City Department of Education’s (DOE) Division of Performance and Accountability develops and administers city and state tests and compiles data on students’ performance on those tests. The DOE provides these data at the school level. For each community district, we aggregate the proficiency rates from each school in that community district, even if some students in that school live outside the community district. In 2013, DOE implemented new exams based on New York State’s Common Core standards. As a result, proficiency rates for those exams are not comparable to rates from exams given before 2013 and should not be compared to rates in previous years’ State of New York City’s Housing and Neighborhoods reports. For this indicator, school years are labeled according to the calendar year in which the school year ends. For example, 2019 corresponds to the 2018-2019 school year.
Sources: New York City Department of Education, NYU Furman
Geography: City, Borough, Community District
| 2018-2019 Rank | CD # | Name | Value |
|---|---|---|---|
| Highest | |||
| 1 | MN 01 | Financial District | 85.7% |
| 2 | MN 08 | Upper East Side | 84.8% |
| 3 | MN 06 | Stuyvesant Town/Turtle Bay | 84.0% |
| 4 | MN 05 | Midtown | 83.3% |
| 5 | MN 02 | Greenwich Village/Soho | 80.3% |
| Lowest | |||
| 55 | BK 04 | Bushwick | 31.4% |
| 56 | BX 06 | Belmont/East Tremont | 29.1% |
| 57 | BK 16 | Brownsville | 28.8% |
| 58 | MN 10 | Central Harlem | 28.6% |
| 59 | BX 02 | Hunts Point/Longwood | 25.2% |
| 2018-2019 Rank | CD # | Name | Value |
|---|---|---|---|
| Highest | |||
| 1 | MN 02 | Greenwich Village/Soho | 85.8% |
| 2 | MN 01 | Financial District | 84.7% |
| 3 | QN 11 | Bayside/Little Neck | 83.1% |
| 4 | MN 08 | Upper East Side | 81.3% |
| 5 | MN 05 | Midtown | 80.3% |
| Lowest | |||
| 55 | BX 03 | Morrisania/Crotona | 26.5% |
| 56 | BX 06 | Belmont/East Tremont | 25.6% |
| 57 | BK 16 | Brownsville | 25.5% |
| 58 | BX 02 | Hunts Point/Longwood | 23.4% |
| 59 | MN 10 | Central Harlem | 22.8% |
This indicator measures the number of people aged 16 years and older in the civilian labor force who are unemployed, divided by the total number of people aged 16 years and older in the civilian labor force. People are considered to be unemployed if they meet the following criteria: they have not worked during the week of the survey; they have been looking for a job during the previous four weeks; and they were available to begin work. The U.S. Census Bureau advises using caution when comparing the 2000 census unemployment rate to the American Community Survey figures because of differences in question construction and sampling.
Sources: U.S. Census (2000), American Community Survey (2006, 2010, 2018), NYU Furman Center
Geography: City, Borough, Sub-borough Area
| 2018-2019 Rank | CD # | Name | Value |
|---|---|---|---|
| Highest | |||
| 1 | BX 01, 02 | Mott Haven/Hunts Point | 14.0% |
| 2 | BX 05 | University Heights/Fordham | 13.5% |
| 3 | BX 03, 06 | Morrisania/Belmont | 13.3% |
| 4 | BX 04 | Highbridge/South Concourse | 10.5% |
| 5 | BX 07 | Kingsbridge Heights/Mosholu | 9.8% |
| Lowest | |||
| 51 | QN 11 | Bayside/Little Neck | 3.5% |
| 52 | SI 03 | South Shore | 2.8% |
| 53 | MN 06 | Stuyvesant Town/Turtle Bay | 2.7% |
| 53 | MN 08 | Upper East Side | 2.7% |
| 55 | BK 01 | Williamsburg/Greenpoint | 2.4% |
The number of units authorized by new residential building permits is derived from the building permit and job filing reports of the New York City Department of Buildings (DOB). Permit renewals are not included. Not all building permits will result in actual construction, but the number of units authorized by new permits is the best available indicator of how many units are under construction. Comparisons between years prior to 2004 and more recent years should be made with caution due to data improvements that facilitate more accurate estimates of the number of new units attached to each building permit. Specifically, the figures for 2000 may be an underestimate. As of last year, we are using the DOB Open Data for 2004 and later, so the values for this indicator differ from what we have published previously. See the Methods section for more information about the compilation of this indicator.
Sources: New York City Department of Buildings, NYU Furman Center
Geography: City, Borough, Community District
| 2018-2019 Rank | CD # | Name | Value |
|---|---|---|---|
| Highest | |||
| 1 | MN 04 | Clinton/Chelsea | 2,650 |
| 2 | BK 02 | Fort Greene/Brooklyn Heights | 2,461 |
| 3 | QN 02 | Woodside/Sunnyside | 1,739 |
| 4 | BX 01 | Mott Haven/Melrose | 1,169 |
| 5 | BX 04 | Highbridge/Concourse | 932 |
| Lowest | |||
| 54 | MN 06 | Stuyvesant Town/Turtle Bay | 58 |
| 54 | QN 11 | Bayside/Little Neck | 58 |
| 56 | QN 09 | Kew Gardens/Woodhaven | 54 |
| 57 | BK 18 | Flatlands/Canarsie | 30 |
| 58 | QN 13 | Queens Village | 28 |
| 59 | QN 10 | South Ozone Park/Howard Beach | 10 |
This indicator measures the number of residential units in buildings issued new certificates of occupancy (often called “C of Os”) issued by the New York City Department of Buildings (DOB) each year. The DOB requires a certificate before any newly constructed housing unit can be occupied. Rehabilitated housing units generally do not require certification unless the rehabilitation is significant, meaning that the floor plan of the unit is changed. While the underlying data is produced by DOB, we receive the data for this indicator from the New York City Department of City Planning (DCP).
Sources: New York City Department of City Planning, New York City Department of Building, NYU Furman Center
Geography: City, Borough, Community District
| 2018-2019 Rank | CD # | Name | Value |
|---|---|---|---|
| Highest | |||
| 1 | BK 01 | Greenpoint/Williamsburg | 1,984 |
| 2 | MN 07 | Upper West Side | 1,371 |
| 3 | BK 02 | Fort Greene/Brooklyn Heights | 1,353 |
| 4 | BK 13 | Coney Island | 1,327 |
| 5 | BK 04 | Bushwick | 1,208 |
| Lowest | |||
| 55 | QN 10 | South Ozone Park/Howard Beach | 36 |
| 56 | QN 06 | Rego Park/Forest Hills | 35 |
| 57 | BK 10 | Bay Ridge/Dyker Heights | 30 |
| 58 | QN 13 | Queens Village | 27 |
| 59 | BK 18 | Flatlands/Canarsie | 25 |
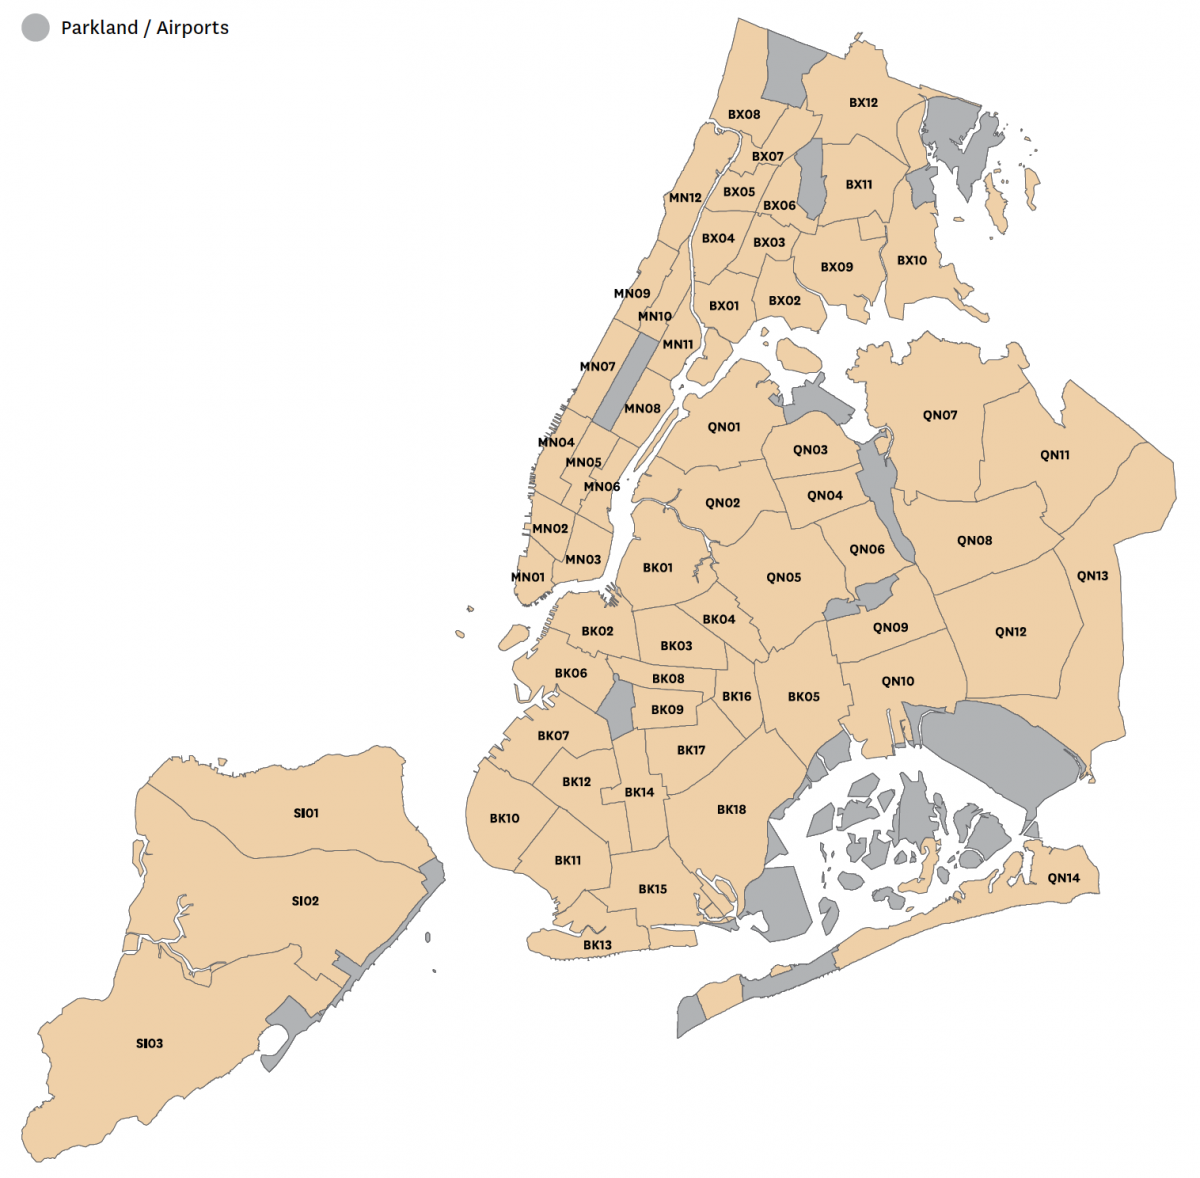
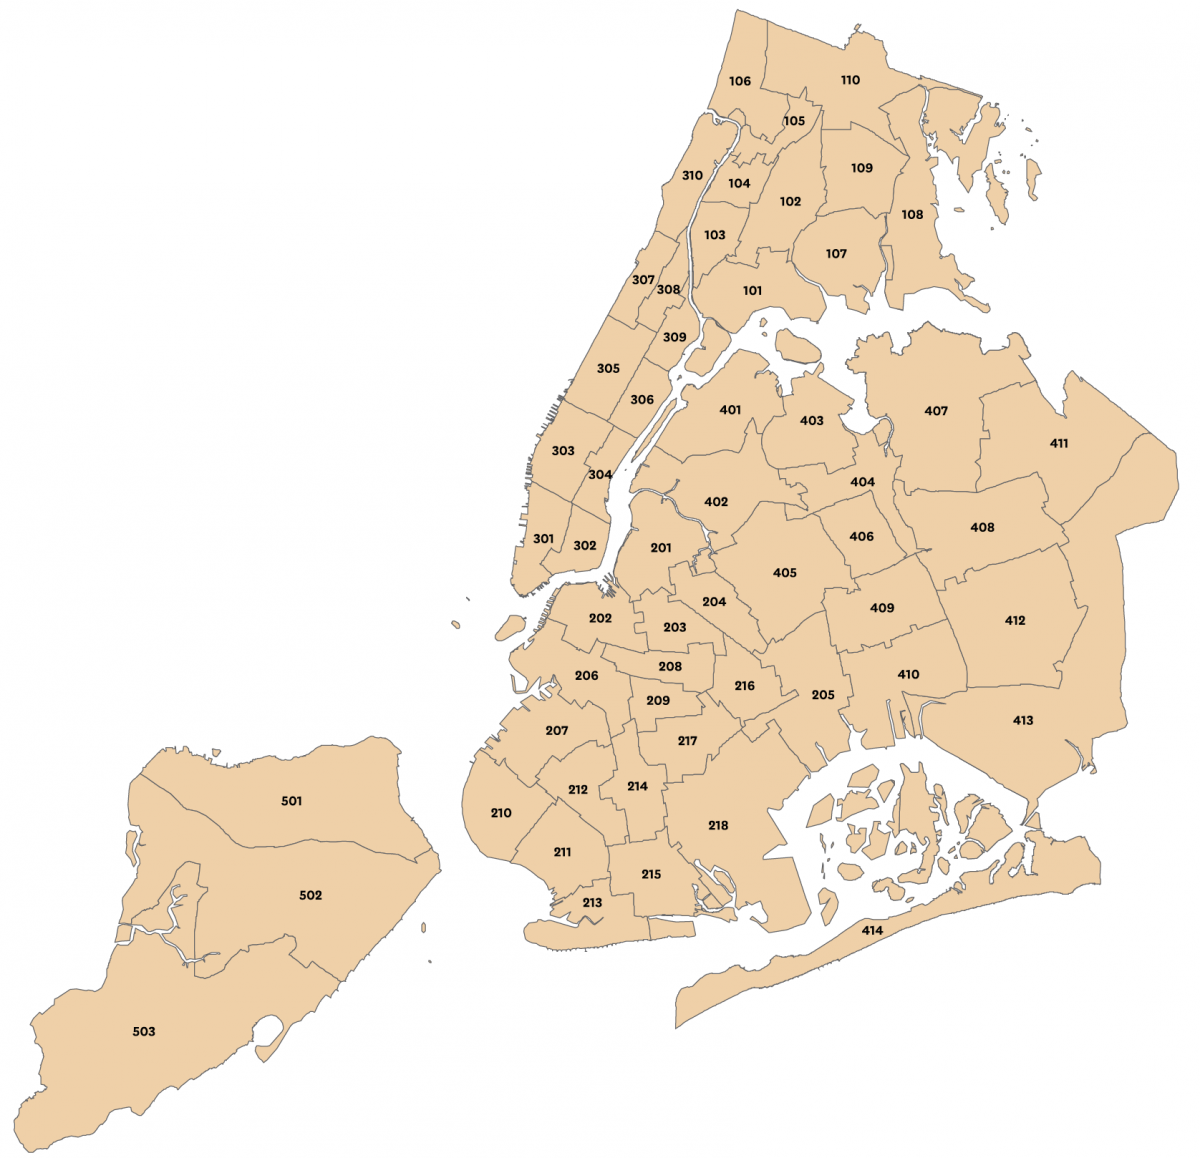
This report presents information for the entire City of New York, for each of the five boroughs, and for the neighborhoods within each borough. The city defines neighborhoods by dividing the boroughs into 59 community districts (CDs); the U.S. Census Bureau, however, divides the boroughs into 55 sub-borough areas (SBAs). SBAs are geographic units created by the U.S. Census Bureau for the administration of the New York City Housing and Vacancy Survey and were designed to have similar boundaries to those of community districts. This report provides data for community districts where available but otherwise employs data at the SBA level. The term neighborhood is used in this report to refer to both community districts and SBAs even though they are larger than what many consider to be neighborhoods. We have included reference maps for community districts and sub-borough areas following this chapter.
New York City consists of five boroughs: the Bronx, Brooklyn, Manhattan, Queens, and Staten Island. Each borough is represented by a borough president, an elected official who advises the mayor on issues related to his or her borough and, along with the borough board, makes recommendations concerning land use and the allocation of public services. Each borough is also a county. Counties are legal entities with boundaries defined by state law.
Community districts are political units unique to New York City. Each of the 59 community districts has a community board. Half of the community board’s members are appointed by the borough president and half are nominated by the City Council members who represent the district. The community boards review applications for zoning changes and other land use proposals and make recommendations for budget priorities. Each community board is assigned a number within its borough. The borough and this number uniquely identify each of the 59 community districts. Therefore, we designate each community district with a two-letter borough code and a two-digit community board code. For example, BK 02 is the community district represented by Community Board 2 in Brooklyn.
Sub-borough areas are geographic units created by the U.S. Census Bureau for the administration of the New York City Housing and Vacancy Survey and were designed to have similar boundaries to those of community districts. These same areas are also defined by the U.S. Census Bureau as Public Use Microdata Areas (PUMAs), so we are able to use the two terms interchangeably. Sub-borough areas are referred to using a three-digit number, where the first digit signifies the borough (we number boroughs in alphabetical order, with the Bronx being 1 and Staten Island being 5). There are 59 community districts in New York City but only 55 sub-borough areas. The U.S. Census Bureau combined four pairs of community districts in creating the sub-borough areas to improve sampling and protect the confidentiality of respondents. These pairs are Mott Haven/Melrose (BX 01) and Hunts Point/Longwood (BX 02) in the Bronx (combined into SBA 101), Morrisania/Crotona (BX 03) and Belmont/East Tremont (BX 06) in the Bronx (combined into SBA 102), the Financial District (MN 01) and Greenwich Village/Soho (MN 02) in Manhattan (combined into SBA 301), and Clinton/Chelsea (MN 04) and Midtown (MN 05) in Manhattan (combined into SBA 303). Because sub-borough areas are constructed from Census tracts, their boundaries do not coincide precisely with community district boundaries, which generally follow major streets. However, they are similar enough that we use them interchangeably throughout this report. The U.S. Census Bureau periodically updates its geographic boundaries for each decennial census, and so the shapes of sub-borough areas changed slightly between the 2011 and 2012 releases of the American Community Survey. Although we treat these different vintages of sub-borough areas as being consistent over time, we advise some caution when comparing estimates from 2018 to earlier years.
This report includes rankings of the five boroughs and all 59 community districts or 55 sub-borough areas for each indicator. The neighborhood ranked first has the highest number or percentage for the measure, even if lower values of measure are considered “better” (such as with crime rates). When possible, we rank all 59 community districts, though we present ranks for the 55 sub-borough areas for those indicators—including all indicators drawn from U.S. Census Bureau and Home Mortgage Disclosure Act sources—that can be aggregated to the sub-borough area level. In addition, a few indicators are not available for all neighborhoods, so we provide rankings for a subset of neighborhoods. For instance, we report median asking rent only for community districts with at least 30 rental listings in a given year. Therefore, we present rankings only for the subset of community districts where median asking rent is available.
Maps displaying New York City-specific administrative and political boundaries use base map data provided by the New York City Department of City Planning’s Bytes of the Big Apple program. These boundaries include boroughs, community districts, and individual properties. Maps displaying data in geographic areas defined by the U.S. Census Bureau—such as sub-borough areas —use base map data from Census TIGER products.
A number of the indicators presented in the State of New York City’s Housing and Neighborhoods are derived from data collected by the U.S. Census Bureau. These sources are described below along with a discussion of issues of comparability across sources.
From 1970 through 2000, the decennial census consisted of two parts: the “short form” that collected information from every person and about every housing unit in the country, and the “long form” of additional questions asked of a sample of people and households. The short form collected information on age, race, Hispanic or Latino origin, household relationship, sex, tenure, and vacancy status. The long form provided more in-depth information about personal and housing characteristics such as income, employment status, and housing costs. In this edition of the State of New York City’s Housing and Neighborhoods, we use data from the decennial census short and long forms to derive demographic, economic, and housing measures for 2000. To create most of these indicators, we use summary census data reported at the city, borough, and sub-borough area levels. In 2010, the decennial census only included the short form since most of the data that had previously been included in the long form were now reported in the American Community Survey (see below). While much of the decennial census short-form data is also found in the American Community Survey (such as the count of households), the two sources often report differing numbers for statistical and methodological reasons. Unless otherwise noted, we use data from the American Community Survey for 2005 through 2018.
The ACS is an annual survey that collects data similar to those formerly collected by the census long form described above. As with the long form, the ACS covers only a sample of individuals and housing units. However, the ACS uses a smaller sample: the long form covered one out of every six housing units while the ACS only covers one in 40 housing units each year. The U.S. Census Bureau began developing the ACS in 1996, but reliable annual estimates for geographic areas with a population of 65,000 or more only became available in 2005. In December 2010, the U.S. Census Bureau began releasing five-year rolling estimates for geographic areas as small as block groups. Multiyear estimates are referred to by the whole range of years covered (for example, 2014-2018) and should be interpreted as a measure of the conditions during the whole range; due to space constraints, however, multiyear estimates presented in tables in the City, Borough, and Community District Data section are, where noted, labeled using only the final year of the range (that is, an indicator from the 2014- 2018 ACS is listed under the heading “2018”). Most of the indicators from the ACS in this edition are derived from pre-compiled summary tables reported by the U.S. Census Bureau for the city as a whole, individual boroughs, and PUMAs, which, as discussed above, are identical to New York City’s sub-borough areas (and which are often referred to in this report as “neighborhoods”).
For most city-level indicators, we report figures derived from one-year estimates from the ACS. However, for some indicators, due to the small sample size, one-year estimates can be prone to volatility and sampling error, which can make it difficult to reliably discern whether an indicator’s change from one year to the next represents a real change or a statistical anomaly. In order to reduce this uncertainty and draw valid conclusions from differences over both time and space, for select indicators we use five-year ACS estimates. Please see the Sampling section below for recommendations about making comparisons over time and across geographic levels.
While most decennial census- and ACS-derived indicators use pre-tabulated summary data that are reported at a given geography, we calculate some indicators by aggregating person- and household-level data to the desired geographic level. The U.S. Census Bureau makes individual-level data available in Public Use Microdata Samples (PUMS), which are anonymized extracts from the confidential microdata that the U.S. Census Bureau uses in its own calculations for the decennial census and the ACS. We use PUMS data to calculate the household income distribution, income diversity ratio, recently available units affordable to households at different income levels, moderate and severe rent burden rates for households at different income levels, and several indicators by racial and ethnic group in the New York City table of the City, Borough, and Community District Data Section. The only geographic areas that ACS PUMS data identify for a household are its state and PUMA. New York City’s PUMAs are completely coterminous with its city boundaries. In this report, we use data from the IPUMS-USA database, provided by the Minnesota Population Center and the University of Minnesota.
The U.S. Census Bureau makes continual adjustments to the decennial Census and the ACS to improve the coverage of the surveys and accuracy of the results. These adjustments often make cross-year comparisons difficult. Below is a discussion of the key areas where changes in sampling, question construction, or other methods might affect the comparability of indicators that we report in the State of New York City’s Housing and Neighborhoods over time. Read more about comparability between U.S. Census Bureau data sources.
Because the ACS is a sample survey, not a census, all indicators derived from it are estimates,not exact counts. The ACS sample includes approximately three million housing units nationwide, including about 66,000 in New York City. Readers should treat all estimates with some skepticism and be aware that the true value may differ from the reported estimate. This is especially important when comparing small year-to-year changes in sample-derived estimates or with estimates that are derived from a reduced sample. For example, the median rent does not use the entire sample but just the subset of respondents who are renters.
In order to report more reliable estimates of ACS-derived indicators for smaller geographies (such as sub-borough areas) or small populations (such as low-income renter households), we use multiyear ACS estimates. The U.S. Census Bureau recommends using one-year estimates for areas with populations of at least 65,000; all sub-borough areas have populations that are above 100,000, but certain sub- samples (for example, recent movers or low-income renters) are considerably smaller. Five-year estimates reflect data from five full years of surveys, allowing for much more robust and accurate estimates at the expense of being less current. Multiyear estimates should be interpreted as describing the conditions that existed during the full sample range, and therefore should not be compared directly to one-year estimates for any of the individual years in the range. For example, the rental vacancy rate in SBA 201 (Greenpoint/ Williamsburg in Brooklyn) was 2.6 percent according to the 2014-2018 ACS. In New York City as a whole, the rental vacancy rate was 3.4 percent according to the 2018 ACS. Because the estimate for SBA 201 is for the entire period from 2014 through 2018, it is not strictly comparable to the citywide number, which comes from 2018 alone; if the vacancy rate in Greenpoint/Williamsburg and in New York City as a whole declined substantially between 2014 and 2018, the estimate for SBA 201 would include the higher vacancy rate in 2014 as well as the lower vacancy rate in 2018, while the citywide estimate would only use data from after the decrease. (And, if the vacancy rate increased in the interim, vice versa.) It is appropriate, however, to compare multiyear estimates to estimates for a single year that falls outside the multiyear range. For example, one could compare the 2014-2018 estimate to the 2006 estimate, since 2006 is not within the range of 2014-2018.
Multiyear estimates can be compared to other multiyear estimates of the same duration as long as the ranges do not overlap. So, the 2014-2018 estimates for one sub-borough area can be compared to the 2006–2010 estimates for that sub-borough area and to the 2014-2018 estimates for other sub-borough areas. To compare a neighborhood’s multiyear ACS estimate to the rest of the city, it is more effective to use its ranking than to compare its multiyear neighborhood estimate to the city’s single-year estimate.
Question construction and data collection for income information differs between the decennial census and the ACS. The 2000 census asked for the respondent’s 1999 income; thus incomes reported in 2000 are all for one fixed period of time (calendar year 1999). In contrast, the ACS asks for the respondent’s income over the “past 12 months.” As the U.S. Census Bureau collects ACS responses on an ongoing basis throughout the year, these estimates are not directly comparable; for example, a 2018 ACS respondent who was interviewed in January of 2018 would report income that was mostly earned in 2017, while a respondent who was interviewed in December of 2018 would report income that was mostly earned in 2018. The U.S. Census Bureau notes that a comparison study of the 2000 census and the 2000 ACS found that incomes reported in the census were about four percent higher than the incomes reported in the ACS. Because of the data collection methods mentioned above, adjacent years of ACS data may have reference months in common; thus comparisons of income data between adjacent ACS years (for example, 2017 and 2018) should not be interpreted as precise comparisons of economic conditions in those years.
The indicators that draw on the ACS income data include the income diversity ratio (from PUMS data), median household income, poverty rate, and poverty rate by age. As a result, year-to-year changes in these indicators should be interpreted with caution. Except where otherwise noted, we adjust all dollar figures for inflation (to constant 2019 dollars) from the nominal dollar values reported by the U.S. Census Bureau (see below for more on how we adjust for inflation). However, such nominal dollar values are generated by the U.S. Census using different methods depending on the source of the data. For ACS estimates that are included in the pre-tabulated summary data, the U.S. Census Bureau reports dollar amounts that have been inflated to the annual average for the survey year (for example, calendar year 2018 for the 2018 ACS) based on the monthly Consumer Price Index (CPI). Thus, respondents’ incomes (and rents) are adjusted to account for the fact that some are interviewed early in the year and others are interviewed later in the year. Such an adjustment, however, may not fully account for changes in the state of the economy over the course of the year. For example, if unemployment were higher in 2017 than in 2018, respondents interviewed in January of 2018 would be more likely to report zero earnings in the last twelve months than similar respondents interviewed in December of 2018, independent of the price level in the economy as measured by the CPI. In order to ensure the anonymity of individual responses in the PUMS data, however, the U.S. Census Bureau does not adjust each respondent’s income (or rent) for inflation based upon the month in which they were interviewed; instead, the identical adjustment is applied for all respondents, whether they were interviewed early or late in the year. If the rate of inflation changed over the course of the year, the dollar figures from PUMS could be biased. Since rent and income are recorded at the same time, the moderate and severe rent burden for low-income renters, which are also calculated from PUMS data, should not exhibit this bias.
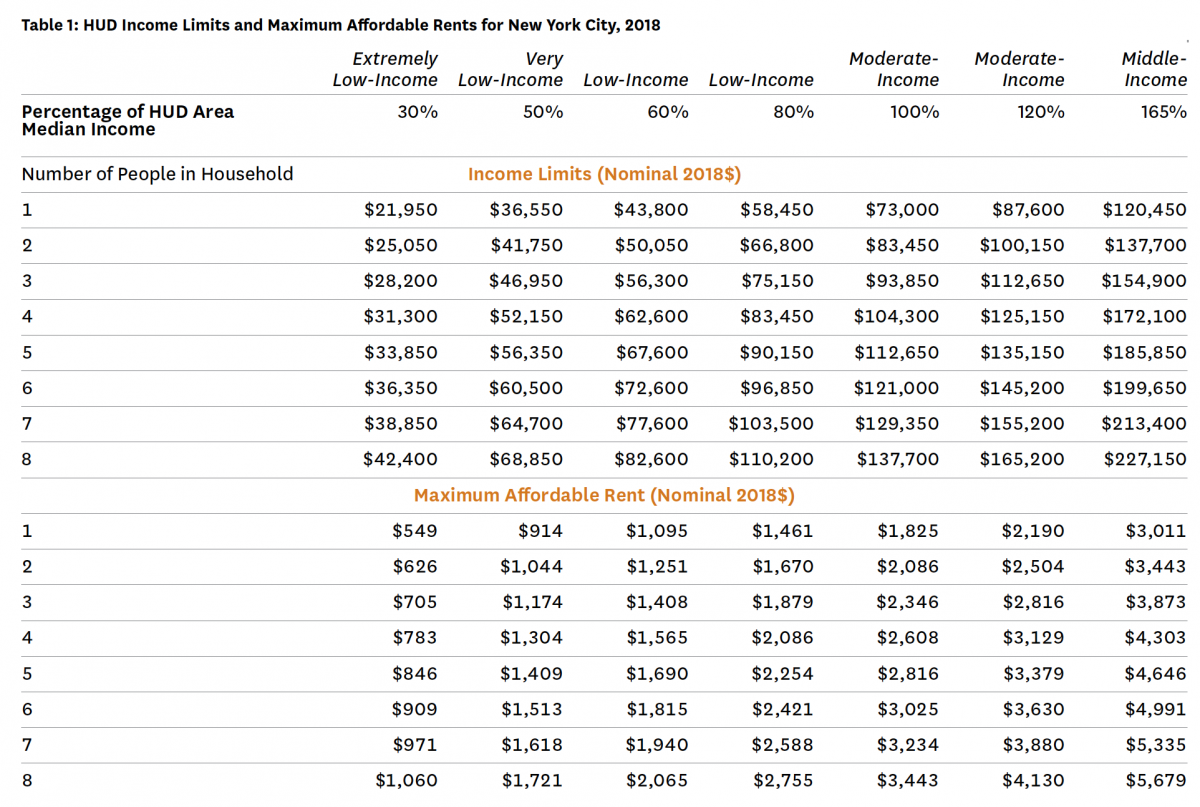
The U.S. Department of Housing and Urban Development (HUD) defines income eligibility limits for its Section 8 and HOME programs based on the area median income (AMI) in a metropolitan area. HUD determines three general income limits at 30, 50, and 80 percent of AMI for various household sizes. HUD does not publish income guidelines for households with more than eight members, although its methodology allows for their calculation. To ease computation, we apply the eight-person limits to these larger households. As of fiscal year 2018, HUD assigned category names to ranges of the area median income:
We employ HUD’s general method to calculate 120 and 165 percent of the area median income for various household sizes. While HUD does not set category names for higher income ranges, we define moderate-income households as those making more than 80 and up to 120 percent of AMI, and middle-income households as earning more than 120 and up to 165 percent of AMI.
Table 1 displays these income limits by household size for fiscal year 2018, not adjusted for inflation, along with the concomitant maximum affordable rents, which are calculated as 30 percent of the income limits. For more information about HUD’s method and their published guidelines, refer to individual years’ guidelines.
Since the definition of income limits (and thus maximum affordable housing costs) vary by household size, we need to take household size into account in order to calculate the share of rental units that are affordable to households of various income levels. For a rental unit with n bedrooms, we classify it as affordable at X percent of AMI if its gross rent is less than the maximum affordable rent specified by HUD for a household of size n+1; that is, a studio (i.e. a unit with zero bedrooms) is classified according to the maximum rent values for single-person households, a one-bedroom is classified according to the maximum rent values for two- person households, a two-bedroom is classified according to the maximum rent values for three-person households, and a unit with three or more bedrooms is classified according to the maximum rent values for four-person households. This method makes assumptions about the composition of the households that occupy each unit. Therefore, this indicator should be interpreted with some caution.
The Federal Home Mortgage Disclosure Act (HMDA) requires financial institutions with assets totaling at least $46 million as of 2018 to report information on loan applications and originations if they have originated or refinanced any first- lien home purchase loans on one- to four-family properties (including condominium and co-op units) in the previous year. Thus, the HMDA data capture most, but not all, one- to four-family residential mortgage lending activity. We use this dataset to calculate the home purchase loan rate, the refinance loan rate, and a number of derivative indicators. All figures in our analysis are based on non-business-related loans on owner-occupied, one- to four-family properties (including condominiums). We exclude from our analysis any loans for manufactured or multifamily rental housing (with five or more units), loans on properties that are not owner-occupied, and any loans deemed to be business related (classified as those loans for which a lender reports an applicant’s ethnicity, race, and sex as “not applicable”). The loans that we consider constituted about 84 percent of all loan originations in New York City in 2015. Loan applicants were assigned to a racial/ethnic group for purposes of our research based on the first reported race of the primary applicant. However, if the applicant reported his or her ethnicity as “Hispanic” the applicant was classified as Hispanic, regardless of the applicant’s reported race. When an applicant provided information to the lender via mail, internet, or telephone and did not provide information on their race, we assigned those loans to the “not reported” racial category. For indicators presented as mortgage origination rates, we use data from New York City Department of Finance Final Tax Roll File to derive the total number properties of different types. This year we have made minor changes to the classification of property types used in this denominator of the rate indicators, so their values differ slightly from what we have published previously.
We receive data on lis pendens (LP) filings from a private vendor, Public Data Corporation. An LP may be filed for a host of reasons unrelated to a mortgage foreclosure, so we use a variety of screening techniques to identify only those LPs related to a mortgage. These techniques include searching for words within either of the party names and dropping any LPs that relate to a tax lien or a mechanic’s lien, or that are originated by a government agency. If the same property receives any additional LPs within 90 days of the initial LP, the additional LPs are not included in our rate to avoid counting the same foreclosure twice.
This indicator measures the number of residential units in proposed developments approved by the New York City Department of Buildings (DOB). We compile this indicator from job filings and permit approvals from DOB, which are publicly available on New York City’s Open Data website. In New York City, developers file a job with DOB early in the development process. These records include many details about development projects, including its extent (for example, if a project is a new building or alters an existing one) and, for residential projects, the number of housing units it will contain when complete. Because developers can file jobs long before DOB allows construction to begin, and our source of job filings rarely includes the date that a project is fully permitted, we must also collect permit data. Permits, which are associated with jobs, represent partial or entire approvals of development projects. Permits allow us to count only the projects in which DOB has approved structural work, so construction of those buildings is likely to occur. Because permits lack certain information about projects—the number of proposed housing units, in particular—we must merge some detail from jobs to permits.
We consider only permits that meet the following criteria:
The project will result in a new building (job type is “NB”);
The permit authorizes structural work (permit type is “NB”);
The development includes residential uses;
The permit does not renew a previously approved permit (filing status is “initial”);
No other permit was filed for the same site during the previous calendar year.
When multiple permits on the same site (with the same building identification number, or BIN) meet these criteria, we count just the most recently issued permit. Thus, each permit we retain should represent a unique residential building project. As of this year, for 2004 and later we use the permits and jobs dataset from New York City Open Data. With these data, all permits can be matched with the associated job filings. Previously the matching process was somewhat imperfect and so values for this indicator will differ from what we have published previously. The previous process, which we still rely on for 2003 and earlier, allows us to link most but not all permits to their associated jobs because our data source does not include all job filings. When we cannot find a permit’s matching job, we instead matched the permit to the most recently filed job on the same BIN as the permit, as long as the job was filed no more than four years before the permit and the job includes the number of units proposed for the site. Accordingly, in these years our measure may somewhat understate the number of units in the construction pipeline and for this reason comparisons between the two periods should be made with caution.
The New York City Department of Education publishes school-level proficiency rates every year. We joined the proficiency data with a school facilities shapefile provided by the New York City Department of City Planning’s Bytes of the Big Apple website, which also includes the community district the school falls into. We removed private and charter schools and then summed up the number of fourth graders scoring “proficient” in math and English language arts, and the number of students who were tested in each subject. We use those aggregates to calculate proficiency rates at the community-district level. Because students can attend schools outside of their community district (for example, if their school zone extends beyond the borders of their community district), the student performance indicators provide information about the performance of students who attend schools in that neighborhood rather than the performance of students who live in that neighborhood.
Unless stated otherwise, when reporting dollar-denominated indicators, we adjust amounts to 2019 dollars using the Consumer Price Index for All Urban Consumers (Current Series) without seasonal adjustments from the Bureau of Labor Statistics over all major expenditure classes for the New York City metropolitan area. This allows for more consistent comparisons across years for individual indicators.
All content © 2005 – 2024 Furman Center for Real Estate and Urban Policy | Top of page | Contact Us