State of the City 2020
The number of housing units permitted for construction during 2020 decreased by 28.5 percent from the previous year. The number of completed units declined at a slightly smaller percentage (24.8%), thoguht there were fewer units issued a certificate of occupancy than in any year since 2015.
In this section, we use administrative data to describe permitted and actual additions to the city’s housing stock during 2020. Unlike the other sections of the report, this one includes data through all of 2020.
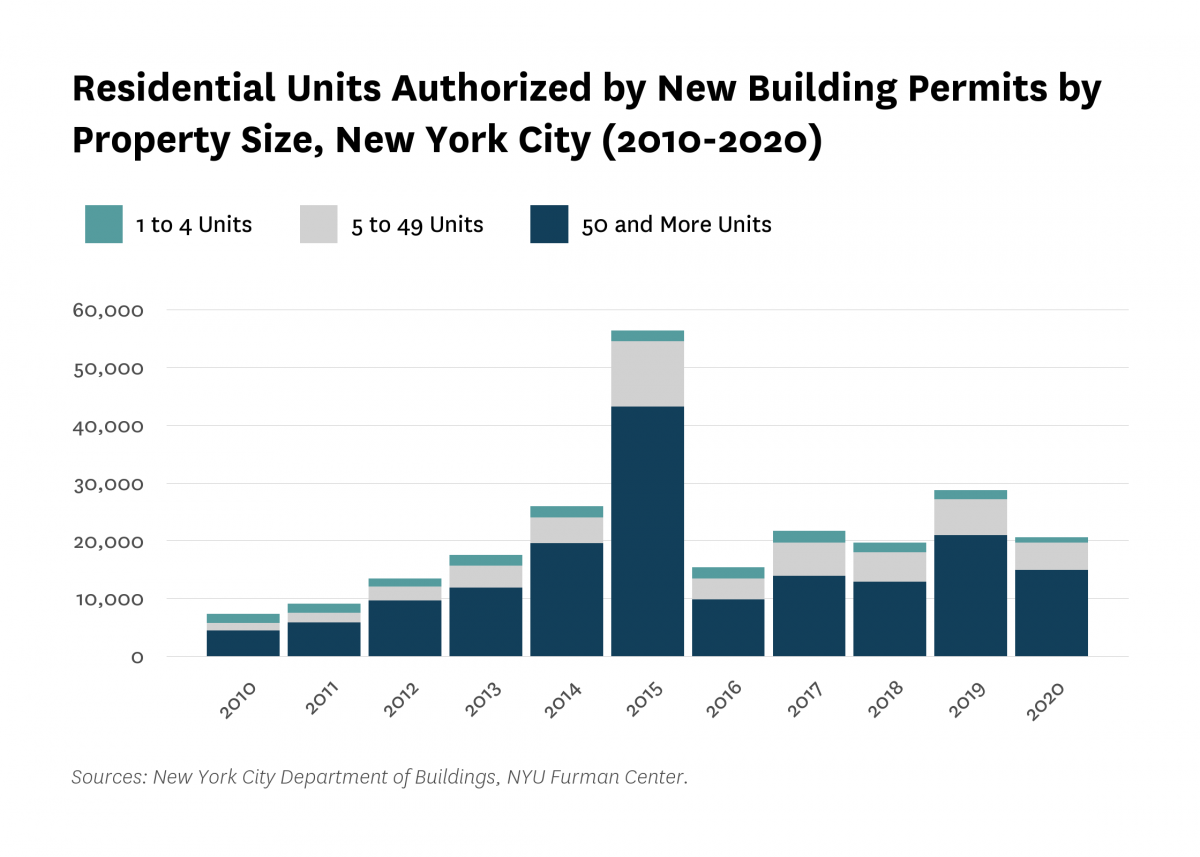
The New York City Department of Buildings authorized 20,590 new housing units in 2020, down 28.5 percent from 2019 (28,787). The decline was relatively even across building sizes. Five percent of units were authorized in 1 to 4 unit buildings (952), 23 percent were authorized in buildings with 5 to 49 units (4,719), and 72 percent were authorized in buildings with 50 or more units (14,919). The spike in permitting activity in 2015 may have been due to developers rushing to apply for permits in that year, before legislation that authorized the 421-a tax exemption expired.
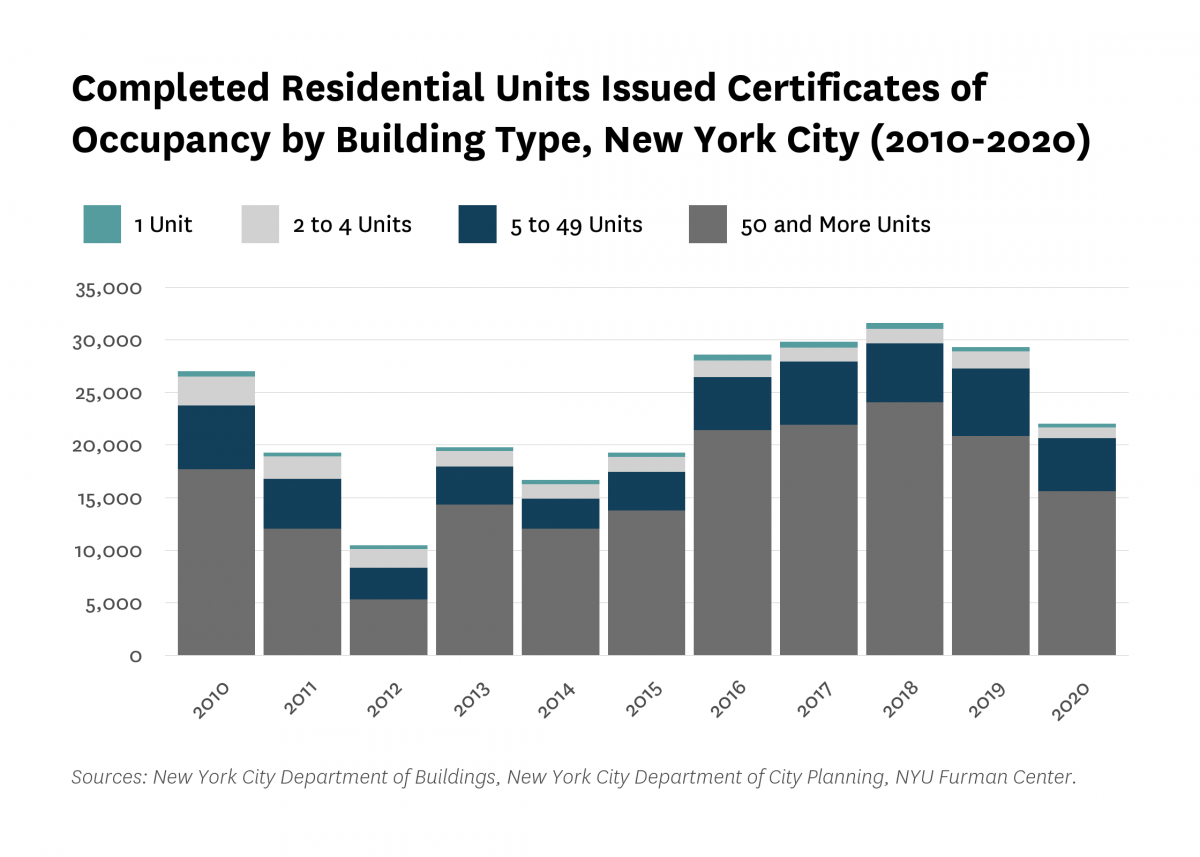
Between 2019 and 2020, the number of new units that received a certificate of occupancy decreased by 24.8 percent to 22,022. As is typical in New York City, the majority of new units authorized for occupancy were in 50+ unit buildings (70.8%), though the 15,601 units issued a certificate of occupancy in large buildings was 25.2 percent lower than the previous year. Certificates of occupancy were also issued for 358 single-family homes (a decrease of 13.5%), 1,056 units in 2-4 unit buildings (a decrease of 34.9%), and 5,007 units in 5-49 unit buildings (a decrease of 25.2%).
All content © 2005 – 2024 Furman Center for Real Estate and Urban Policy | Top of page | Contact Us