State of the City 2020
Across New York City, there continue to be stark differences in homeownership rates by race and borough. In 2019, prior to the pandemic, home purchase originations fell slightly from the year before, while refinancing activity increased. During the pandemic, the number of foreclosure filings decreased dramatically, though the geographic distribution of filings was similar to that in 2019. While the volume of home sales decreased by about 25 percent between 2019 and 2020, the prices of those sales rose more than twice as quickly as between 2018 and 2019.
Most of the figures in this section (homeownership rates, owner cost burden, and mortgage originations for home purchases and refinancing) use data that only go through 2019, and therefore do not include the impact of COVID-19. Only the figures on foreclosure filings, housing sales prices, and housing sales volume include data through 2020. By next year, we will be able to determine whether these trends continued through the pandemic.
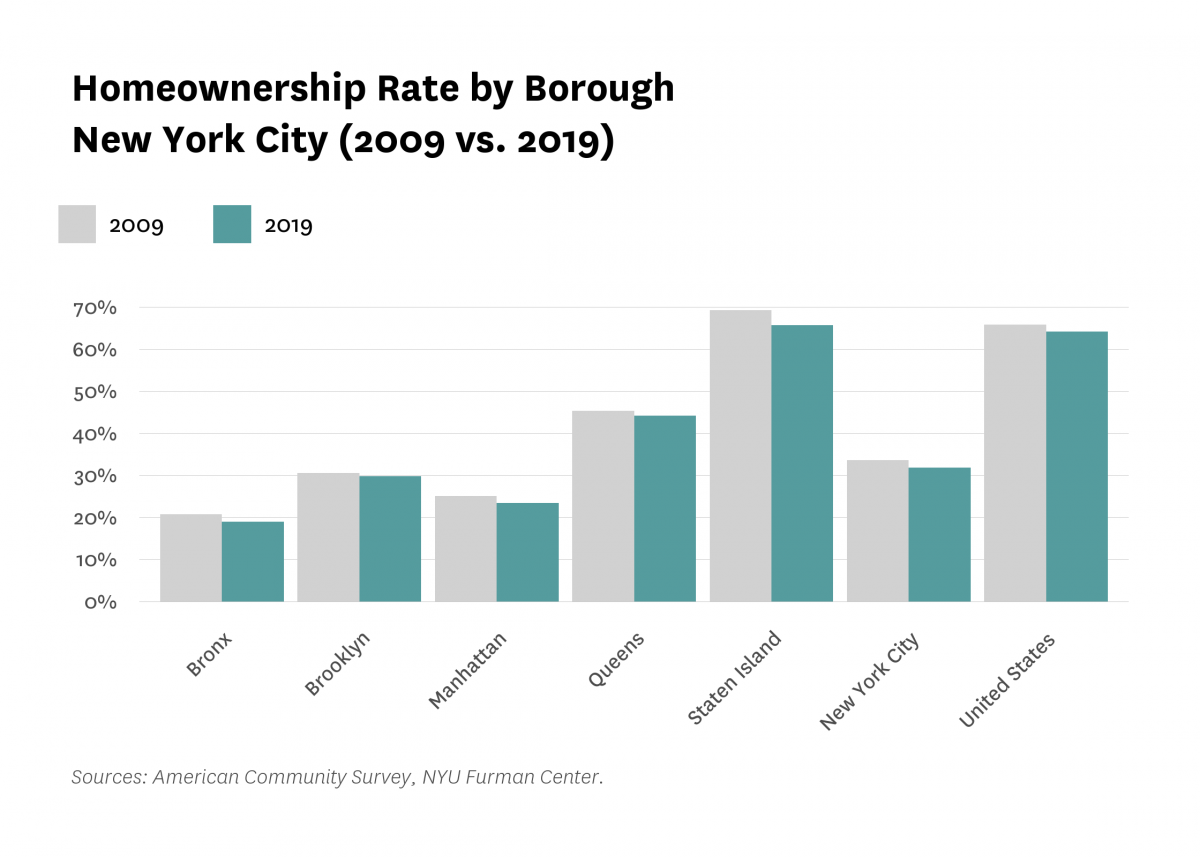
In 2019, the city’s homeownership rate was 31.9 percent, declining from 33.6 percent in 2009. The rate varies significantly by borough. The Bronx had the lowest homeownership rate at 18.9 percent. Queens had a homeownership rate of 44.1 percent, Brooklyn 29.8 percent, and Manhattan 23.3 percent. The homeownership rate in Staten Island was 65.7 percent, above the national rate (64.1%) and far higher than that in any other borough.
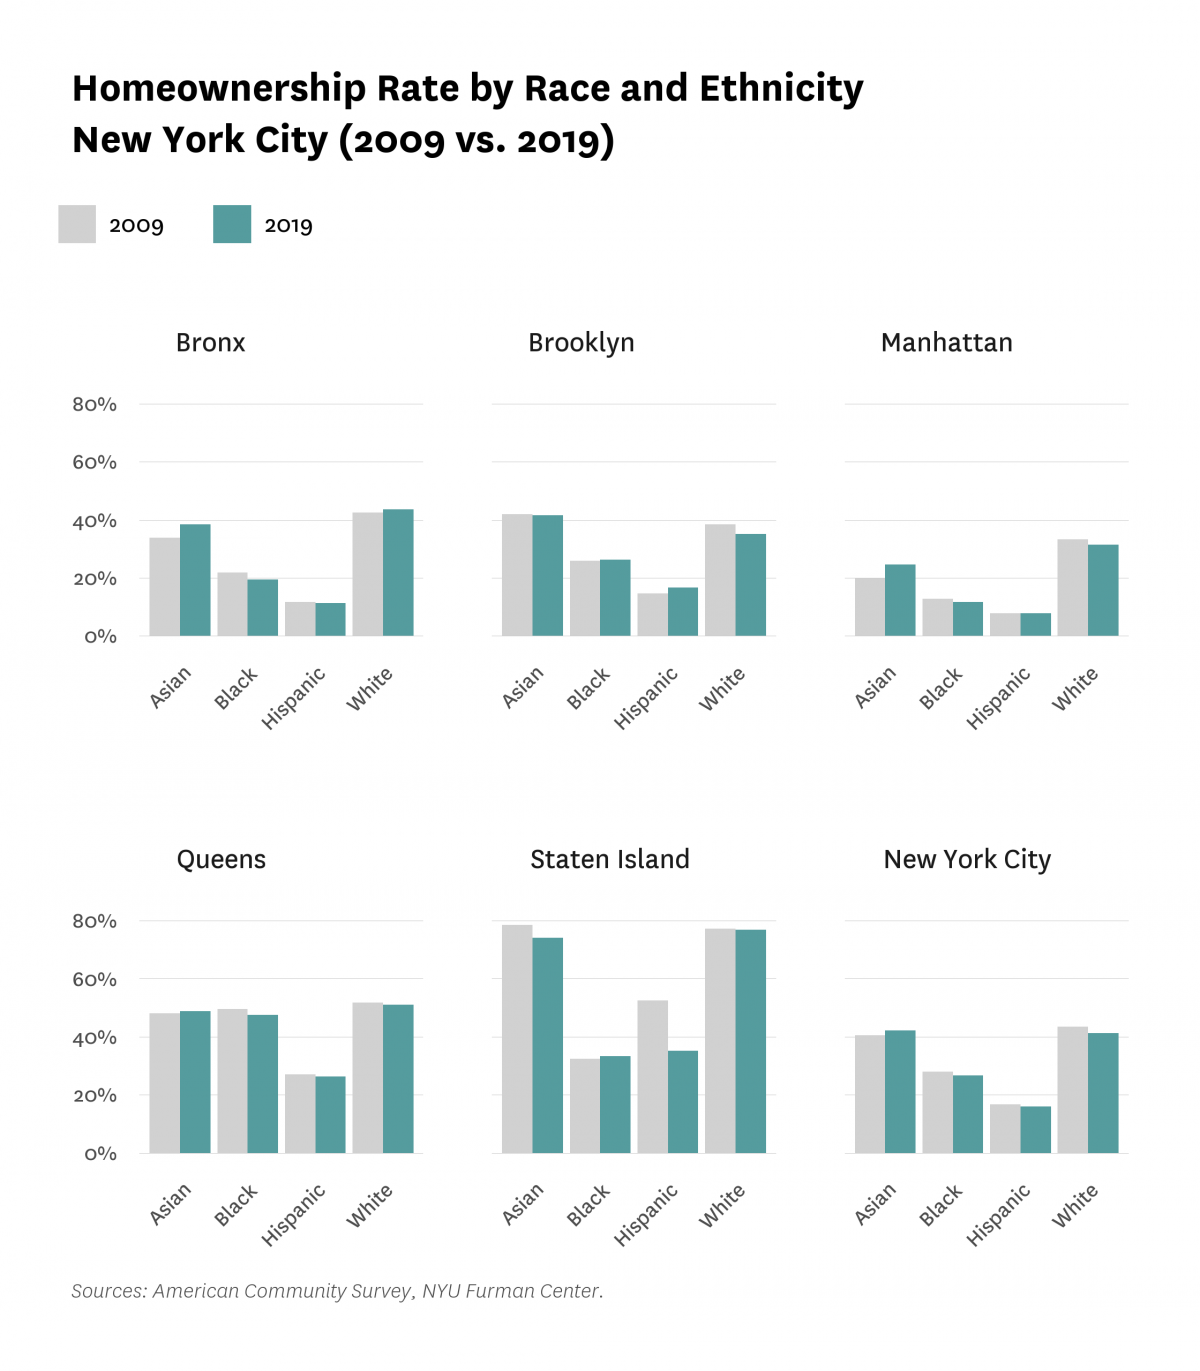
In 2019, the homeownership rate was 42.2 percent for Asian households and 41.2 percent for white households, a far higher rate than that for Black and Hispanic households, whose respective homeownership rates were 26.6 and 15.9 percent. Disparities differ across boroughs. For example, the Black household homeownership rate was 48 percent in Queens, about the same rate of homeownership as Asian and white households residing in that borough. However, in all other boroughs, Black households had much lower homeownership rates than Asian and white households, with the largest racial differences in homeownership rate seen in Staten Island. In that borough, the Black-white homeownership gap was 43.5 percentage points.
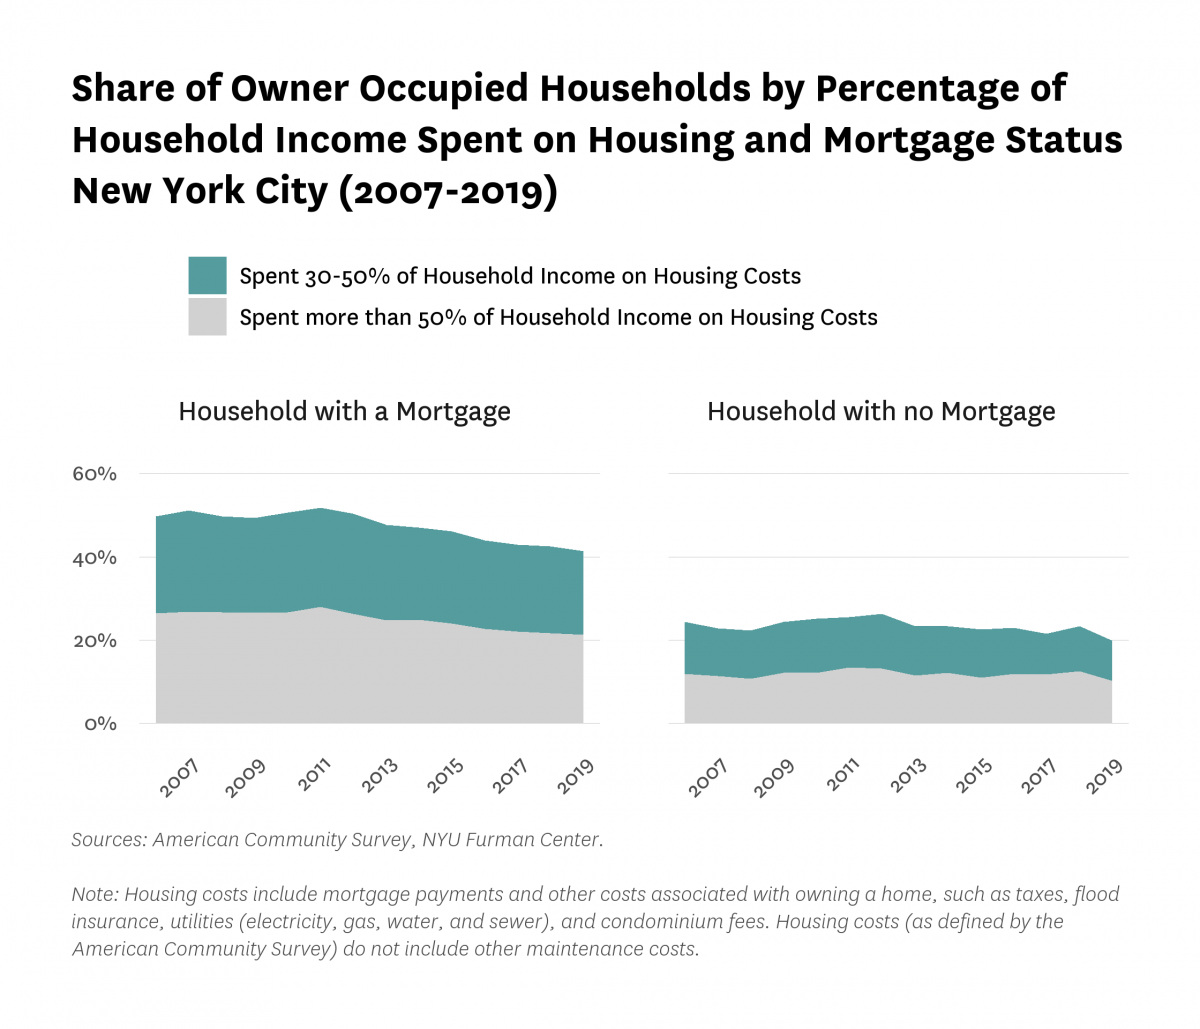
The United States Department of Housing and Urban Development (HUD) defines moderate housing cost burden as spending 30 percent or more of household income on housing costs, and severe housing cost burden as spending 50 percent or more of household income on housing costs. The share of cost burdened owners with mortgages in New York City peaked in 2011 (51.7%). The rate has declined about 10 percentage points since then to a 2019 rate of 41.4 percent. Households without mortgages, who still pay for property taxes and utilities, were far less likely to be cost burdened than those with mortgages. The cost burden rate for owner households without mortgages peaked in 2012 at 26.3 percent and has since fallen to a rate of 19.8 percent. Despite these gains, about one in five households without mortgages still faced moderate or severe cost burdens.
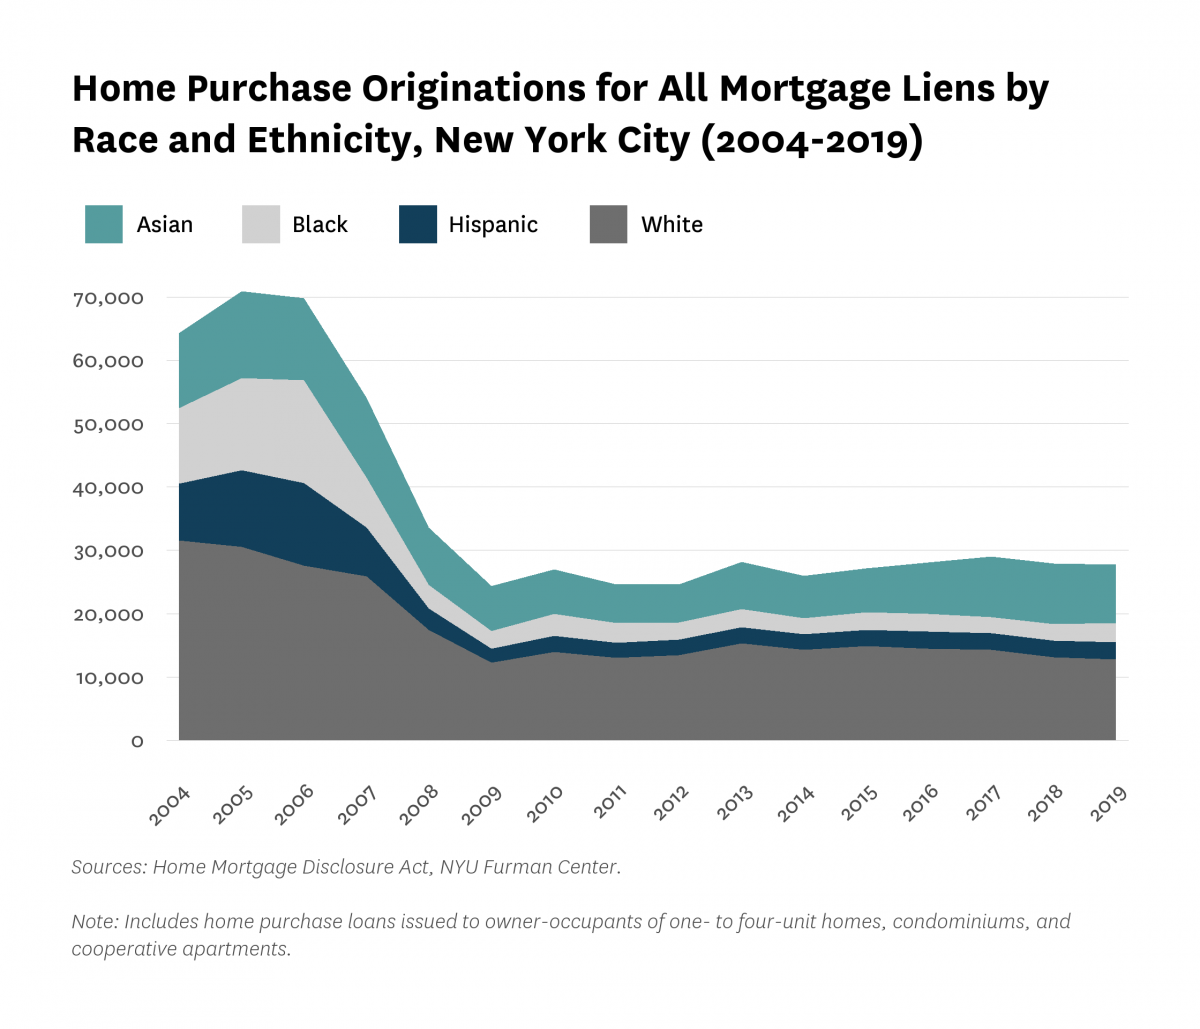
Home purchase originations, or the number of new mortgages taken out by borrowers, have remained relatively constant since 2009, following a large decline after the subprime lending era. However, originations fell slightly in Brooklyn, Queens, and Staten Island in 2019. Staten Island saw 419 fewer home purchase loans originated in 2019 than 2018. The overall number of mortgage originations in 2018 was far less than half of the mortgages originated in 2005.
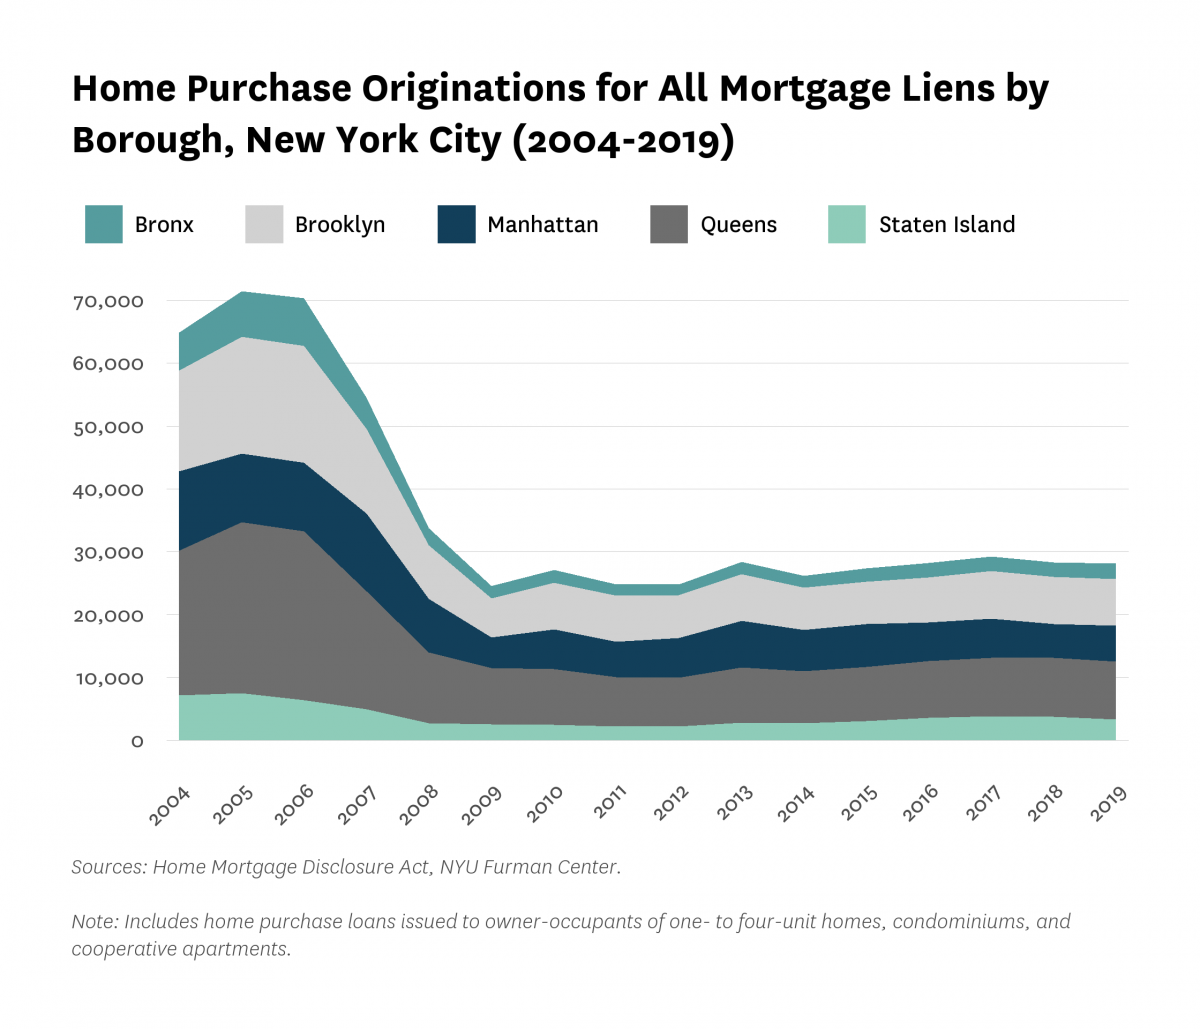
There were 27,717 mortgage originations across New York City in 2019, down only slightly from 27,893 in 2018. The share of borrowers who were Black grew from 8.8 percent in 2017 to 11.1 percent in 2019. The white share of borrowers declined from 49.2 to 46.0 percent between 2017 and 2019, but still remained by far the highest share of mortgage originations. A notable longer term trend is the increase in the number of mortgage originations for Asian borrowers, which rose from 6,038 in 2012, to 9,173 in 2019, a growth of 51.9 percent. During that same time period, the number of originations increased by 13.6 percent for Black borrowers and 11.2 percent for Hispanic borrowers, and declined by 5.1 percent for white borrowers.
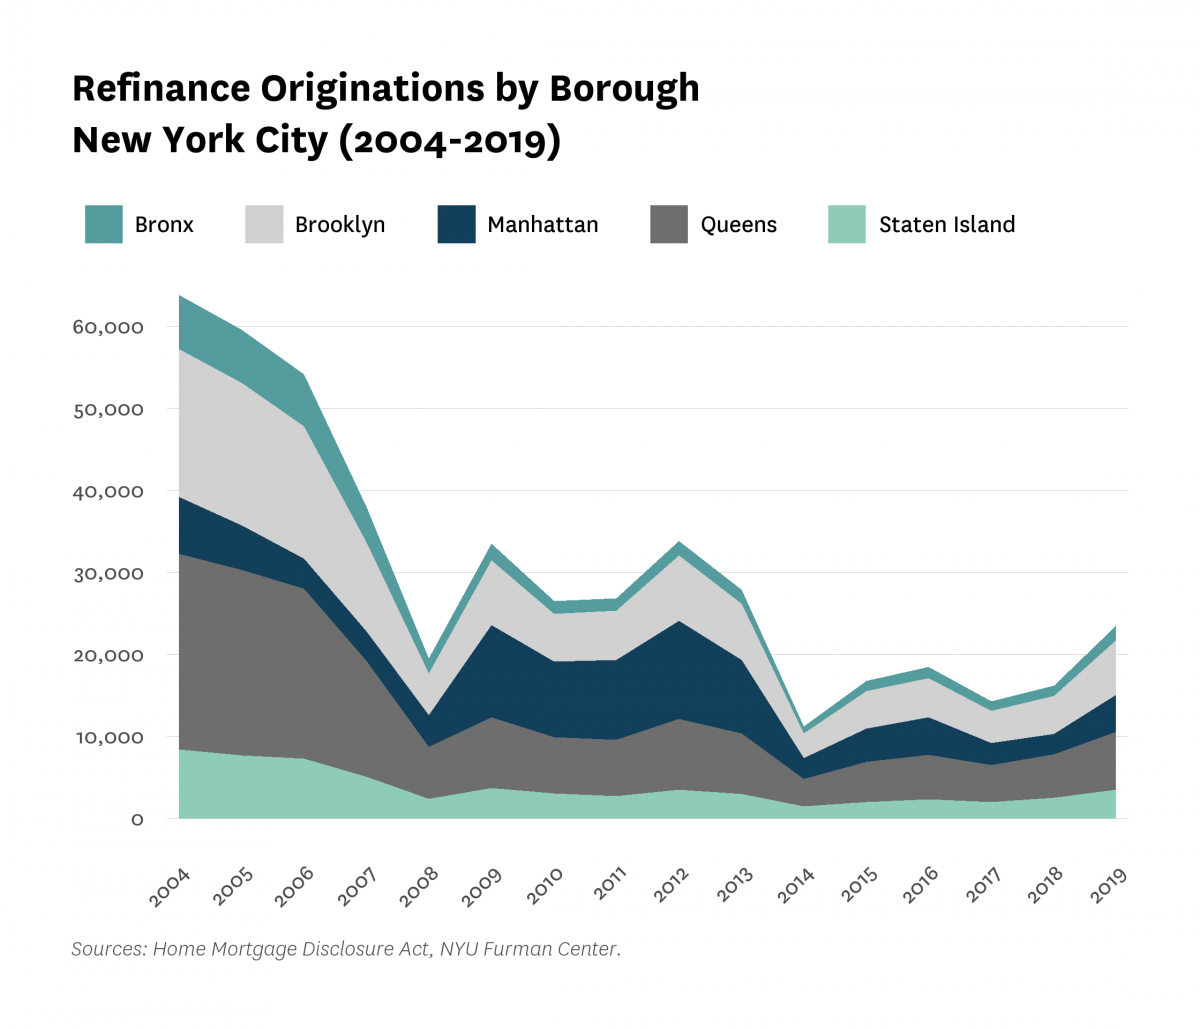
Across New York City, the total number of refinance originations increased from 16,172 in 2018, to 23,477 in 2019. The number of refinance originations increased in all boroughs, and was the most refinancing originations since 2013. The increase in mortgage refinancings can likely be attributed to a relatively low interest rate environment.
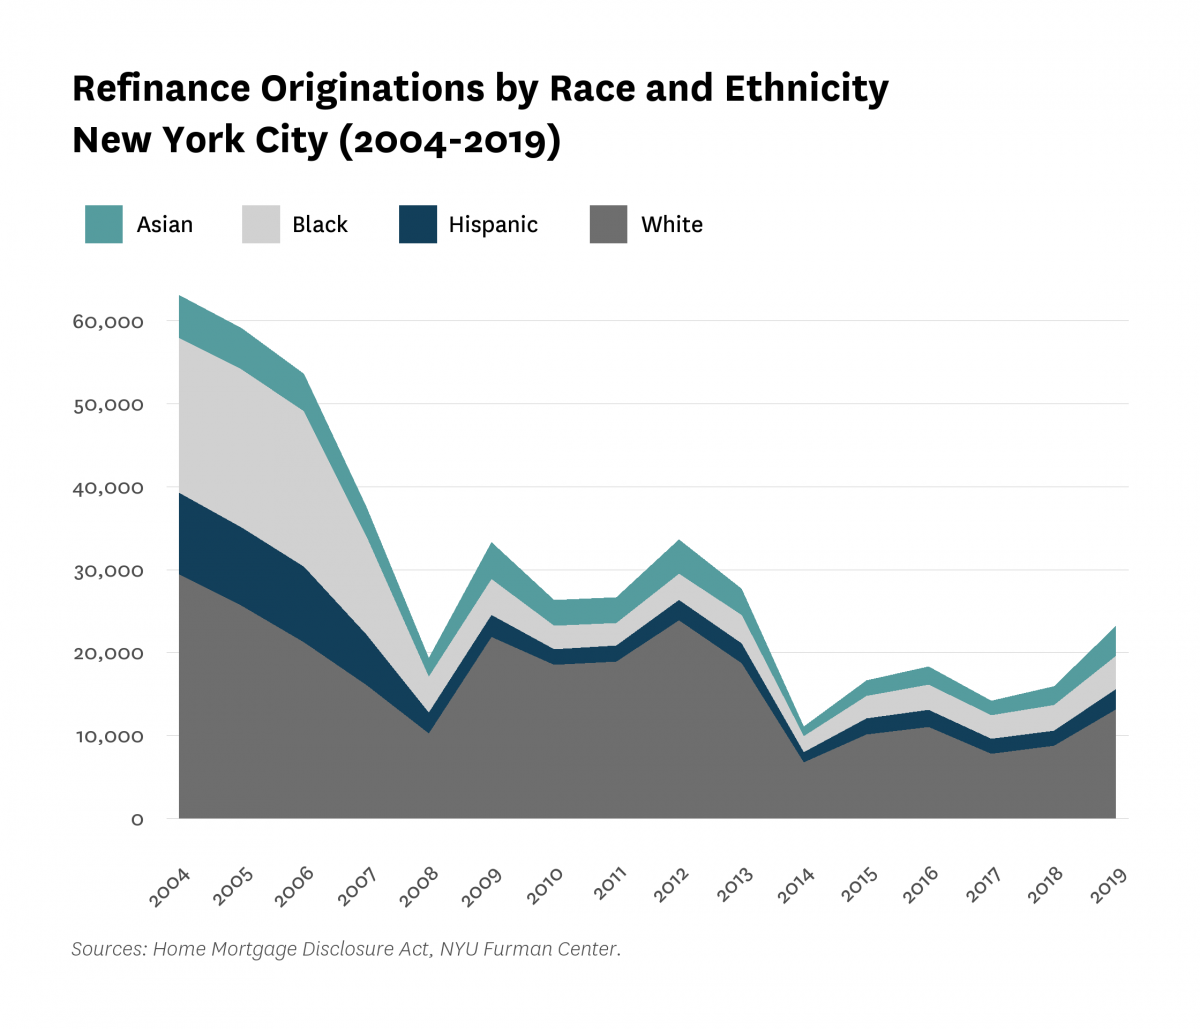
Refinancings increased for mortgage holders in all racial groups between 2018 and 2019. The number of refinance originations increased by 28.8 percent for Black borrowers, 32.8 percent for Hispanic borrowers, 50.6 percent for white borrowers, and 60.1 percent for Asian borrowers. Black mortgage holders had the highest number of refinancings since 2009 (3,981 in 2019 compared to 4,350 in 2009). White borrowers continue to make up the majority of refinancings at 56.7 percent, compared to 17.1 percent for Black borrowers, 15.6 percent for Asian borrowers, and 10.5 percent for Hispanic borrowers.
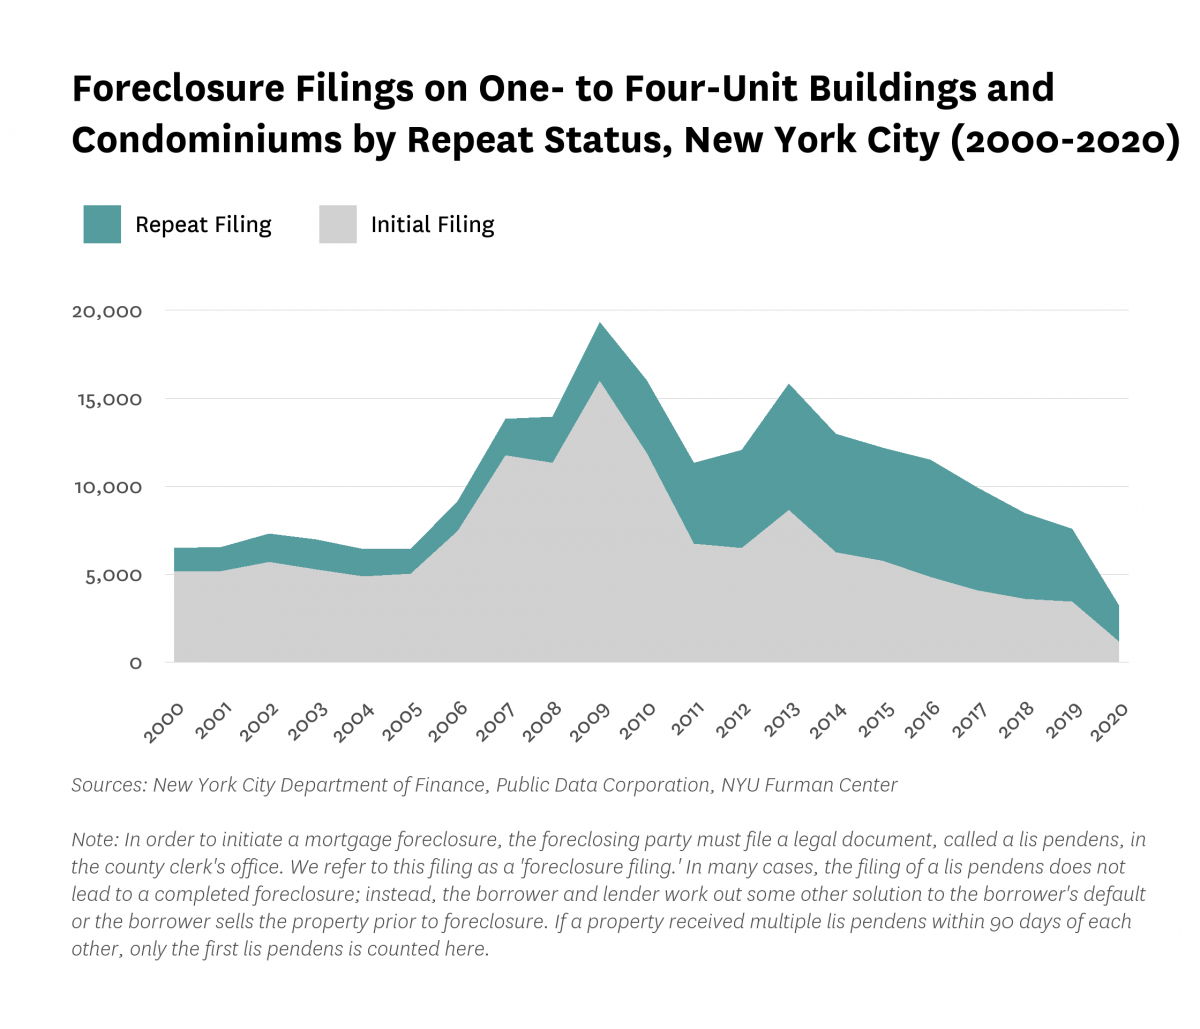
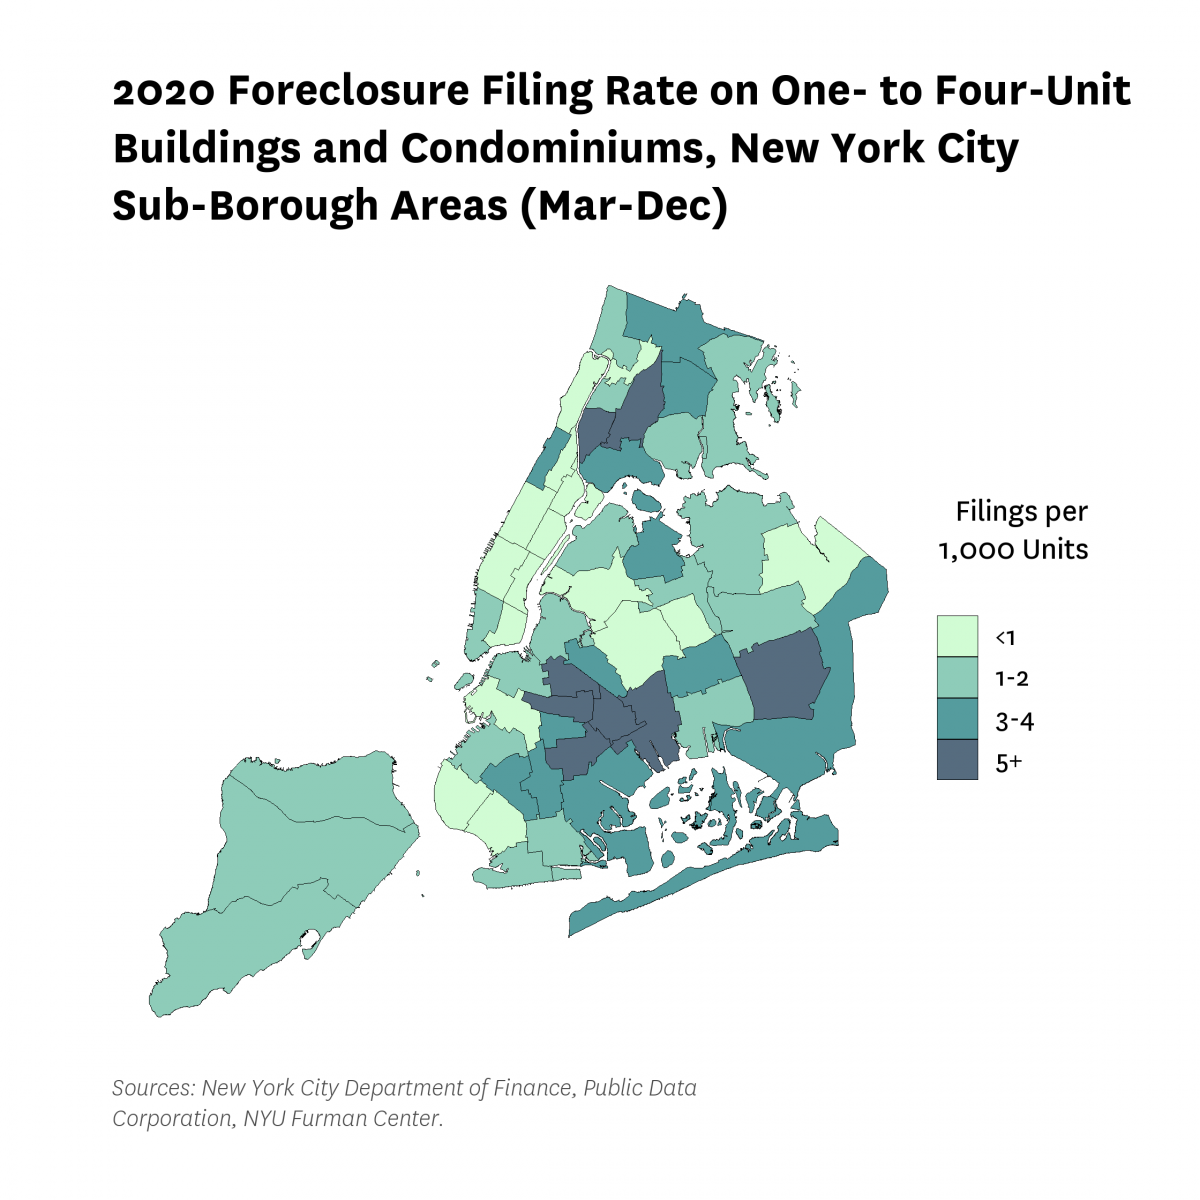
In 2020, there were 3,194 foreclosure filings for one- to four-unit buildings, an 84.5 percent decline from the peak in 2009. Between 2019 and 2020 alone, the number of foreclosure filings decreased by 60.0 percent. Of all the filings in 2020, 63.4 percent were repeat filings, up from 54.7 percent in 2019. The dramatic decline in 2020 was due in large part to forbearance and a series of moratoria on foreclosure filings enacted by the State and Federal government.
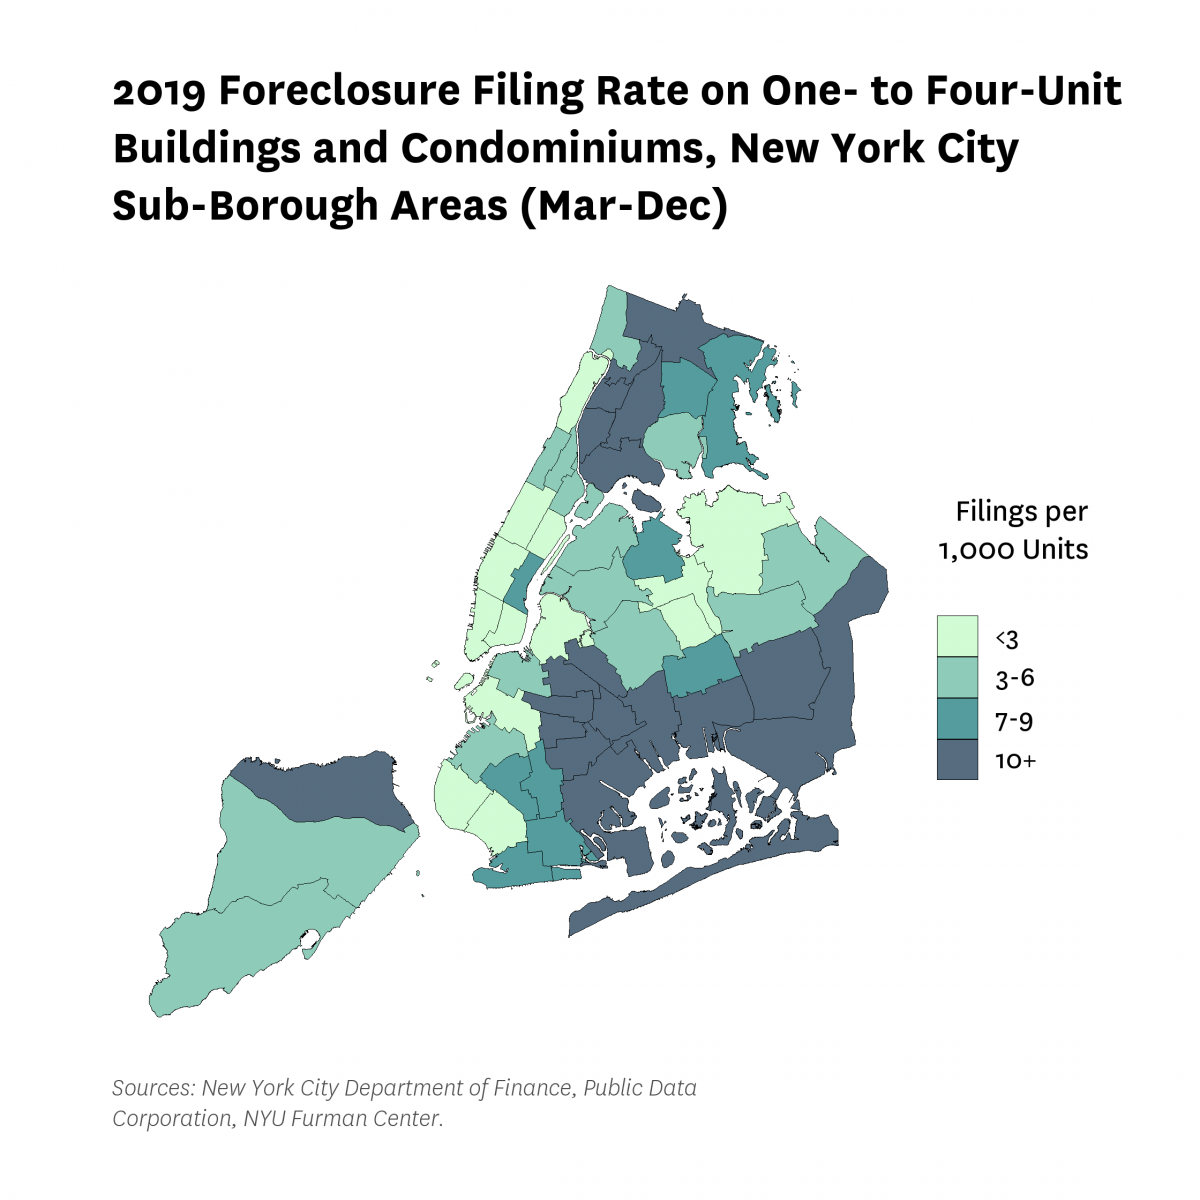
While the overall foreclosure filing rate dropped under COVID-19 related moratoria, the geographies with the highest concentration of filings were similar to the prior year. Of the eight sub-borough areas with the highest foreclosure filing rates (5 or more per 1,000 units between March and December of 2020), five were in Brooklyn and two were in the Bronx. East Flatbush had the highest foreclosure filing rate (6.8 foreclosure filings per thousand units), followed by Morrisania/Belmont in the Bronx (6.3) and Jamaica in Queens (6.3). Those neighborhoods were followed by Highbridge/South Concourse (6.2) in the Bronx and Brownsville/Ocean Hill (5.6), East New York/Starret City (5.4), North Crown Heights/Prospect Heights (5.3), and Bedford Stuyvesant (4.8) in Brooklyn. Two of those sub-borough areas, Highbridge/South Concourse and Brownsville/Ocean Hill, also saw the greatest percentage point decline in foreclosure filing rate compared to the same period the previous year (17.5 and 16.1, respectively).
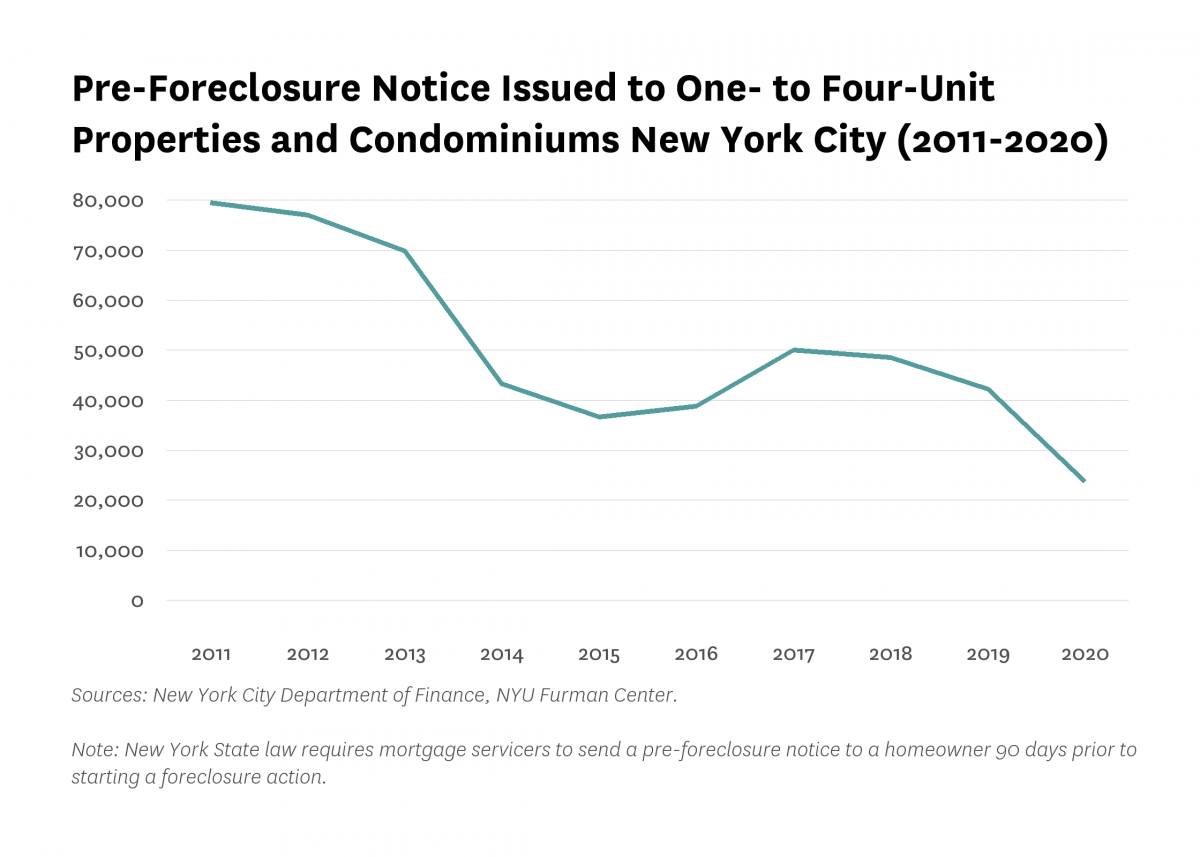
In 2020, the number of pre-foreclosure notices dropped to 23,698, a decline of 43.8 percent from 2019. The decline was likely due in large part to forbearance and the foreclosure moratoria put in place in response to the economic crisis.
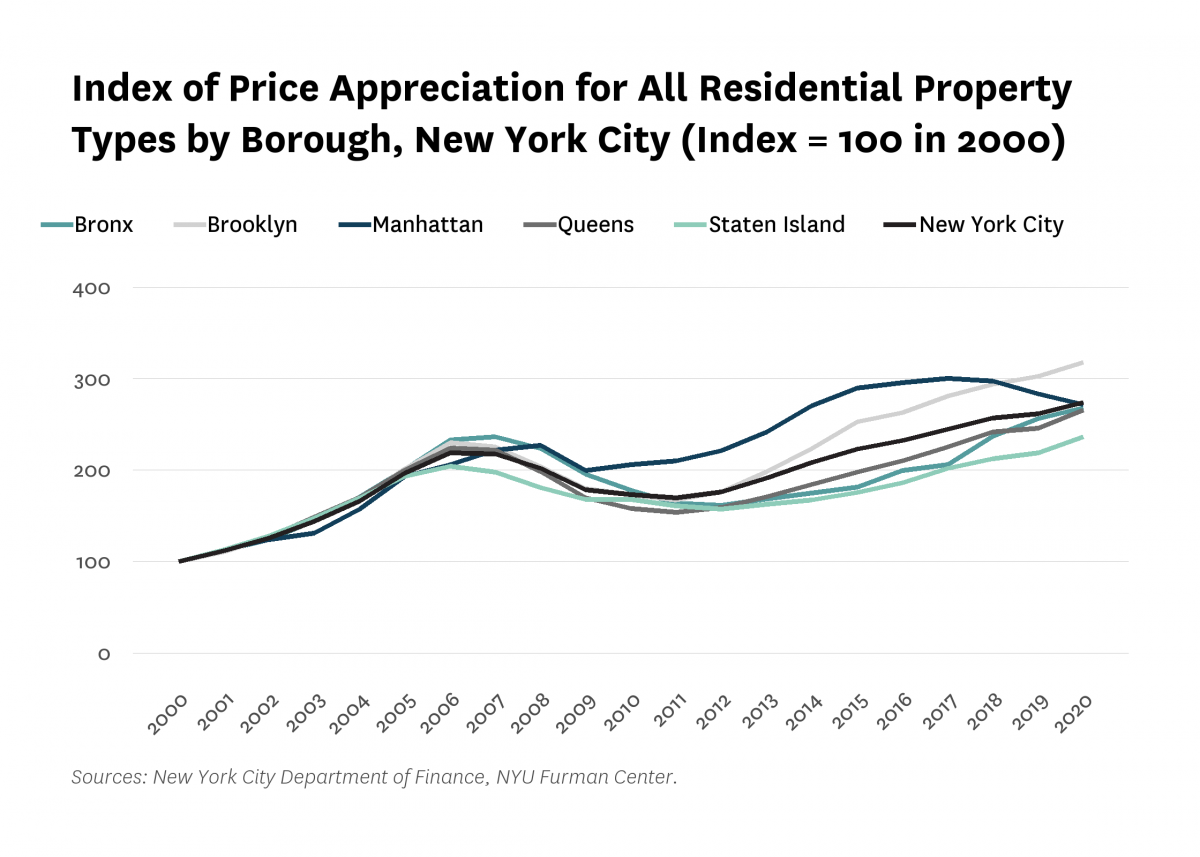
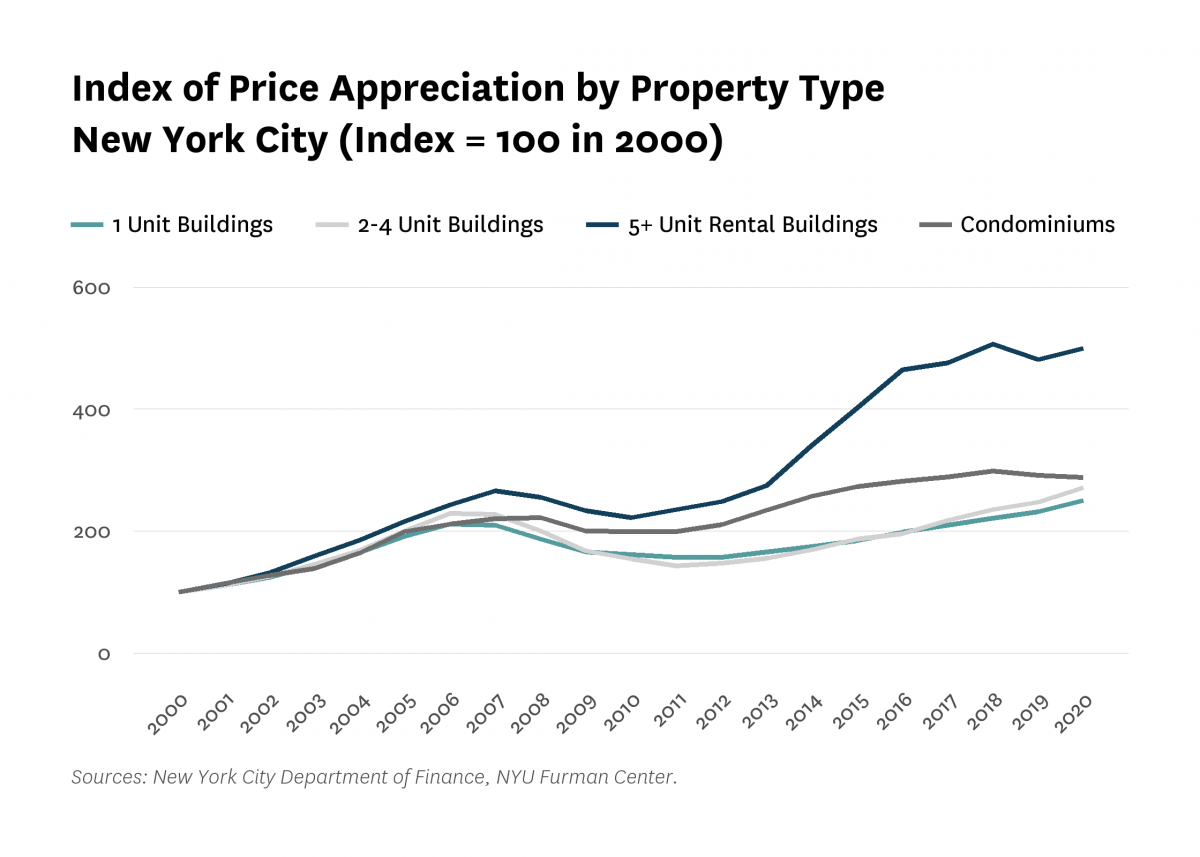
Prices for residential property rose by 4.6 percent across the city between 2019 and 2020, more than twice the increase as compared to the previous year (1.7% increase between 2018 and 2019). Of the boroughs, Queens saw the largest increase (8.1% in 2020), more than quadruple the borough’s rate in 2019 (1.8%). Staten Island saw a similar increase in prices (7.9%), followed by Brooklyn (5.0%) and the Bronx (4.6%). Manhattan continued a negative trend that began in 2018; in the midst of the pandemic, prices dropped by 4.2 percent between 2019 and 2020. With that continued drop, Brooklyn surpassed Manhattan in the index we show of price appreciation since 2000.
Citywide, two- to four-unit properties were the property type with the largest increase in sales prices for the second year in a row. Sales prices for this property type rose by 9.5 percent between 2019 and 2020. Sales prices for single-unit properties increased by 7.8 percent, and prices for properties with five or more units rose by 3.8 percent. Prices for condominium properties declined slightly for the second year in a row (-1.0%).
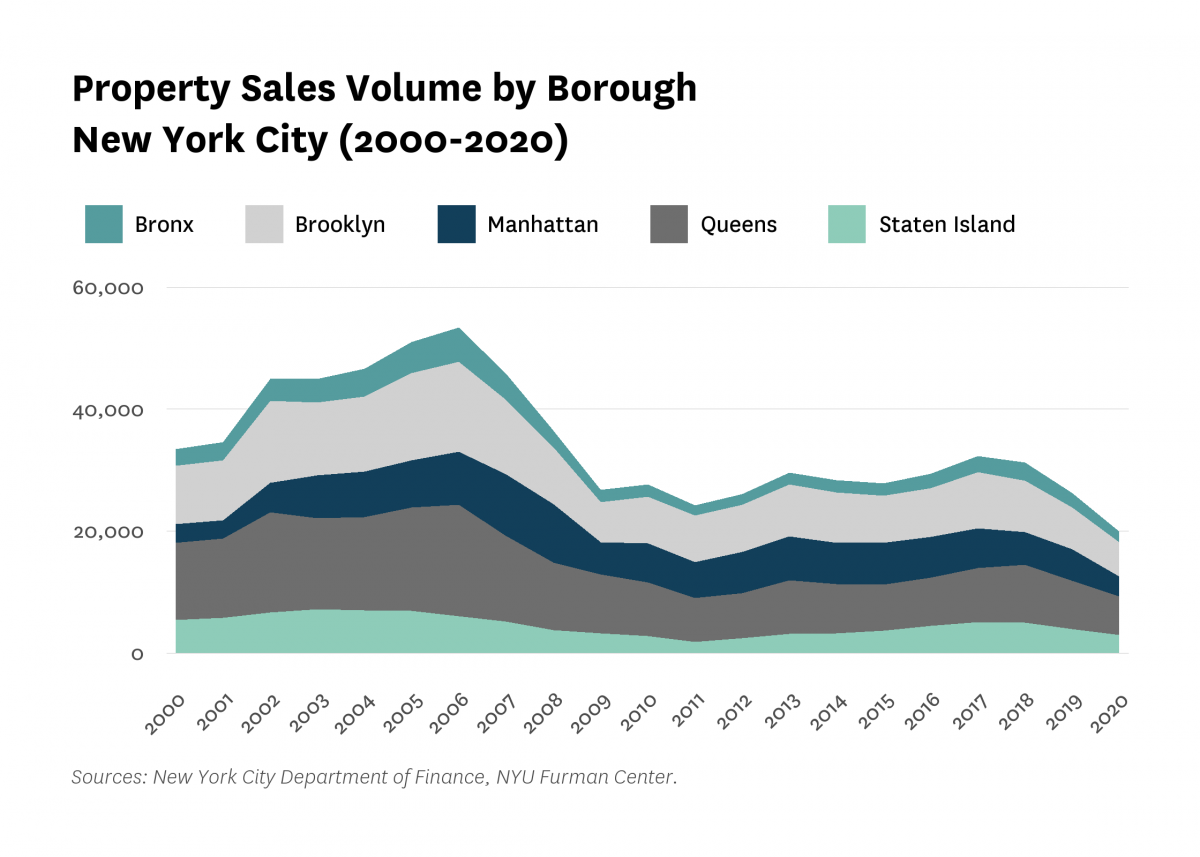
19,939 residential properties were sold in New York City during 2020, a decline of 24.1 percent from the prior year. Of all boroughs, Manhattan experienced the greatest decline in sales volume between 2019 and 2020 (-36.4%). The Bronx also saw a notable decline at 27.8 percent, followed by Staten Island, Queens, and Brooklyn (-23.4%, -21.1%, and -17.2%, respectively). These across the board decreases continued a trend that began between 2018 and 2019, when sales volume also declined across the city and in each borough. Overall, between 2018 and 2020, the Bronx saw a decline of 41.5 percent, followed by Staten Island, Manhattan, Queens, and Brooklyn (-39.2%, -37.8%, -34.6%, and -33.3% respectively).
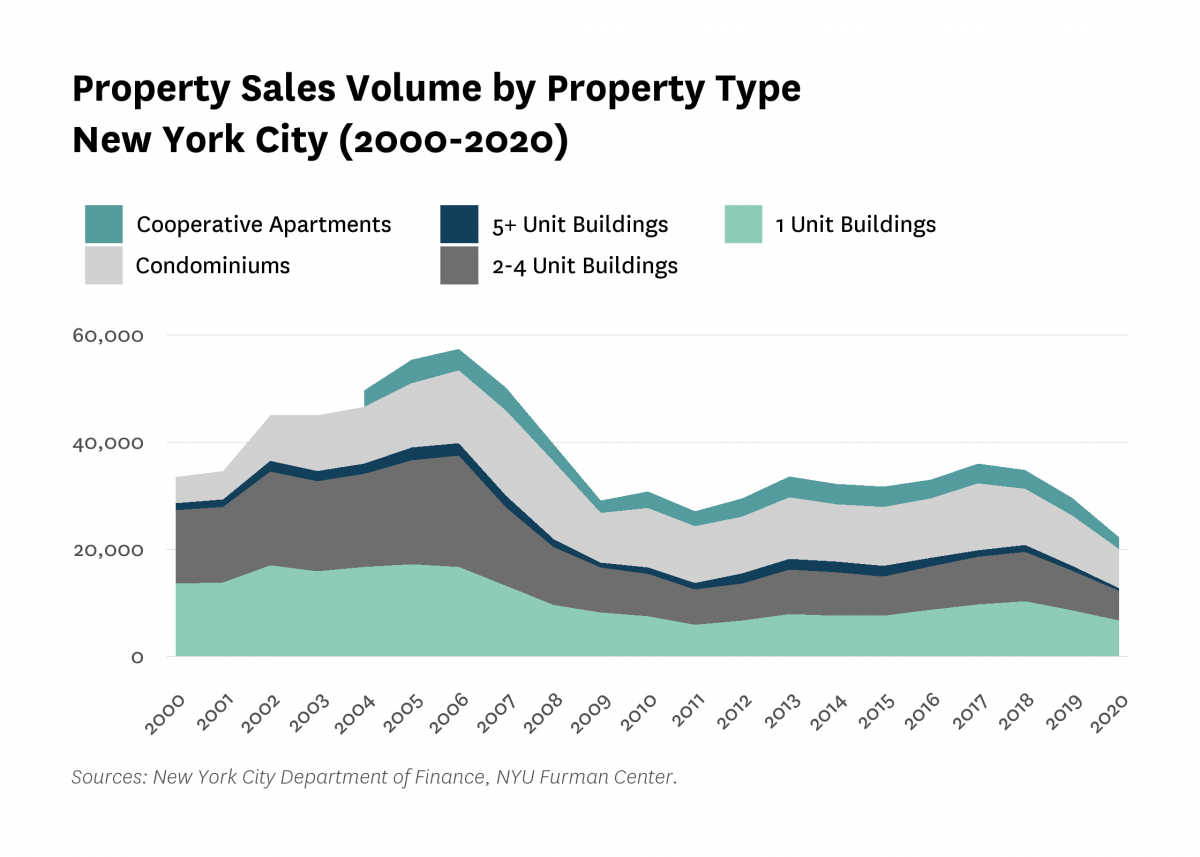
Sales volume declined for the third straight year across the city in 2020. Properties with five or more units experienced the greatest decline in the number of sales, dropping by 38.7 percent from the year before. Sales of cooperative apartments fell by a similar amount (32.6%). Two- to four-unit properties, condominiums, and single-unit properties each experienced a decrease in sales volume between 2019 and 2020 (-26.7%, -22.6%, -21.9%, respectively).
All content © 2005 – 2024 Furman Center for Real Estate and Urban Policy | Top of page | Contact Us