State of the City 2019
Across the country formal and informal residential evictions have garnered increased attention from advocates and policymakers. An increasing number of cities and states have focused on lowering eviction rates, perhaps none more aggressively than New York City. Recent national work documents large variation across cities in eviction rates,1 but there has been less work studying changes over time. Further, little research has been done on geographic variation in eviction rates among neighborhoods within cities.
This chapter aims to build a basic understanding of recent trends in eviction filings in New York City and how they vary among neighborhoods. To place New York City’s trends in a broader context, we begin with a cross city comparison of eviction filings in New York City and three other large U.S. cities. We then examine New York City eviction filings at the city and borough levels in more detail, followed by a series of analyses by ZIP Code areas. We describe variation in eviction filing rates across ZIP Code areas and assess how areas with higher filing rates differ from those with lower rates with respect to racial and ethnic composition of the population as well as economic and housing characteristics. We conduct similar analysis on the changes in filing rates between 2013 and 2019.
This report surfaces a number of key findings about eviction filings in New York City through 2019:
New York City evictions in context
Citywide and by borough
Eviction filing rates in 2019 across ZIP Code areas
Changes in eviction filing rates between 2013 and 2019 across ZIP Code areas
While our data only covers eviction filings through 2019, we are releasing this research in the midst of the COVID-19 crisis and impending recovery. The pandemic has struck New York City particularly hard, and the early impact of pausing the economy on job loss has been equally large. Governor Andrew Cuomo issued an executive order on March 7, 2020 establishing a 90-day moratorium on evictions, which has since been extended.3 Following suit, New York City housing courts stopped accepting any filings except for essential and emergency matters.4 With many eviction filings on pause and uncertainty about how the moratorium will be lifted and what the state of the economy will be at that point, it is not clear how eviction trends will change going forward. What is clear is that significant racial and ethnic disparities in eviction filings existed before the pandemic and the health and economic impacts of COVID-19 have similarly disproportionately affected Black and Hispanic communities. It is our hope that this information helps to inform a fair and inclusive recovery.
This chapter examines eviction filings, the first point in the formal eviction process at which a case is recorded in housing court data.5 There are many procedural steps between filing a case and any eventual warrant of eviction, for cases that end in a formal eviction. There are also numerous potential paths a case may take after it is filed that are not recorded in housing court data, including the tenant paying any owed rent and remaining in the unit or moving out to avoid a formal eviction. Because those types of outcomes are not observed in this dataset, we focus on eviction filings, as other researchers have done. Using data from the New York State Office of Court Administration, we look at all landlord-initiated cases filed in housing court (see Sidebar for recent policy updates).6 These include the two types of evictions that go through housing court: non-payment cases based on the allegation that a tenant has not paid rent, and holdover cases based on some other allegation (e.g., a lease violation, staying past the end of the lease, never having a valid lease, etc.).
To place New York City in a broader context, Figure 1 compares the city’s eviction filing rate over time to the filing rates of three other large U.S. cities: Chicago; Philadelphia; and Washington, D.C. There is considerable variation in filing rates across cities. Washington, D.C. consistently had the highest filing rate of the four cities at twice the rate in New York City and three times the filing rate in Philadelphia. New York City had the second highest rate with a rate twice as high as in Chicago. Undoubtedly, differences in population composition, economic conditions, eviction processes, data collection, and policy responses across cities each contributes to the large variation in filing rates.
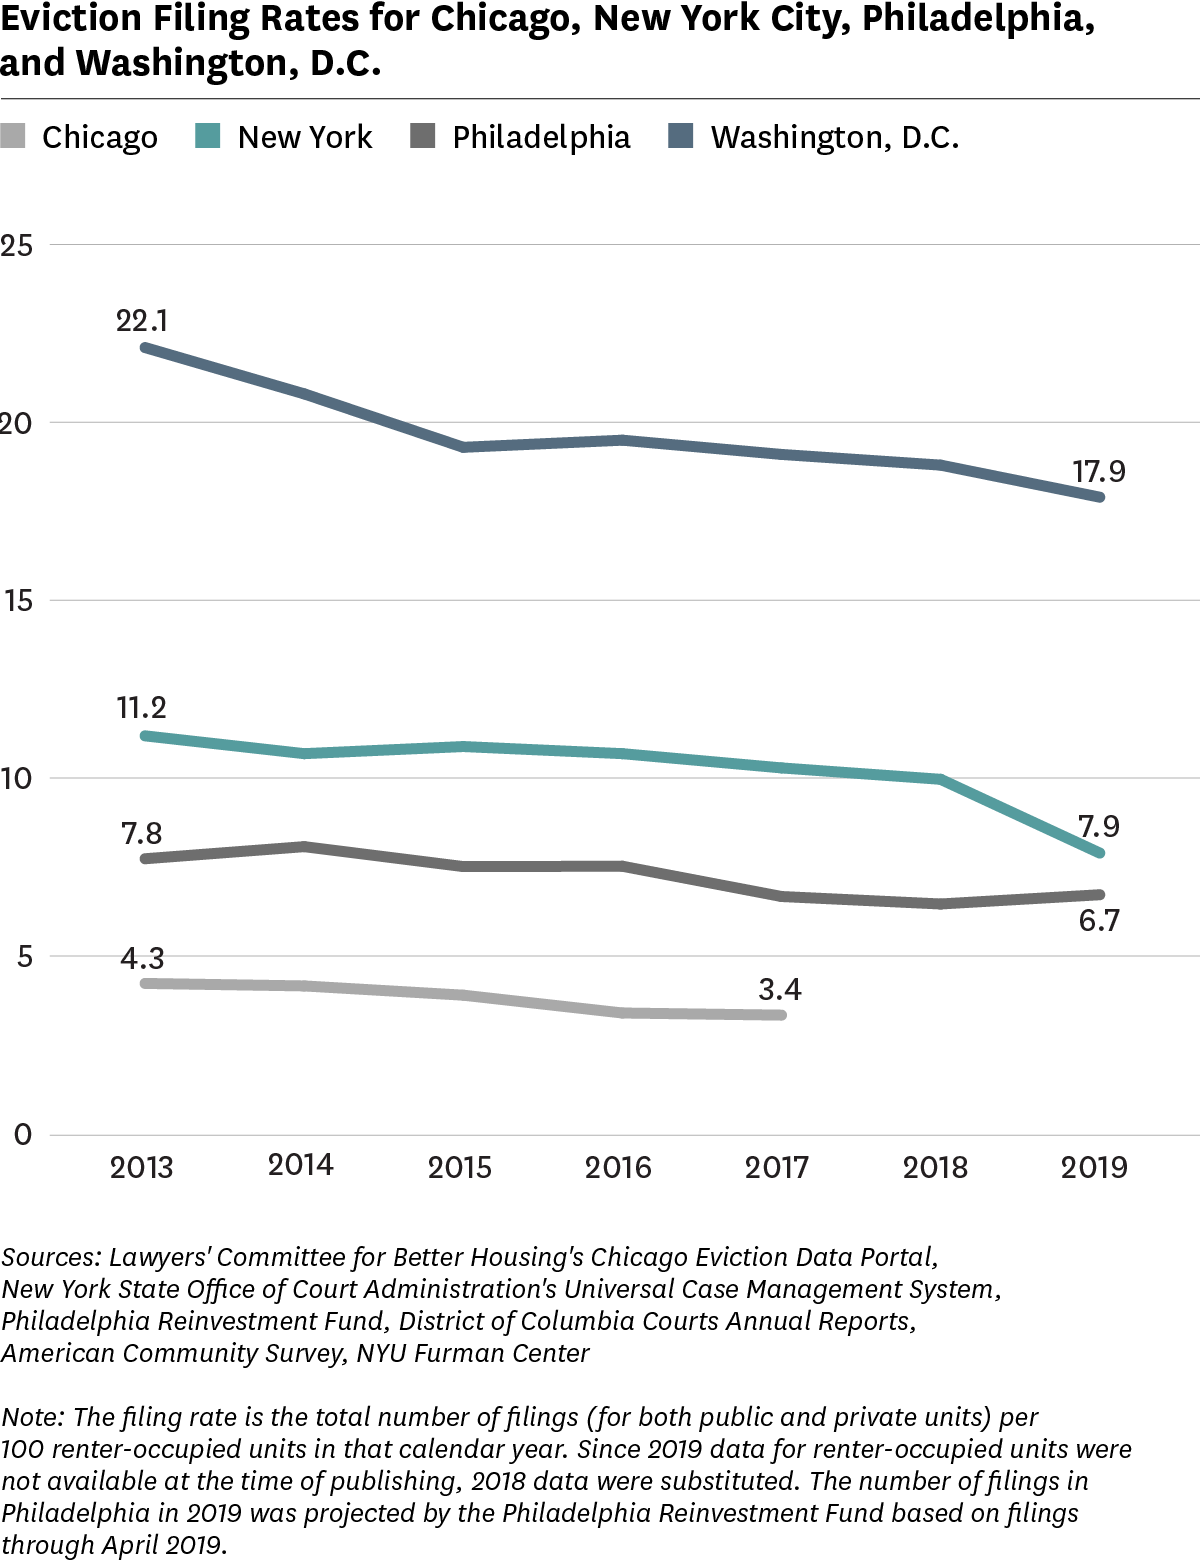
Beyond differences in levels of filing rates across these cities, what stands out most is the remarkably consistent declines; all four cities have seen reductions since at least 2013. While local policies likely play a role in any particular city’s decline in filing rate, the consistency of the downward trend suggests that a common factor, such as the continued economic expansion since 2009, also plays an important role in the decreased eviction activity.
Over the last decade, and particularly in the last two years, New York City experienced an overall decline in private eviction filings.10 Each borough also experienced a decline in eviction filings since at least 2016, though the Bronx has consistently had the highest filing number and rate across the city.
1. Citywide eviction filings decreased by almost 17 percent between 2018 and 2019, the city’s largest annual drop in the past decade.
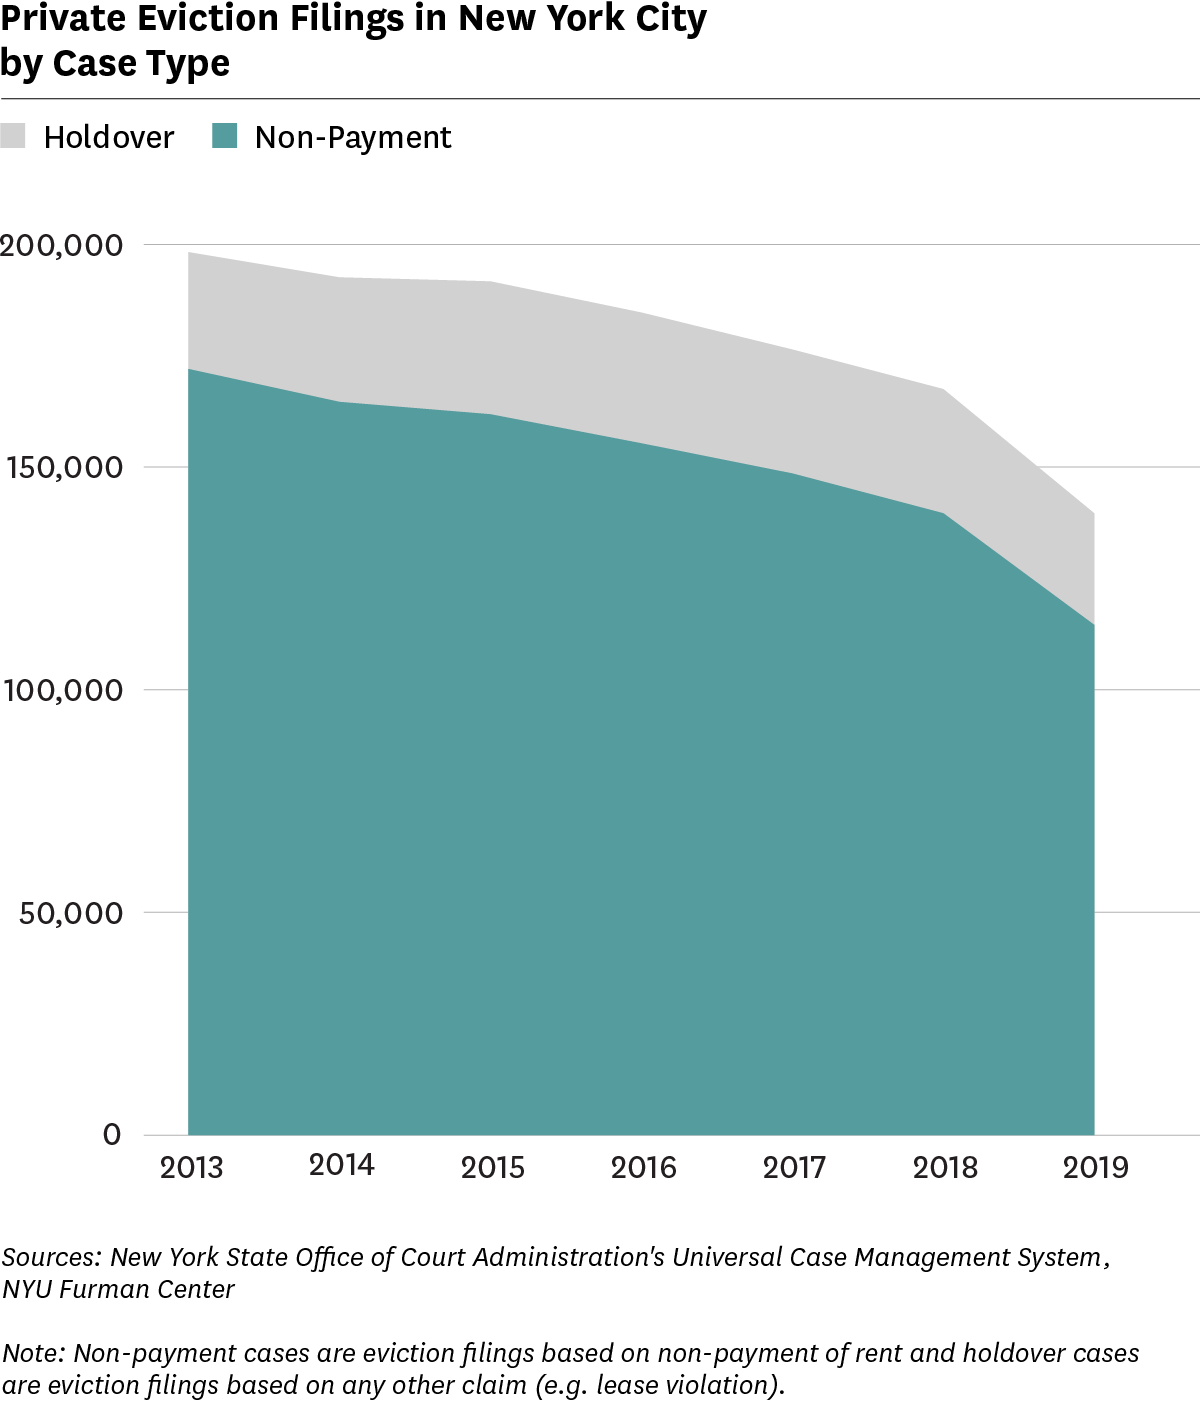
Between 2013 and 2019, total filings fell about one third from 198,283 filings in 2013 to 139,614 filings in 2019 (Figure 2). While filings decreased each year, the largest year to year decrease occurred between 2018 and 2019 when filings decreased by 16.7 percent. Eviction filings for non-payment of rent made up the majority (82.1%) of filings in 2019, though this type of filing experienced a slight decrease in share from 2018 (83.4%).
2. Eviction filing rates were generally twice as high in the Bronx as in the other boroughs, though the gap closed somewhat between 2016 and 2019.
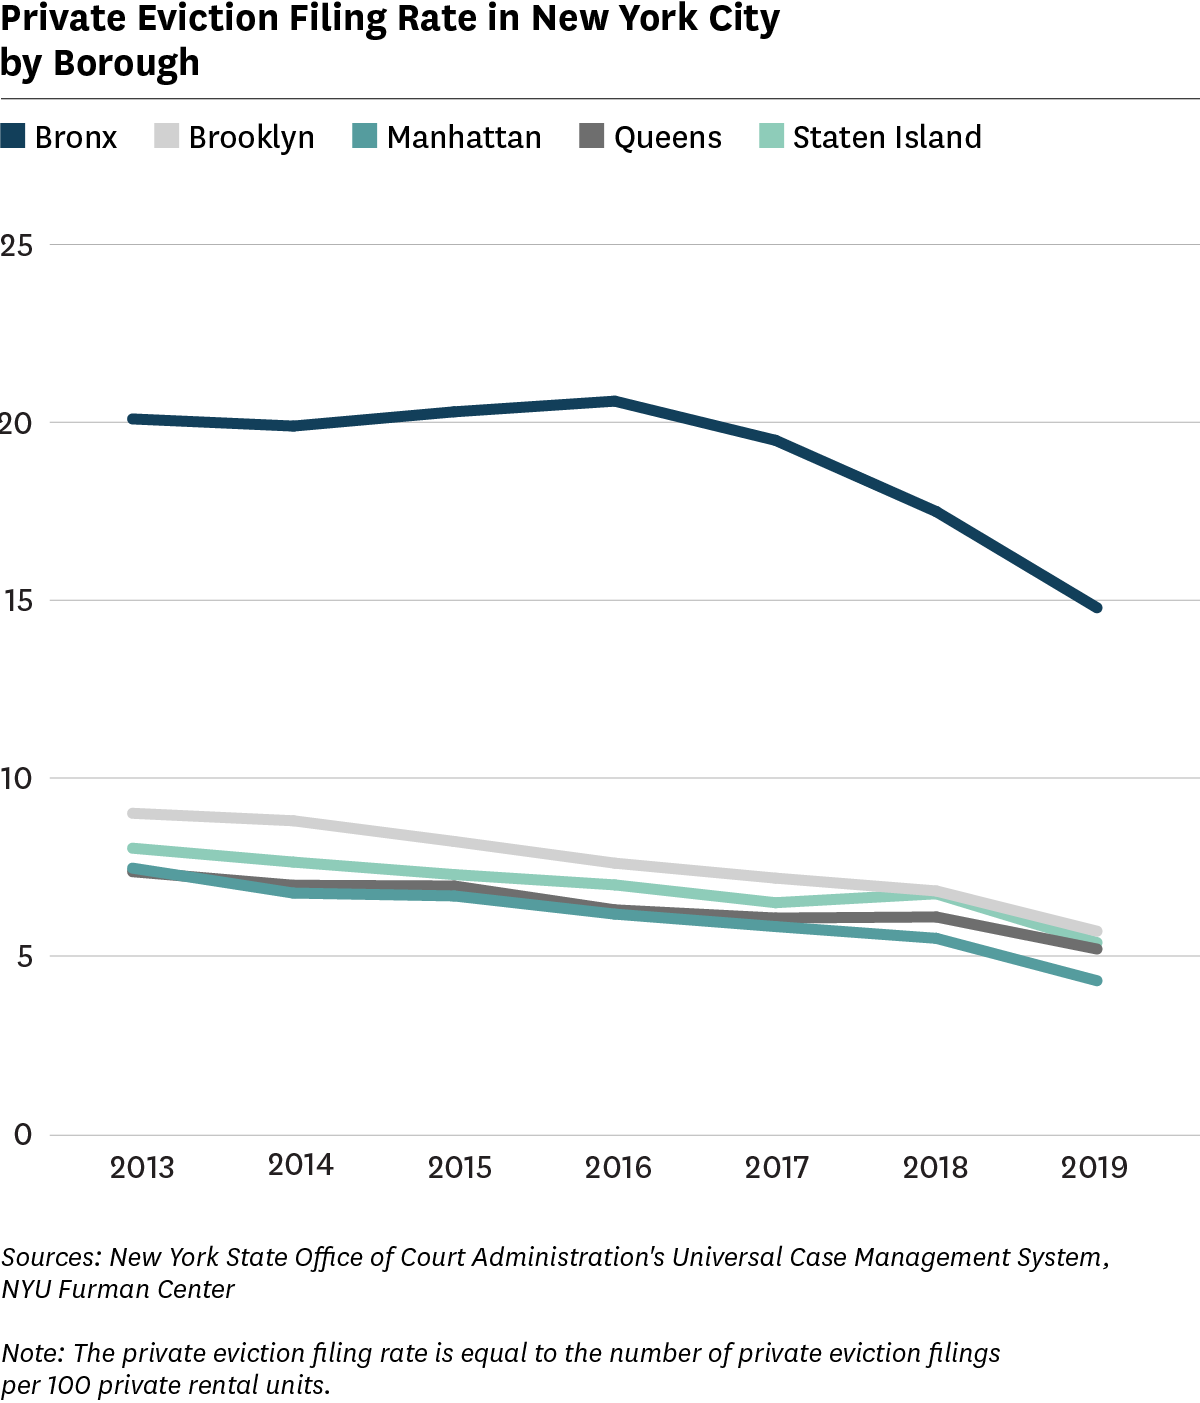
More than a third of total eviction filings in 2019 (38.5%) were in the Bronx, followed by Brooklyn (26.5%), Manhattan (16.8%), Queens (16.1%), and Staten Island (2.1%). Of course, the boroughs differ in size of both the population and rental stock. Normalizing the number of private eviction filings by the number of private rental units further highlights the Bronx’s status as an outlier (Figure 3). Whereas the rest of the boroughs experienced between 5 to 10 filings per 100 private rental units between 2013 and 2019, the filing rate was generally twice that in the Bronx, ranging from 15 to 20 filings per 100 private rental units. While the other boroughs follow the city’s downward trend in filings annually since 2013, the filing rate in the Bronx increased through 2016 before decreasing 25.2 percent between 2016 and 2019. Even with this large decline, the Bronx experienced 14.8 filings per 100 units in 2019, compared to 5.7 in Brooklyn, 5.4 in Staten Island, 5.2 in Queens, and 4.3 in Manhattan.
We next examine filing rates at the ZIP Code level11 and determine whether and how filing rates vary by neighborhood characteristics. To do this, we categorize ZIP Code areas according to their 2019 filing rate (number of private eviction filings per 100 private rental units) into three groups: the highest third, the middle third, and the lowest third.
1. Filing rates across ZIP Code areas varied widely, with areas in the top third having filing rates 6.5 times the filing rates in the bottom third.
There was considerable variation in filing rates among ZIP Code areas (Table 1). The average filing rate for areas in the top third of filing rates was 2.6 times the filing rate for areas in the middle third and 6.5 times the filing rate for areas in the bottom third. The area with the highest filing rate in 2019 had 22.7 eviction filings per 100 rentals, while the area with the lowest had less than one filing per 100 units.
| Highest Third | Middle Third | Lowest Third | |
|---|---|---|---|
| Mean Rate | 13.0 | 5.0 | 2.0 |
| Min Rate | 8.4 | 3.1 | 0.7 |
| Max Rate | 22.7 | 8.4 | 2.9 |
2. The areas with the highest filing rates in 2019 were in the Bronx, northern Manhattan, eastern Queens, eastern Brooklyn, and northern Staten Island.
Figure 4 shows the spatial distribution of the three categories of ZIP Code areas. The areas with the highest filing rates for 2019 were concentrated in the Bronx, eastern Queens, and eastern Brooklyn, with a few areas also in northern Manhattan and northern Staten Island. Conversely, the areas with the lowest filing rates were mostly located in lower Manhattan, western Brooklyn, western Queens, and lower Staten Island; none were in the Bronx.
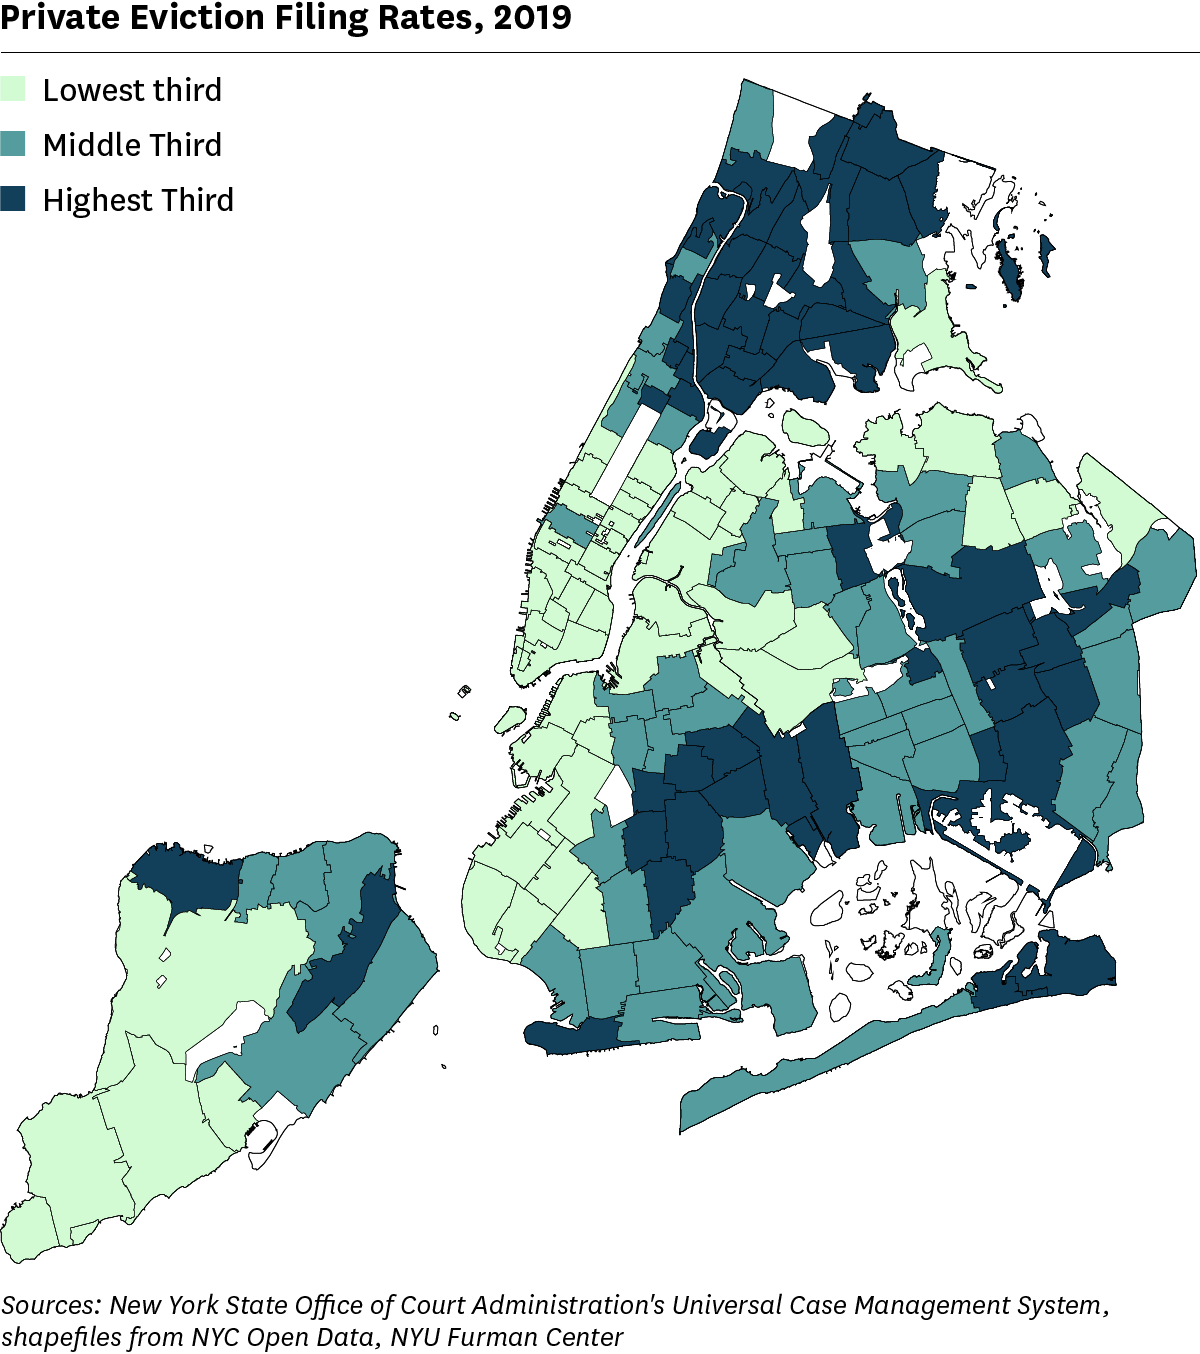
Table 2 identifies the ten ZIP Code areas with the highest filing rates in 2019: seven areas were in the Bronx, two in Queens, and one in Manhattan. The top four areas had filing rates of above 20 filings per 100 units (or 1 eviction filing for every 5 units). At the other end of the spectrum, the areas with the lowest filing rates had less than 1 filing per 100 private rental units.
| ZIP Code | Borough | Community Districts | 2019 Filings | 2019 Rate |
|---|---|---|---|---|
| 10464/10475 | Bronx | Wakefield/Williamsbridge/Woodlawn; |
356 | 22.7 |
| 11430/11434 | Queens | Queens Village/Cambria Heights/Rosedale; |
1,343 | 21.6 |
| 10453 | Bronx | Bedford Park/Fordham North/Norwood; |
5,428 | 20.8 |
| 10039 | Manhattan | Central Harlem; |
1,112 | 20.2 |
| 11692 | Queens | Far Rockaway/Breezy Point/Broad Channel |
560 | 18.9 |
| 10474 | Bronx | Hunts Point/Longwood/Melrose |
679 | 18.8 |
| 10457 | Bronx | Concourse/Highbridge/Mount Eden; |
4,690 | 18.5 |
| 10456 | Bronx | Hunts Point/Longwood/Melrose; |
4,105 | 18.4 |
| 10460 | Bronx | Castle Hill/Clason Point/Parkchester; |
3,620 | 18.1 |
| 10451 | Bronx | Hunts Point/Longwood/Melrose; |
2,404 | 16.7 |
3. The areas with higher filing rates in 2019 had much higher Black and Hispanic population shares and were more economically disadvantaged than the areas with the lower filing rates.
Table 3 compares the highest third, middle third, and lowest third areas based on 2019 filing rate across several indicators (the full table is in Appendix A).
| Highest Third | Middle Third | Lowest Third | City | |
|---|---|---|---|---|
| Race & Ethnicity | ||||
| Share Asian | 6.2% | 19.8% | 16.6% | 13.8% |
| Share Black | 39.5% | 18.6% | 4.1% | 21.9% |
| Share Hispanic | 40.8% | 24.9% | 19.4% | 29.1% |
| Share White | 11.0% | 32.9% | 57.3% | 32.1% |
| Economic Characteristics | ||||
| Poverty Rate | 25.1% | 16.3% | 14.0% | 18.9% |
| Median Renter Income | $35,391 | $48,182 | $74,386 | $46,918 |
| Share College Educated | 23.6% | 36.4% | 53.7% | 37.4% |
| Median Rent Burden | 34.3% | 32.2% | 27.9% | 31.9% |
There were large differences in the race and ethnicity of residents of areas with high versus low filing rates. Strikingly, the share of the population that is Black in the areas with the highest filing rates (39.5%) was almost ten times the share in areas with the lowest filing rates (4.1%) and almost twice the share in the city as a whole (21.9%). Similarly, although less dramatic, the share of the population that is Hispanic in the highest filing areas (40.8%) was over twice the share in the lowest filing areas (19.4%).
As for economic conditions, the poverty rate in the areas with the highest filing rates (25.1%) was higher than the citywide rate (18.9%) and almost twice the rate in the areas with the lowest filing rates (14.0%). The rent burden (the median share of household income spent on rent) in the areas with the highest filing rates was 34.3 percent, while the median in the areas with the lowest filing rates is 27.9 percent (which is below the 30 percent threshold commonly used to define rent burden). Similar disparities exist for the share of the population with a college education as well as the median renter income.
We next examine the change in filing rates between 2013 and 2019 in each ZIP Code area.12 Similar to the analysis above, we categorize areas into three groups, here based on absolute changes in filing rates: the third of areas with the largest declines; the middle third; and the third with the smallest declines (which includes areas remaining relatively constant and with increasing filing rates). Citywide, the filing rate fell by 3.4 filings per 100 rental units over this period. While most areas also experienced a decline in filing rate between 2013 and 2019, seven areas experienced an increase and two saw a negligible change.
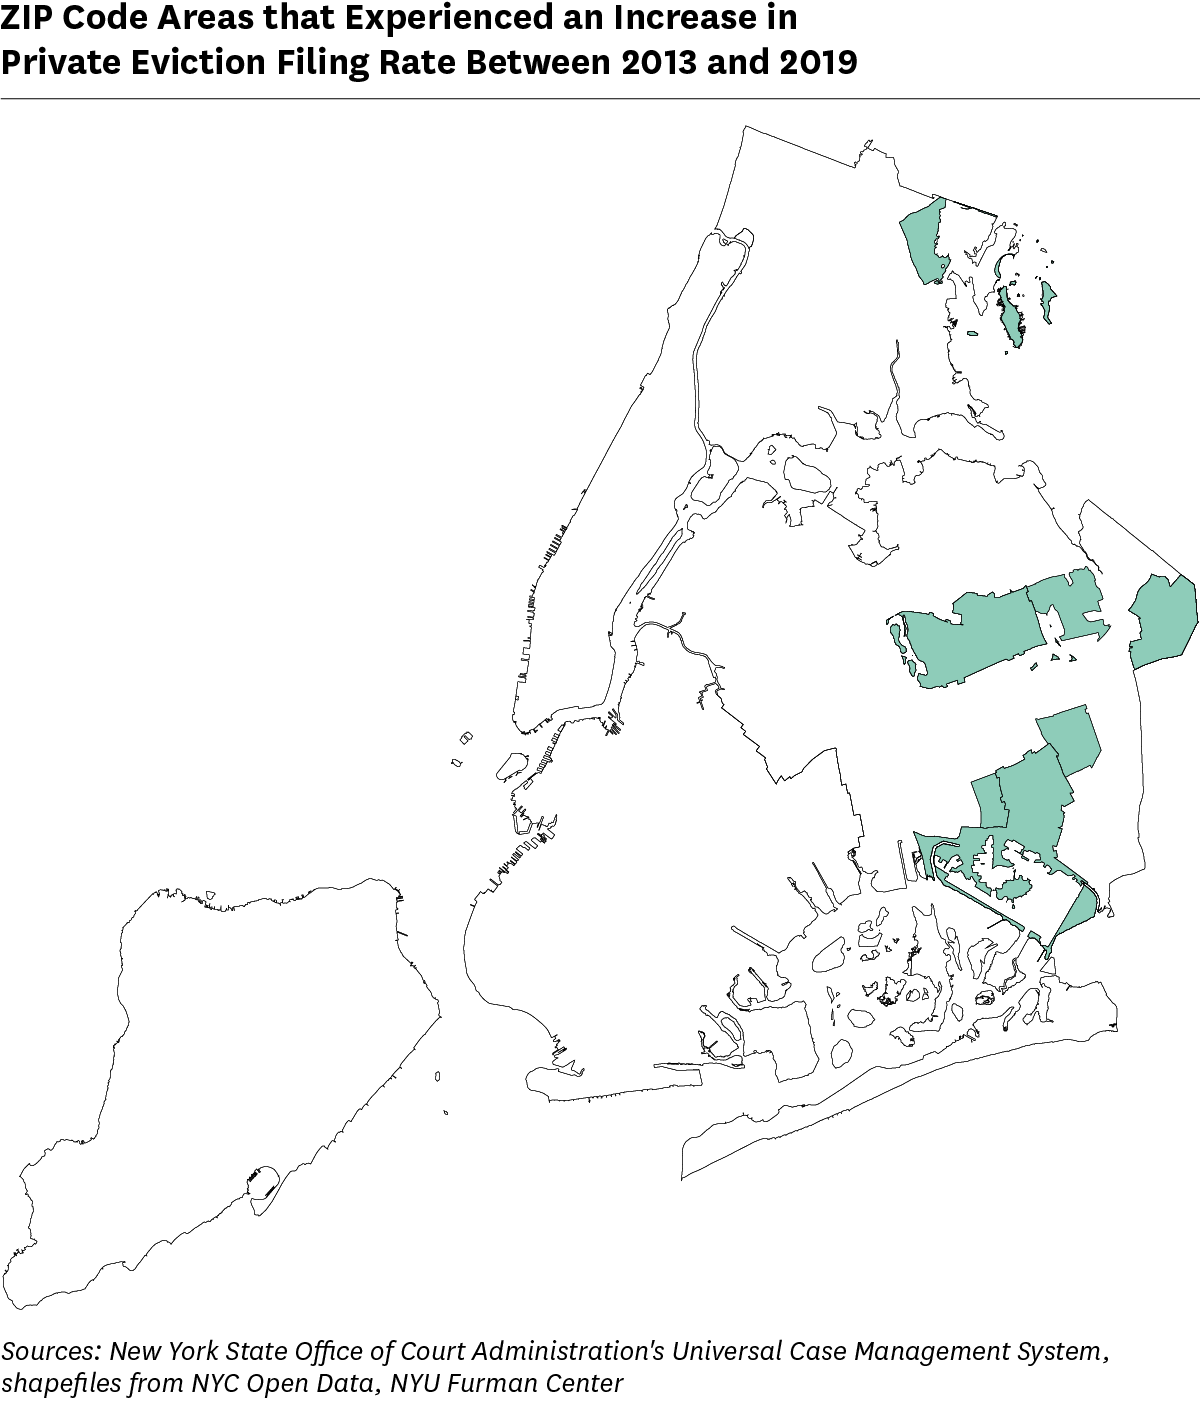
1. Filing rates increased in areas in eastern Queens and the Bronx, and many of these areas already had high filing rates.
Seven ZIP Code areas experienced an increase in filing rate of more than 0.1 filings per 100 units (Figure 5). All of the areas that experienced an increase in filing rate were either in Queens or the Bronx and most had fairly high filing rates in 2013 (Table 4). Two areas (10464/10475 in the Bronx and 11430/11434 in Queens) experienced double-digit increases and had the two highest filing rates in the city in 2019.
| ZIP Code | Borough | Community Districts | 2013 Filing Rate | 2019 Filing Rate | Absolute Change |
|---|---|---|---|---|---|
10464/ |
Bronx | Co-op City/Pelham Bay/Schuylerville; |
12.3 | 22.7 | 10.4 |
11430/ |
Queens | Howard Beach/Ozone Park; |
12.8 | 21.6 | 8.8 |
11365/ |
Queens | Flushing/Murray Hill/Whitestone; |
8.7 | 10.0 | 1.3 |
11001/ |
Queens | Queens Village/Cambria Heights/Rosedale |
3.7 | 4.4 | 0.7 |
11436 |
Queens | Jamaica/Hollis/St. Albans |
9.0 | 9.5 | 0.5 |
11364 |
Queens | Briarwood/Fresh Meadows/Hillcrest |
4.1 | 4.5 | 0.5 |
11412 |
Queens | Jamaica/Hollis/St. Albans |
9.2 | 9.5 | 0.4 |
2. Areas with the largest absolute declines in filing rates between 2013 and 2019 started with high filing rates in 2013.
The third of ZIP Code areas with the largest absolute declines in filing rates between 2013 and 2019 experienced an average decline (-6.3 filings per 100 units) that was almost eight times larger than the reduction experienced by the third experiencing the smallest absolute declines (-0.8) and almost twice the decline seen in the city overall (-3.4) (Table 5). To some extent, this difference is mechanical: absolute declines in filing rates can only be as large as the starting rates themselves, so perhaps it is not too surprising that the third with the largest decline also started with a much higher average filing rate in 2013 (17.6). In fact, seventy-eight percent of the areas within the third with the largest decline in filing rates between 2013 and 2019 were in the highest third of filing rates in 2013.
We see a somewhat different story when we examine percentage changes in filing rates: areas with absolute declines in the middle third experienced a larger percentage decrease in filing rates than either of the two other groups. Indeed, the areas with absolute declines in the middle third went from having a higher average filing rate in 2013 (5.4 filings per 100 units) than the areas in the bottom third of absolute declines (4.8) to having a lower average filing rate in 2019 (3.0 versus 4.0).
| Third with Largest Absolute Decline | Middle Third | Third with Smallest Decline or Increase | City | |
|---|---|---|---|---|
| Filing Rate | ||||
| Absolute Change (used for grouping) | -6.3 | -2.4 | -0.8 | -3.4 |
| Percent Change | -35.6% | -44.3% | -15.9% | -32.9% |
| 2013 | 17.6 | 5.4 | 4.8 | 10.2 |
| 2019 | 11.4 | 3.0 | 4.0 | 6.9 |
3. The areas with the largest absolute filing rate declines between 2013 and 2019 had much higher Black and Hispanic population shares and were more economically disadvantaged.
The third of ZIP Code areas with the largest absolute declines in filing rates had populations that were disproportionately Black and Hispanic, had higher poverty rates and rent burdens, had lower median renter incomes, and lower shares of residents with a college education than the third with the smallest absolute declines (Table 6). This is consistent with the findings in Table 3 (comparing the highest third and lowest third areas based on filing rates in 2019) that these racial and economic characteristics are associated with higher filing rates since the areas with the largest absolute declines had higher filing rates in 2013.
| Third with Largest Absolute Decline | Middle Third | Third with Smallest Decline or Increase | City | |
|---|---|---|---|---|
| Race & Ethnicity | ||||
| Share Asian | 6.1% | 16.2% | 17.2% | 12.9% |
| Share Black | 38.4% | 14.5% | 13.8% | 22.7% |
| Share Hispanic | 40.7% | 23.8% | 20.1% | 28.7% |
| Share White | 12.5% | 42.5% | 46.3% | 33.1% |
| Economic Characteristics | ||||
| Poverty Rate | 27.6% | 16.4% | 16.2% | 20.3% |
| Median Renter Income | $33,743 | $54,840 | $49,428 | $40,648 |
| Share College Educated | 23.7% | 43.0% | 35.9% | 34.5% |
| Median Rent Burden | 33.4% | 30.4% | 30.7% | 31.9% |
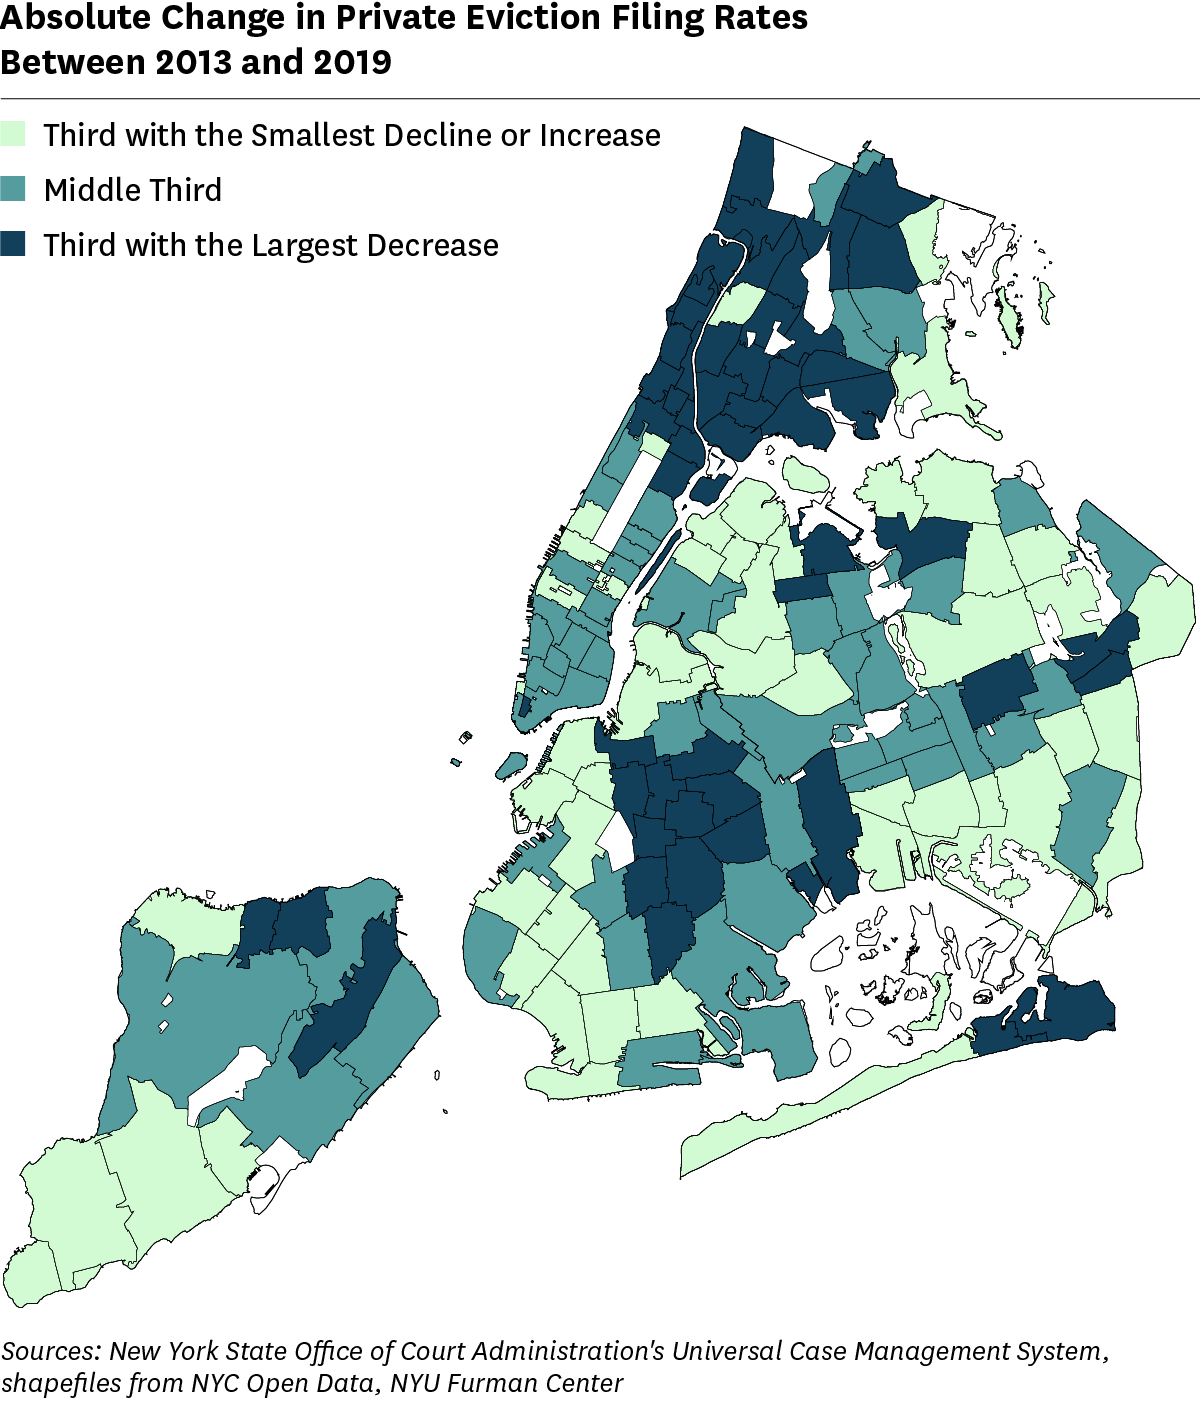
4. The areas experiencing the largest absolute declines in filing rates were in the Bronx, northern Manhattan, central Brooklyn, northern Staten Island, and the Rockaways.
Figure 6 shows the spatial distribution of the three categories of ZIP Code areas based on the change in filing rates between 2013 and 2019. Many ZIP Code areas within the Bronx were in the top third of declines. Other areas experiencing large declines in filing rates were in northern Manhattan, central Brooklyn, northern Staten Island, and the Rockaways in Queens.
5. While there were sizable declines in filing rates between 2013 and 2019, few areas shifted to a different third.
To assess the extent to which ZIP Code areas’ relative ranking of filing rates changed between 2013 and 2019, we calculated the share of areas in the highest, middle, and lowest third of filing rates in 2013 that ended up in the highest, middle, and lowest third of filing rates in 2019 (Table 7). We see a high degree of persistence, especially among the highest and lowest thirds. The high degree of persistence in ranking can be seen most clearly along the diagonal, which reports the share of ZIP Code areas in the same category in 2019 as in 2013. Ninety-one percent of areas that began the time period with filing rates in the highest third remained there in 2019. Nine percent had filing rates in the middle third in 2019, and none had rates that were in the lowest third. Among areas with filing rates in 2013 in the lowest third, the other end of the distribution, eighty-nine percent continued to have filing rates in the lowest third in 2019.
| 2013 Ranking | 2019 Ranking | ||
|---|---|---|---|
| Highest Third | Middle Third | Lowest Third | |
| Highest Third | 91% | 9% | 0% |
| Middle Third | 9% | 77% | 13% |
| Lowest Third | 0% | 11% | 89% |
Similar to the three other major cities examined in this chapter, eviction filing rates in New York City declined over the past decade, at least through 2019. This coincides with the longest economic expansion in U.S. history, potentially an important contributor to those declines. As New York City and the country now experience historically unprecedented levels of unemployment related to COVID-19, those city-wide eviction filing trends could be reversed in 2020.
Filing rates varied substantially across the city in 2019, with large disparities by the race and ethnicity of an area’s residents. The Bronx, the borough with the highest share of residents who are Black and Hispanic and with the lowest median income of all boroughs, had filing rates nearly twice as high in 2019 as the filing rates in each of the other boroughs. At the ZIP Code level, areas with higher filing rates also had a greater share of their population that was Black or Hispanic and had lower incomes. Most ZIP Code areas did, however, experience declines in filing rates between 2013 and 2019. Those declines were largest in areas with higher filing rates in 2013, and hence were areas that were disproportionately Black and Hispanic. We should therefore be concerned about the potential disparate impact of any reversal of the downward trend in eviction filings caused by an economic recession.
The reduction in filing rates between 2013 and 2019, however, did little to change the relative ordering of neighborhoods with respect to eviction filings; nearly all of the ZIP Code areas in the top third of filing rates in 2013 remained there in 2019. Those neighborhoods disproportionately housed Black, Hispanic, and lower income households, communities that now differentially bear the health and economic impacts of COVID-19. Even a successful path of economic recovery would not likely remediate these disparities without intentionally striving to do so. In order to develop interventions that foster a more equitable and inclusive housing recovery, it will be particularly important to identify and monitor disparities in evictions that occur after the moratorium is lifted.
1 See: Eviction Lab, https://evictionlab.org/.
2 We use the term “Hispanic” to mirror the Census data used in the analysis.
3 New York Exec. Order No. 202.8 (March 7, 2020), https://www.governor.ny.gov/sites/governor.ny.gov/files/atoms/files/EO_202.8.pdf
4 New York City Human Resources Administration. “Legal Assistance” https://www.nycourts.gov/courts/nyc/SSI/images/CORONA/AO_Orders.pdf
5 Since the evictions we are looking at are filed with the court, this analysis does not include illegal lockouts or other forms of informal eviction.
6 We remove cases involving co-ops and condos because these units are not included in counts of total rental units in an area and our analysis relies on filing rates.
7 https://www1.nyc.gov/site/hra/help/legal-services-for-tenants.page; N.Y.C ADMIN code § 26-1301, et seq.
8 2018 N.Y.C. Local Law No. 1
9 NYS S.B. S6458 (2019)
10 We omit eviction filings in public housing, which have some additional regulatory requirements, from this analysis.
11 See methodology for our construction of ZIP Code areas.
12 We compare 2013 and 2019 because 2009-2013 and 2014-2018 are the two most recent, non-overlapping 5-year ACS surveys.
1. Data Sources
Universal Case Management System for Local Civil Courts
The New York State Office of Court Administration collects information on all cases filed within civil courts using the Universal Case Management System for Local Civil Courts. The New York City Housing Data Coalition processes a de-identified version of these data for landlord-tenant cases filed in New York City housing courts and makes it available in their New York City Database. The dataset contains the filing date, court of filing, basis of claim (non-payment or holdover), and all appearances before the court. The de-identified version provides only the ZIP Code of the property.
American Community Survey (ACS)
The ACS is an annual survey that collects data similar to those formerly collected by the Census long form. As with the long form, the ACS covers only a sample of individuals and housing units. However, the ACS uses a smaller sample: the long form covered one out of every six housing units while the ACS only covers one in 40 housing units each year. Our report uses the five-year estimates for 2009-2013 and 2014-2018. To approximate ZIP Codes, the Census Bureau created ZIP Code Tabulation Areas.
2. Definitions
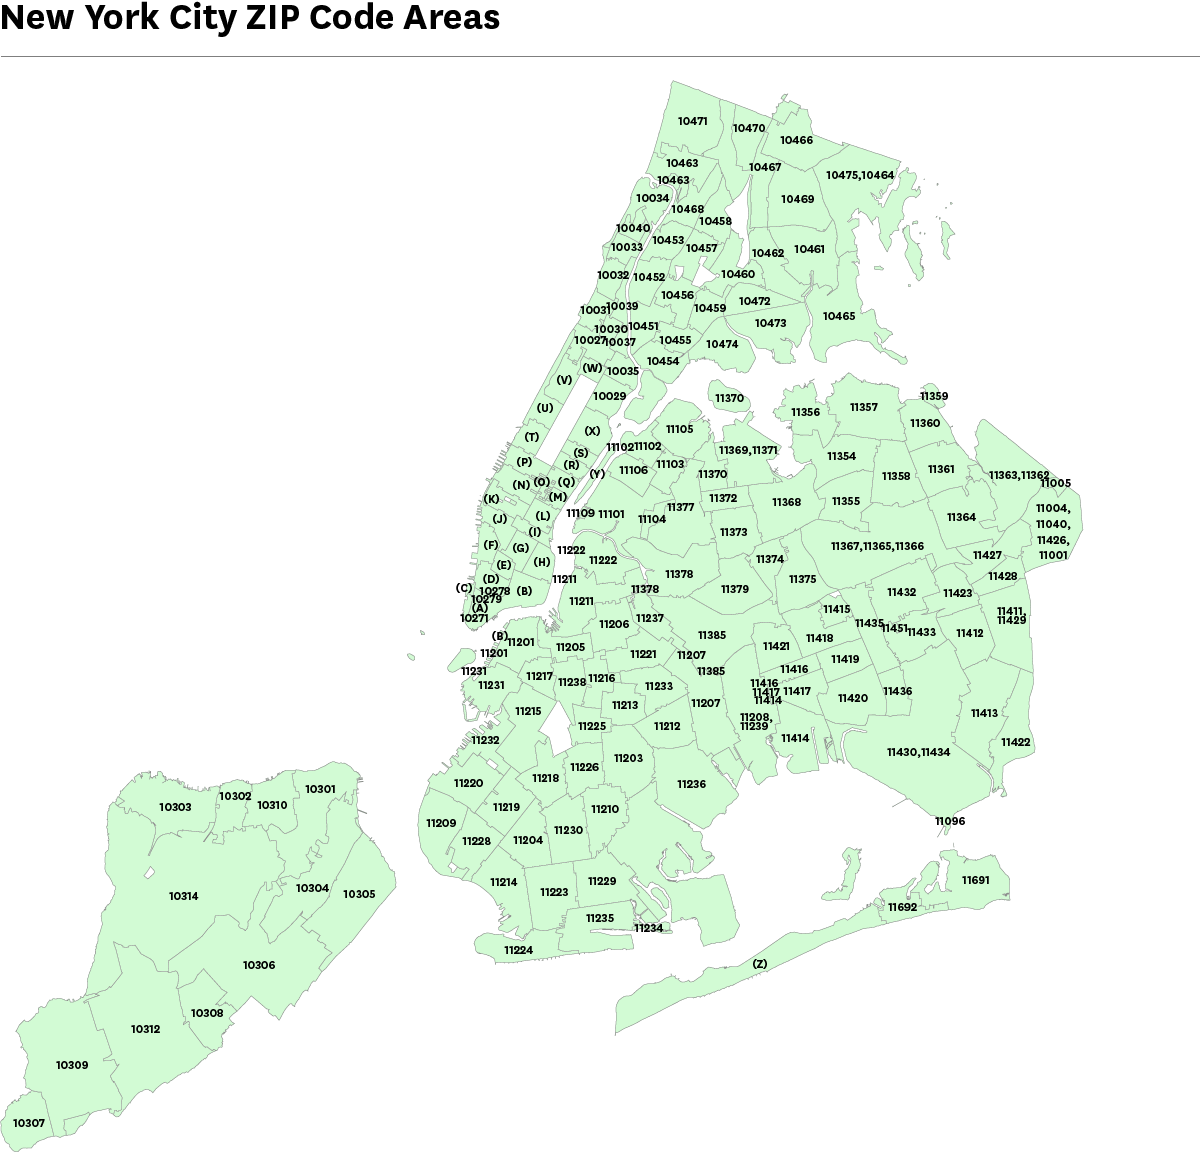
ZIP Code Area
Eviction filings were provided at the ZIP Code level using the ZIP Code of the address listed in each filing. Indicators using New York City administrative data were also aggregated at the ZIP Code level and could be directly joined to the filing data. Indicators from the Census Bureau’s American Community Survey, however, were aggregated at the ZIP Code Tabulation Area (ZCTA). ZCTAs are geographies that approximate ZIP Codes using Census tracts as a base, but they do not match perfectly to ZIP Codes. To ensure the best match, we created “ZIP Code areas.” First, we matched ZIP Codes to their corresponding ZCTAs. If a ZCTA contained fewer than 90 percent of a ZIP Code’s residential units, we combined ZCTAs that overlapped with the ZIP Code to create areas with at least 90 percent of the ZIP Code’s units. After all ZIP Codes were matched to a constructed ZIP Code area, we combined ZIP Code areas with fewer than 1,000 private rental units with a neighboring ZIP Code area. The terms “ZIP Code area” and “area” refer to these aggregations.
Private Rental Units
We estimated the number of private rental units using city administrative data on the number of residential units in each building. To do this, we first removed NYCHA buildings and buildings of condos and co-ops from the dataset. With these buildings removed, it is safe to assume that units in the remaining large buildings are all privately rented. Units in smaller buildings, however, could be owner occupied and not rented. To estimate the number of rented units in small buildings, we used the American Community Survey to calculate the renter rate by building size and by Census tract. We then used this rate to adjust the total number of residential units in buildings of 1-5 units based on the estimated renter rate of the given building size and Census tract.
Eviction Filing Rate
The filing rate is equal to the number of eviction cases filed in NYC Housing Court by private (non-NYCHA) landlords, excluding condos and co-ops, divided by the number of private rental units. Filings and units were aggregated and summed to calculate the rate of given geographies.
Change in Eviction Filing Rate
The change in filing rate, specifically between 2013 and 2019, is equal to the difference between the filing rate in 2019 and the filing rate in 2013 of a given geography.
ZIP Code Area Neighborhood Characteristics
Characteristics for New York City and each borough are calculated by the Census Bureau. To present the same characteristics at the ZIP Code area level using our combinations of ZCTAs, we needed to calculate the characteristics from the underlying data. For shares and rates, we pulled the variable of interest and the total surveyed population for each ZCTA, aggregated ZCTAs as needed to form the ZIP Code areas, summed these two values at the ZIP Code area level, and divided the total population by the variable of interest to get the rate or share. For medians, we pulled the entire frequency table of each ZCTA, aggregated ZCTAs as needed to form the ZIP Code areas, summed the frequencies of each value to form a new frequency table for the ZIP Code area, and then interpolated the median using methodology created by “Better Estimates from Binned Income Data: Interpolated CDFs and Mean-Matching”, by Paul T. von Hippel, David J. Hunter, McKalie Drown. Sociological Science, November 15, 2017, DOI 10.15195/v4.a26.
Inflation Adjustments
When reporting dollar amounts, we adjust to 2019 dollars using the Consumer Price Index for All Urban Consumers (Current Series) without seasonal adjustments from the Bureau of Labor Statistics over all major expenditure classes for the New York City metropolitan area. This allows for more consistent comparisons across years for individual indicators.
| Highest Third | Middle Third | Lowest Third | City | |
|---|---|---|---|---|
| Category Size | ||||
| Population | 32.9% | 31.1% | 36.0% | 100.0% |
| Renters | 33.8% | 25.8% | 40.4% | 100.0% |
| Rental Units | 24.6% | 19.4% | 56.0% | 100.0% |
| Filing Rate | ||||
| 2019 (used for ranking) | 13.1 | 5.0 | 2.1 | 6.9 |
| 2013 | 18.2 | 7.8 | 4.0 | 10.2 |
| Absolute Change | -5.1 | -2.8 | -1.9 | -3.4 |
| Percent Change | -27.8% | -35.7% | -46.7% | -32.9% |
| Race & Ethnicity | ||||
| Share Asian | 6.2% | 19.8% | 16.6% | 13.8% |
| Share Black | 39.5% | 18.6% | 4.1% | 21.9% |
| Share Hispanic | 40.8% | 24.9% | 19.4% | 29.1% |
| Share White | 11.0% | 32.9% | 57.3% | 32.1% |
| Other Demographics | ||||
| Share Foreign Born | 38.3% | 41.8% | 29.9% | 37.0% |
| Share Under 18 | 24.0% | 20.2% | 18.0% | 20.9% |
| Share Over 65 | 12.5% | 15.1% | 14.8% | 14.1% |
| Economic Characteristics | ||||
| Poverty Rate | 25.1% | 16.3% | 14.0% | 18.9% |
| Median Renter Income | $35,391 | $48,182 | $74,386 | $46,918 |
| Income Diverity Ratio (80/20) | 6.1 | 5.9 | 6.8 | 7.1 |
| Share College Educated | 23.6% | 36.4% | 53.7% | 37.4% |
| Median Gross Rent | $1,228 | $1,444 | $1,809 | $1,396 |
| Median Rent Burden | 34.3% | 32.2% | 27.9% | 31.9% |
| Housing Stock | ||||
| Share Renter | 76.8% | 60.4% | 63.7% | 67.3% |
| Rental Vacancy Rate | 2.8% | 3.3% | 4.4% | 3.4% |
| Share of Units in Buildings Under 10 Units | 27.7% | 39.5% | 37.4% | 34.2% |
| Share of Units Rent Regulated (2019) | 55.1% | 45.0% | 35.4% | 43.4% |
| Third with Largest Absolute Decline | Middle Third | Third with Smallest Decline or Increase | City | |
|---|---|---|---|---|
| Category Size | ||||
| Population | 31.9% | 34.8% | 33.3% | 100.0% |
| Renters | 34.6% | 34.7% | 30.6% | 100.0% |
| Rental Units | 25.2% | 48.2% | 26.7% | 100.0% |
| Filing Rate | ||||
| Absolute Change (used for grouping) | -6.3 | -2.4 | -0.8 | -3.4 |
| Percent Change | -35.6% | -44.3% | -15.9% | -32.9% |
| 2013 | 17.6 | 5.4 | 4.8 | 10.2 |
| 2019 | 11.4 | 3.0 | 4.0 | 6.9 |
| Race & Ethnicity | ||||
| Share Asian | 6.1% | 16.2% | 17.2% | 12.9% |
| Share Black | 38.4% | 14.5% | 13.8% | 22.7% |
| Share Hispanic | 40.7% | 23.8% | 20.1% | 28.7% |
| Share White | 12.5% | 42.5% | 46.3% | 33.1% |
| Other Demographics | ||||
| Share Foreign Born | 37.1% | 37.7% | 35.8% | 37.0% |
| Share Under 18 | 24.4% | 19.3% | 20.8% | 21.5% |
| Over 65 | 10.9% | 13.1% | 13.3% | 12.4% |
| Economic Characteristics | ||||
| Poverty Rate | 27.6% | 16.4% | 16.2% | 20.3% |
| Median Renter Income | $33,743 | $54,840 | $49,428 | $40,648 |
| Income Diversity Ratio (80/20) | 6.4 | 7 | 6.7 | 7.1 |
| Share College Educated | 23.7% | 43.0% | 35.9% | 34.5% |
| Median Gross Rent | $1,140 | $1,467 | $1,375 | $1,200 |
| Median Rent Burden | 33.4% | 30.4% | 30.7% | 31.9% |
| Housing Stock | ||||
| Share Renter | 79.1% | 65.2% | 57.6% | 67.8% |
| Rental Vacancy Rate | 4.1% | 3.8% | 3.4% | 3.8% |
| Share of Units in Buildings Under 10 Units | 26.4% | 32.9% | 48.6% | 34.2% |
| Share of Units Rent Regulated | 54.3% | 41.8% | 36.1% | 43.4% |
| (a) 10006 | (n) 10018, 10036 |
| (b) 10005, 10004, 10002, 10007, 10038, 10280 | (o) 10020 |
| (c) 10282 | (p) 10019 |
| (d) 10013 | (q) 10022 |
| (e) 10012 | (r) 10065 |
| (f) 10014 | (s) 10021 |
| (g) 10003 | (t) 10023, 10069 |
| (h) 10009 | (u) 10024 |
| (i) 10010 | (v) 10025 |
| (j) 10011 | (w) 10026 |
| (k) 10001 | (x) 10128, 10028, 10162, 10075 |
| (l) 10016 | (y) 10044 |
| (m) 10017 | (z) 11693, 11694, 11697 |
All content © 2005 – 2024 Furman Center for Real Estate and Urban Policy | Top of page | Contact Us