| Indicator | 2000 | 2006 | 2010 | 2019 | 2021 | 2022 |
|---|---|---|---|---|---|---|
| Population | ||||||
| Born in New York State | 38.5% | 34.6% | 38.6% | 39.3% | ||
| Disabled population | 8.3% | 11.7% | 13.8% | |||
| Foreign-born population | 53.3% | 50.3% | 50.1% | 43.7% | 45.5% | |
| Population | 208,414 | 208,867 | 205,414 | 204,096 | 216,768 | |
| Population aged 65+ | 9.9% | 12.5% | 12.0% | 15.6% | 18.0% | |
| Households | ||||||
| Households with children under 18 years old | 40.8% | 34.0% | 28.7% | 25.8% | 23.2% | |
| Single-person households | 34.0% | 32.0% | 36.7% | 31.9% | ||
| Race and Ethnicity | ||||||
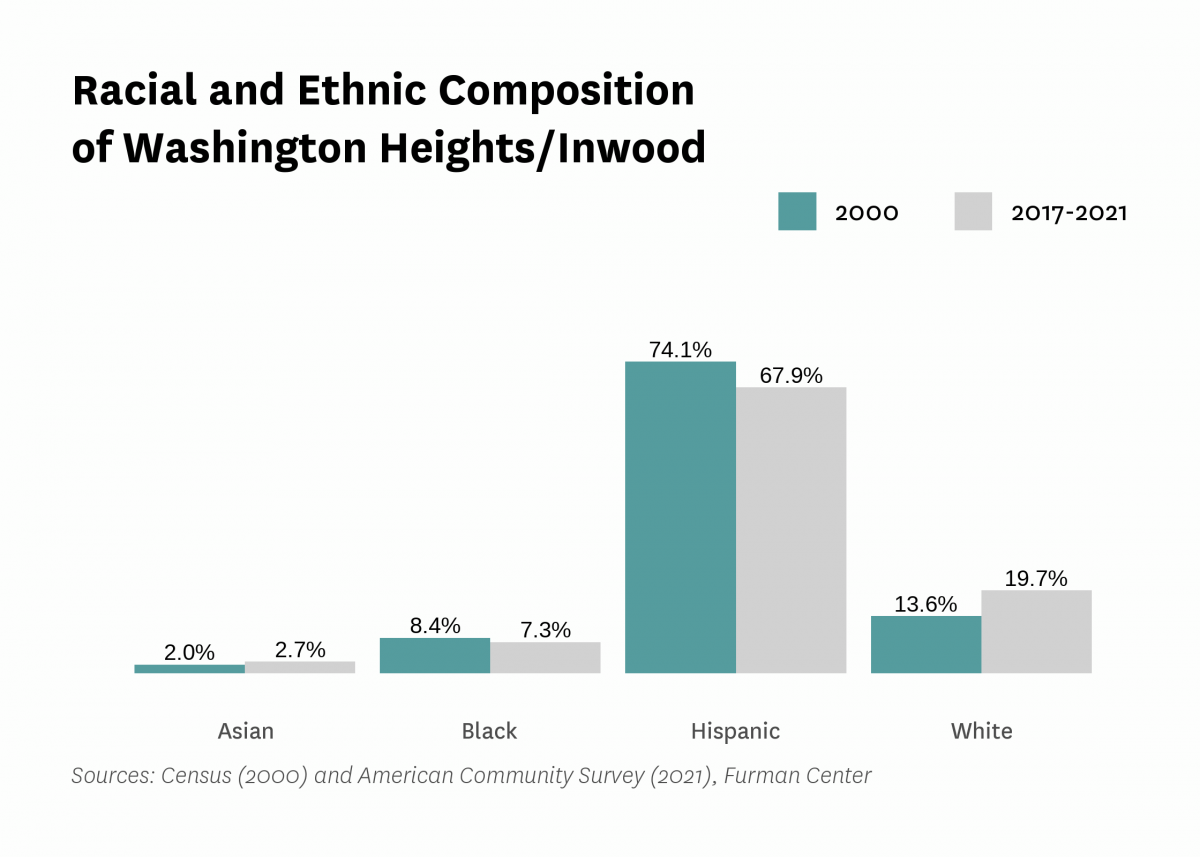
| Percent Asian | 2.0% | 1.4% | 2.0% | 2.5% | 2.7% | |
| Percent Black | 8.4% | 8.6% | 7.4% | 7.9% | 7.3% | |
| Percent Hispanic | 74.1% | 74.3% | 70.2% | 67.9% | 67.9% | |
| Percent white | 13.6% | 14.1% | 18.9% | 19.2% | 19.7% | |
| Racial diversity index | 0.43 | 0.42 | 0.47 | 0.49 | 0.49 | |
| Income and Poverty | ||||||
| Income diversity ratio | 5.5 | 4.7 | 5.7 | 5.8 | ||
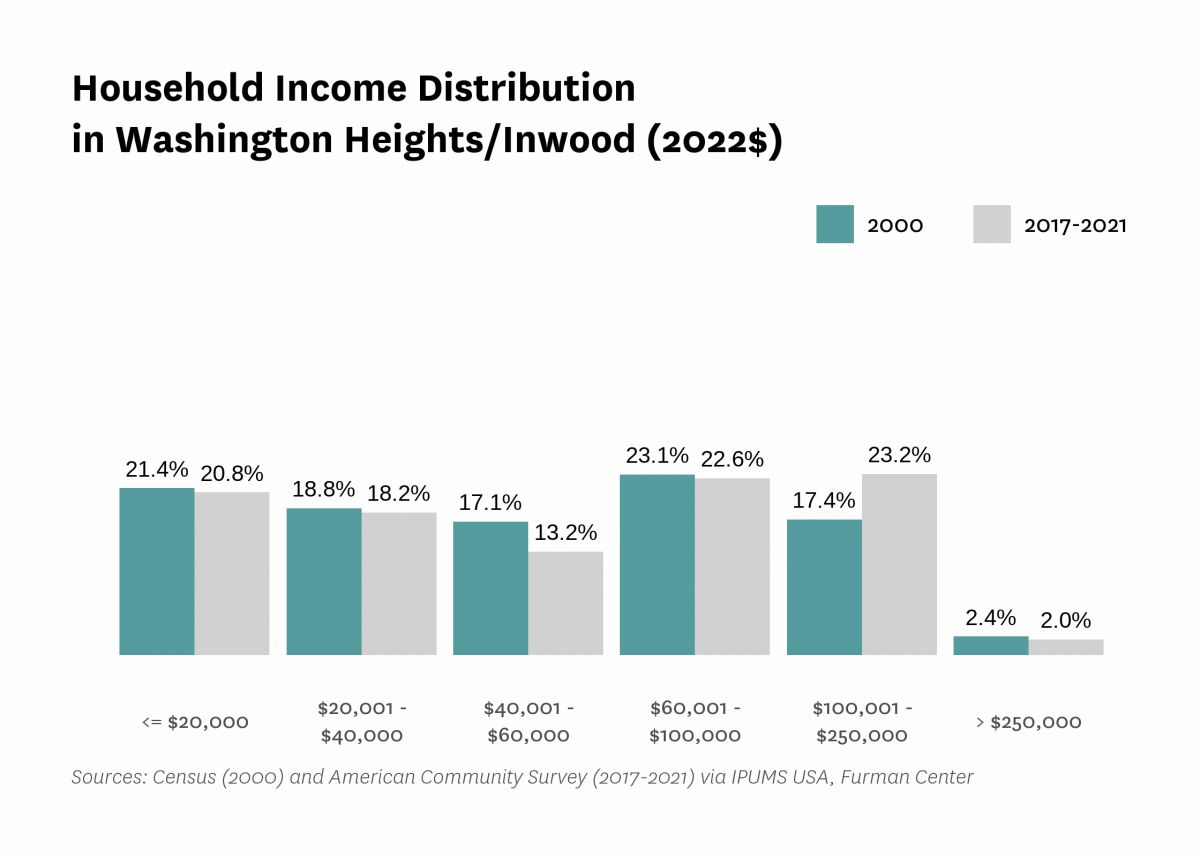
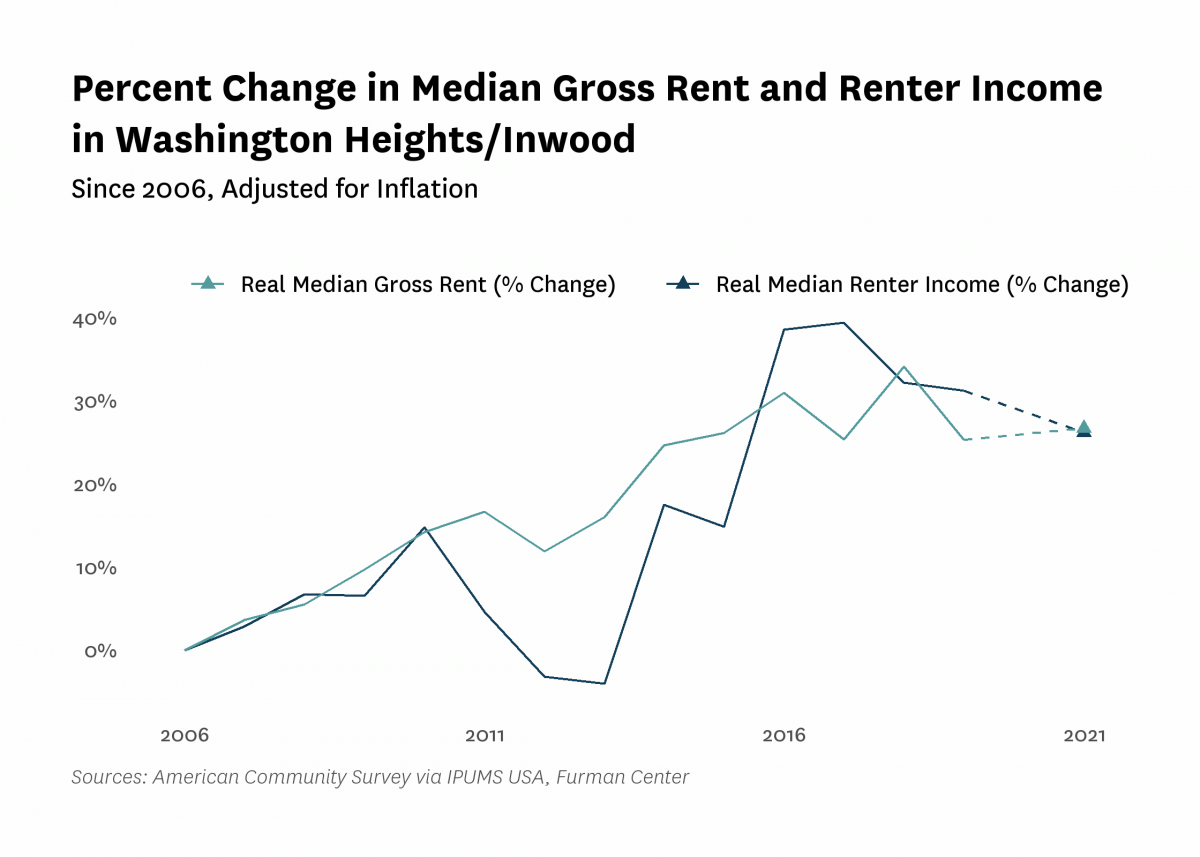
| Median household income (2022$) | $52,570 | $45,650 | $53,010 | $59,660 | $58,060 | |
| Median household income, homeowners (2022$) | $86,090 | $125,540 | $101,120 | $117,740 | ||
| Median household income, renters (2022$) | $42,890 | $49,240 | $56,300 | $54,130 | ||
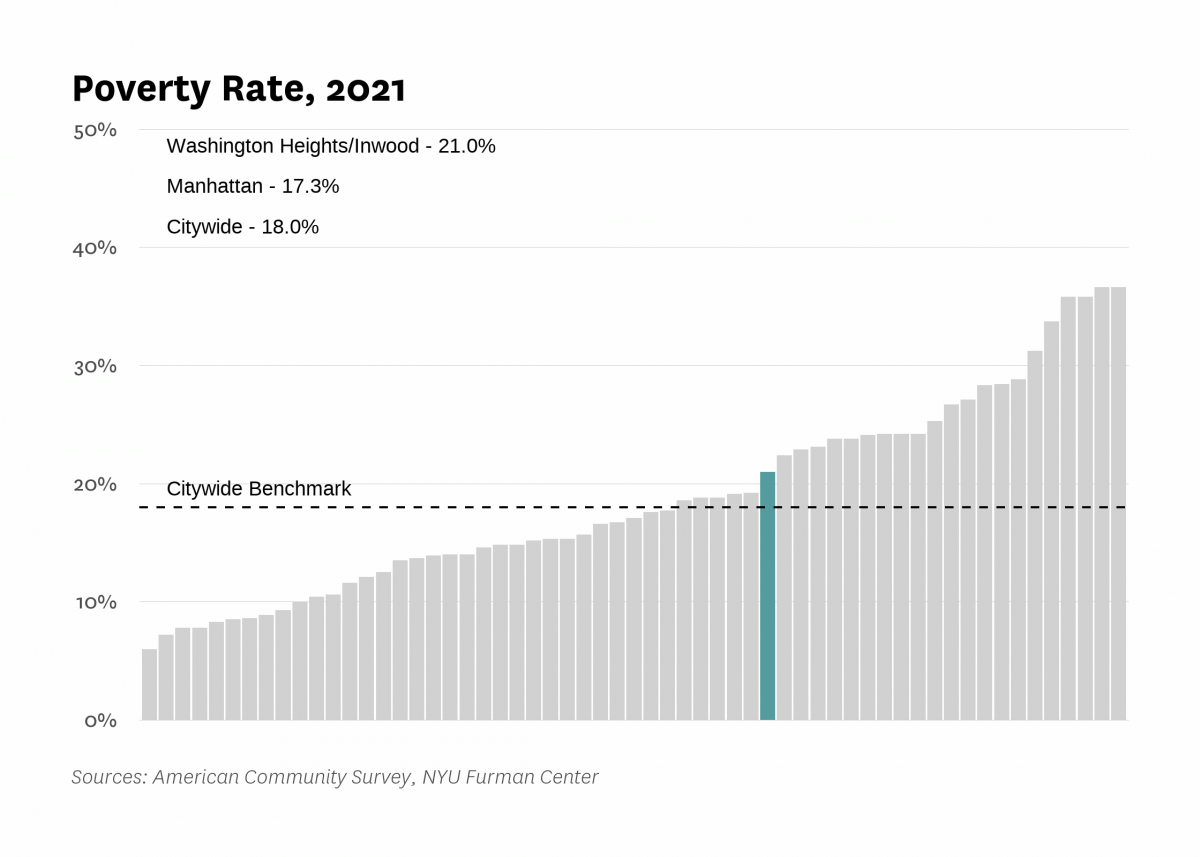
| Poverty rate | 29.8% | 28.1% | 19.5% | 15.5% | 21.0% | |
| Poverty rate, population aged 65+ | 21.2% | 22.0% | 29.2% | 23.0% | ||
| Poverty rate, population under 18 years old | 43.3% | 26.5% | 17.4% | 28.1% | ||
| Labor Market | ||||||
| Labor force participation rate | 62.9% | 67.0% | 67.5% | 62.7% | ||
| Population aged 25+ without a high school diploma | 32.4% | 33.3% | 25.0% | 23.8% | ||
| Unemployment rate | 14.52% | 11.34% | 13.59% | 6.16% | 18.57% | |
| Indicator | 2000 | 2006 | 2010 | 2019 | 2021 | 2022 |
|---|---|---|---|---|---|---|
| Housing Stock | ||||||
| Homeownership rate | 6.5% | 8.3% | 10.3% | 10.5% | 12.0% | |
| Housing units | 73,528 | 75,528 | 81,726 | 82,576 | ||
| Rental vacancy rate | 1.2% | 1.7% | 2.4% | |||
| Serious housing code violations (per 1,000 privately owned rental units) | 122.1 | 153.9 | 181.3 | 174.7 | 188.2 | |
| Severe crowding rate (% of renter households) | 3.9% | 5.0% | 4.9% | |||
| Total housing code violations (per 1,000 privately owned rental units) | 634.9 | 650.4 | 654.2 | 593.5 | 573.4 | |
| Finance - Distress | ||||||
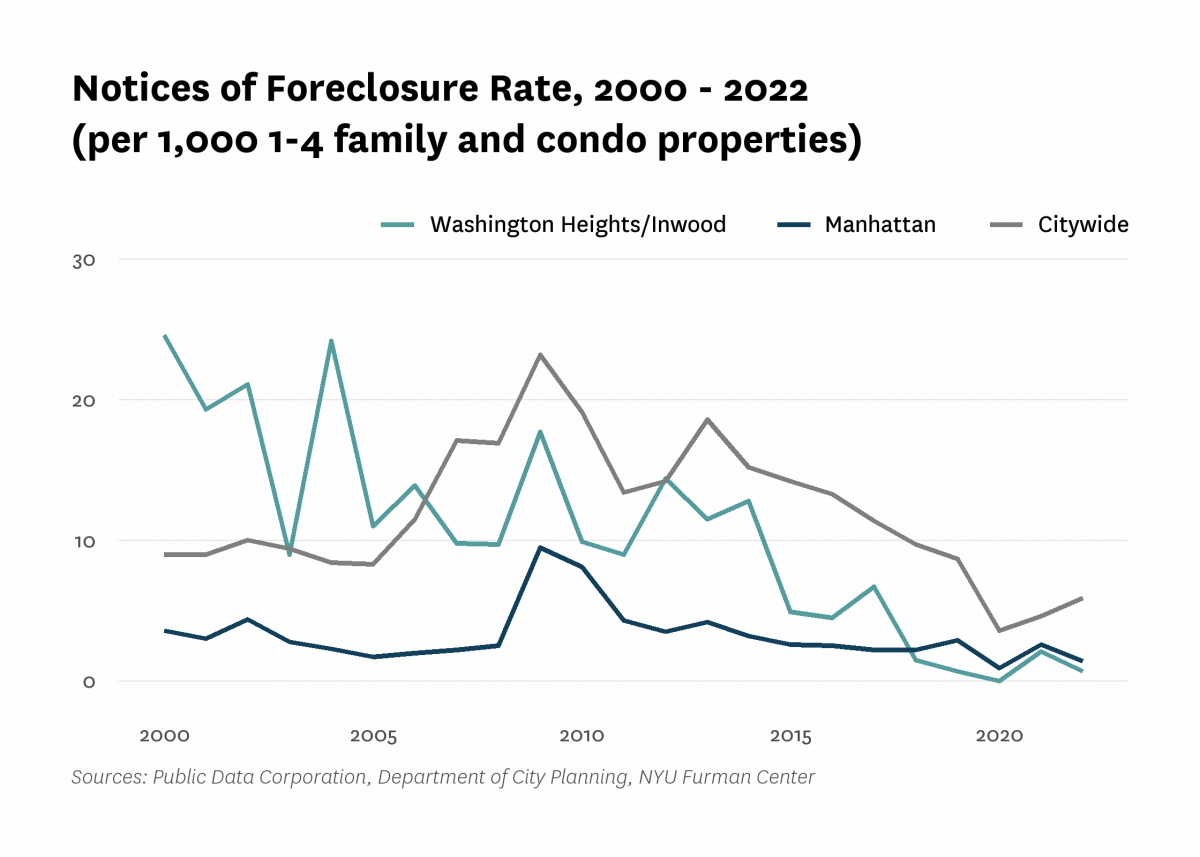
| Notices of foreclosure rate (per 1,000 1-4 family and condo properties) | 24.6 | 13.9 | 9.9 | 0.7 | 2.1 | 0.7 |
| Notices of foreclosure, all residential properties | 30 | 19 | 36 | 6 | 4 | 8 |
| Notices of foreclosure, initial, 1-4 family and condo properties | 13 | 8 | 10 | 1 | 2 | 0 |
| Notices of foreclosure, repeat, 1-4 family and condo properties | 1 | 1 | 1 | 0 | 1 | 1 |
| Pre-foreclosure notice rate (per 1,000 1-4 family and condo properties) | 11.8 | 15.2 | 32.2 | |||
| Pre-foreclosure notices, 1-4 family and condo properties | 16 | 21 | 45 | |||
| Properties entering REO, 1-4 family | 1 | 0 | 1 | |||
| Finance - Lending | ||||||
| FHA/VA-backed home purchase loans (% of home purchase loans) | 0.0% | 0.0% | 0.0% | 0.0% | ||
| Higher-cost home purchase loans (% of home purchase loans) | 2.4% | 0.0% | 0.4% | 0.0% | ||
| Higher-cost refinance loans (% of refinance loans) | 10.3% | 0.0% | 0.0% | 0.5% | ||
| Home purchase loan rate (per 1,000 properties) | 36.5 | 17.8 | 22.8 | 27.4 | ||
| Home purchase loans in LMI tracts (% of home purchase loans) | 46.3% | 9.7% | 47.4% | 41.6% | ||
| Home purchase loans to LMI borrowers (% of home purchase loans) | 4.4% | 45.9% | 2.9% | 6.7% | ||
| Refinance loan rate (per 1,000 properties) | 17.8 | 22.7 | 10.1 | 33.5 | ||
| Sales - Volume | ||||||
| Sales volume, 1 family building | 1 | 5 | 6 | 0 | 3 | 4 |
| Sales volume, 2-4 family building | 8 | 20 | 1 | 6 | 5 | 13 |
| Sales volume, 5+ family building | 36 | 66 | 35 | 40 | 30 | 32 |
| Sales volume, condominium | 8 | 17 | 27 | 77 | 62 | 47 |
| Sales volume, all property types | 53 | 108 | 69 | 123 | 100 | 96 |
| Sales - Median Prices | ||||||
| Median sales price per unit, 1 family building (2022$) | $220,920 | $1,032,870 | $434,890 | $2,652,560 | $1,208,750 | |
| Median sales price per unit, 2-4 family building (2022$) | $162,510 | $474,280 | $994,870 | $842,440 | $848,820 | $588,250 |
| Median sales price per unit, 5+ family building (2022$) | $59,630 | $149,730 | $132,480 | $199,370 | $177,410 | $197,560 |
| Median sales price per unit, condominium (2022$) | $172,670 | $527,230 | $469,980 | $679,570 | $572,730 | $600,000 |
| Sales - Housing Price Index | ||||||
| Index of housing price appreciation, 1 family building | 100.0 | 113.7 | 21.8 | 49.3 | ||
| Index of housing price appreciation, 2-4 family building | 100.0 | 518.7 | 348.5 | 652.5 | 486.1 | |
| Index of housing price appreciation, 5+ family building | 100.0 | 311.4 | 243.5 | 509.1 | 503.2 | 545.6 |
| Index of housing price appreciation, condominium | 100.0 | 295.3 | 255.0 | 456.5 | 393.9 | 457.7 |
| Index of housing price appreciation, all property types | 100.0 | 313.2 | 227.7 | 496.5 | 489.8 | 496.6 |
| Subsidized Housing | ||||||
| Total number of subsidized properties (properties) | 188 | |||||
| HUD Financing or Insurance (properties) | 8 | |||||
| HUD Financing or Insurance (units) | 442 | |||||
| HUD Project-based Rental Assistance Program (properties) | 14 | |||||
| HUD Project-based Rental Assistance Program (units) | 725 | |||||
| Low Income Housing Tax Credit (properties) | 22 | |||||
| Low Income Housing Tax Credit (units) | 1,038 | |||||
| Public Housing (properties) | 3 | |||||
| Public Housing (units) | 1,517 | |||||
| Mitchell-Lama (properties) | 7 | |||||
| Mitchell-Lama (units) | 1,410 | |||||
| 421-a Tax Exemption (properties) | 20 | |||||
| 421-a Tax Exemption (units) | 614 | |||||
| 420-c Tax Exemption (properties) | 31 | |||||
| 420-c Tax Exemption (units) | 1,355 | |||||
| NYC Housing Production Programs and Zoning Incentives or Requirements (properties) | 98 | |||||
| Eligible to expire from housing programs between 2023 and 2028 (properties) | 7 | |||||
| Eligible to expire from housing programs between 2023 and 2028 (units) | 971 | |||||
| Eligible to expire from housing programs between 2029 and 2038 (properties) | 17 | |||||
| Eligible to expire from housing programs between 2029 and 2038 (units) | 601 | |||||
| Eligible to expire from housing programs in 2039 and later (properties) | 12 | |||||
| Eligible to expire from housing programs in 2039 and later (units) | 790 | |||||
| Indicator | 2000 | 2006 | 2010 | 2019 | 2021 | 2022 |
|---|---|---|---|---|---|---|
| Density | ||||||
| Population density (1,000 persons per square mile) | 71.3 | 70.1 | 69.6 | 74.0 | ||
| Development | ||||||
| Units authorized by new residential building permits | 127 | 0 | 0 | 145 | 397 | 1,638 |
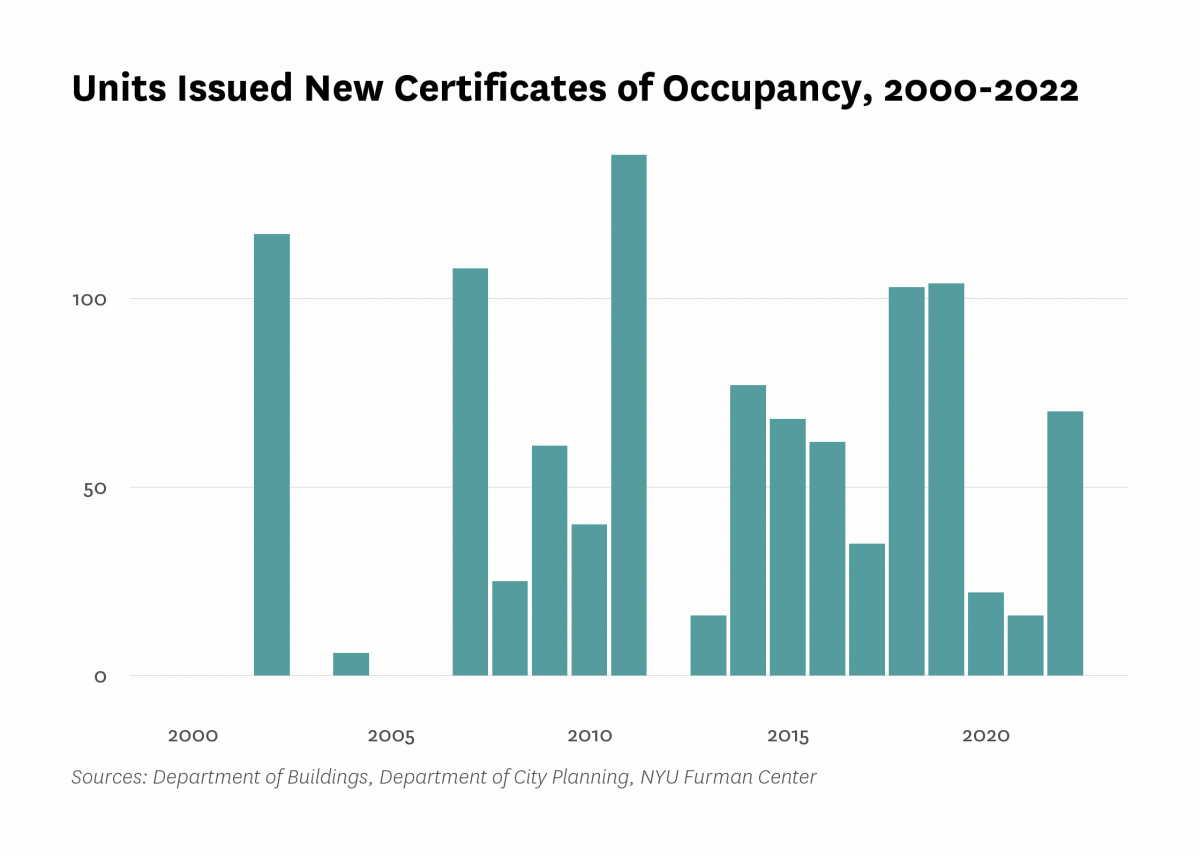
| Units issued new certificates of occupancy | 0 | 0 | 40 | 104 | 16 | 70 |
| Indicator | 2000 | 2006 | 2010 | 2019 | 2021 | 2022 |
|---|---|---|---|---|---|---|
| Commute | ||||||
| Car-free commute (% of commuters) | 75.0% | 78.8% | 83.9% | 87.6% | 80.0% | |
| Mean travel time to work (minutes) | 40.4 | 38.3 | 39.0 | 43.1 | 39.7 | |
| Crime and Incarceration | ||||||
| Serious crime rate (per 1,000 residents) | 10.6 | 10.8 | 10.3 | 14.2 | 14.5 | |
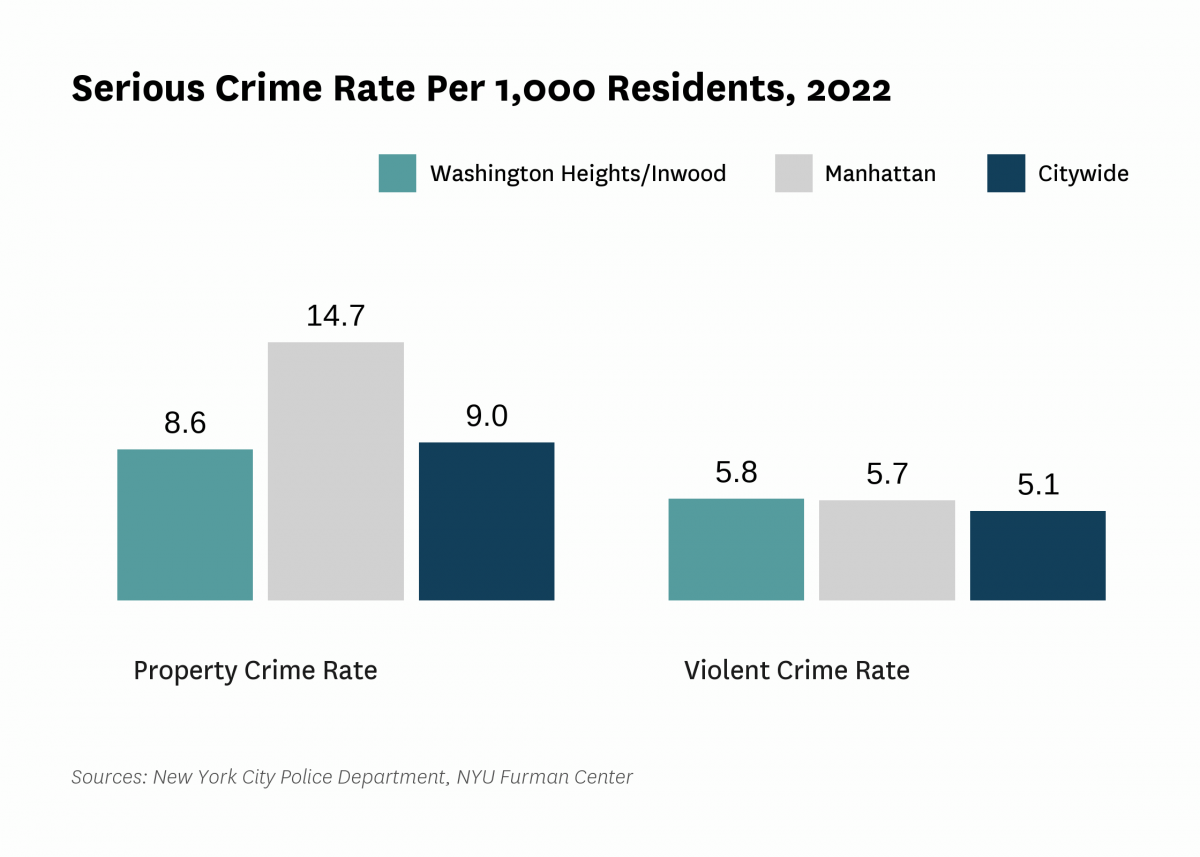
| Serious crime rate, property (per 1,000 residents) | 6.0 | 5.8 | 5.8 | 8.4 | 8.6 | |
| Serious crime rate, violent (per 1,000 residents) | 4.6 | 4.9 | 4.5 | 5.7 | 5.8 | |
| Schools | ||||||
| Students performing at grade level in English language arts, 4th grade | 42.5% | 32.4% | ||||
| Students performing at grade level in math, 4th grade | 40.0% | 29.5% | ||||
| Indicator | 2000 | 2006 | 2010 | 2019 | 2021 | 2022 |
|---|---|---|---|---|---|---|
| Median Rent | ||||||
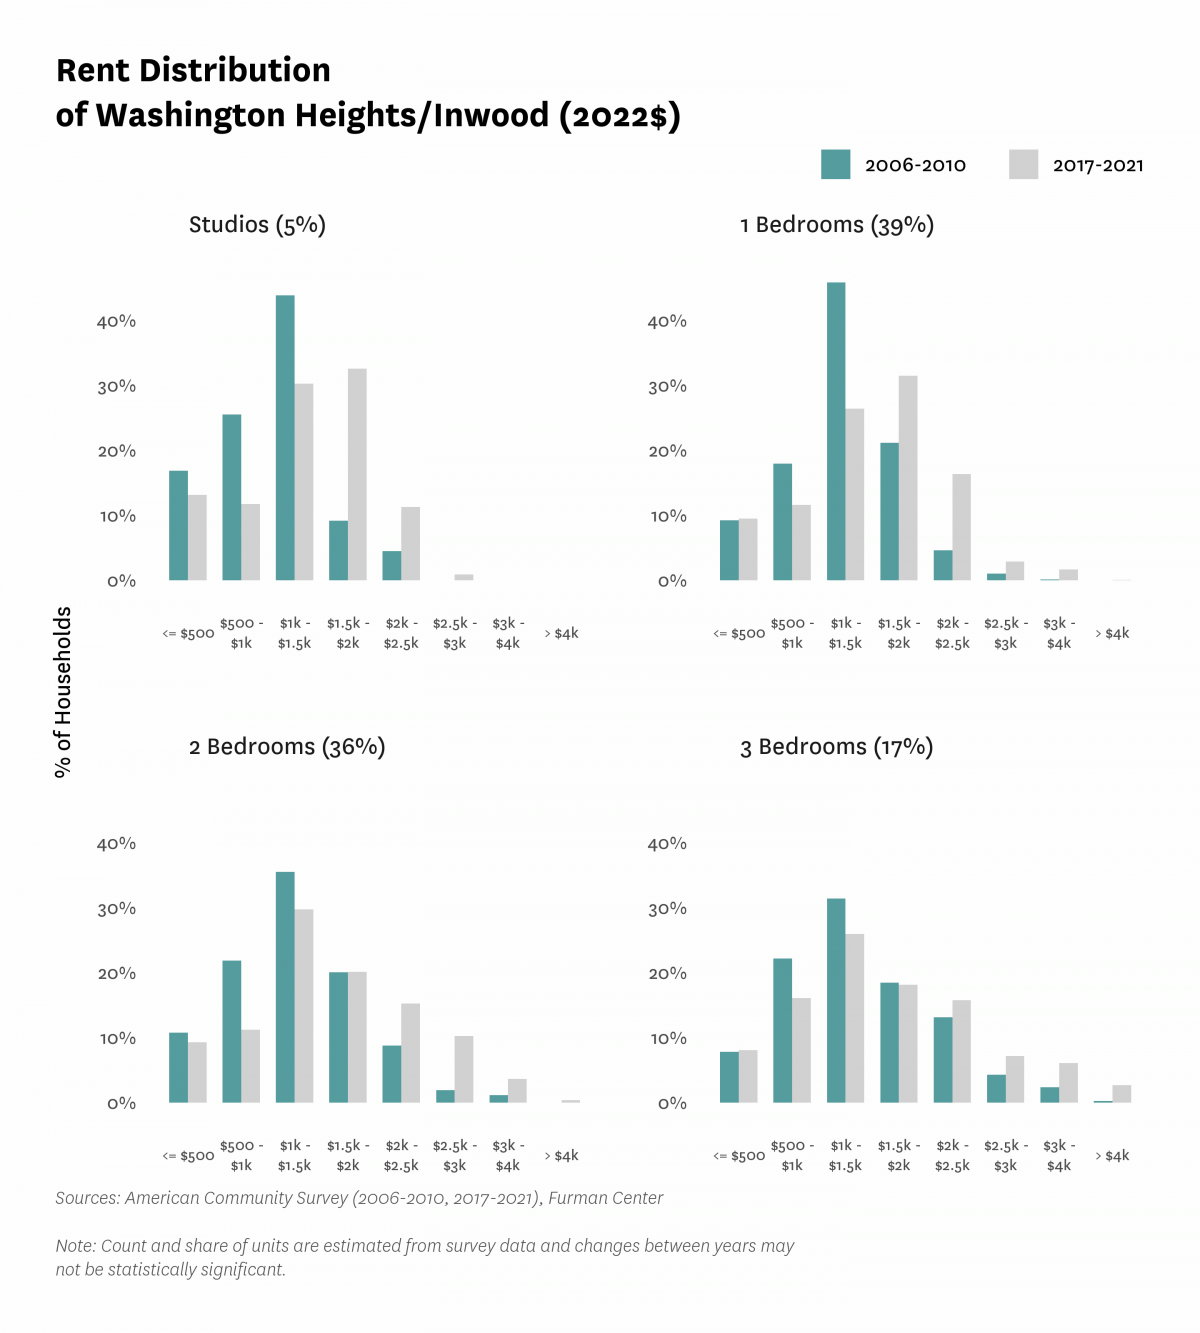
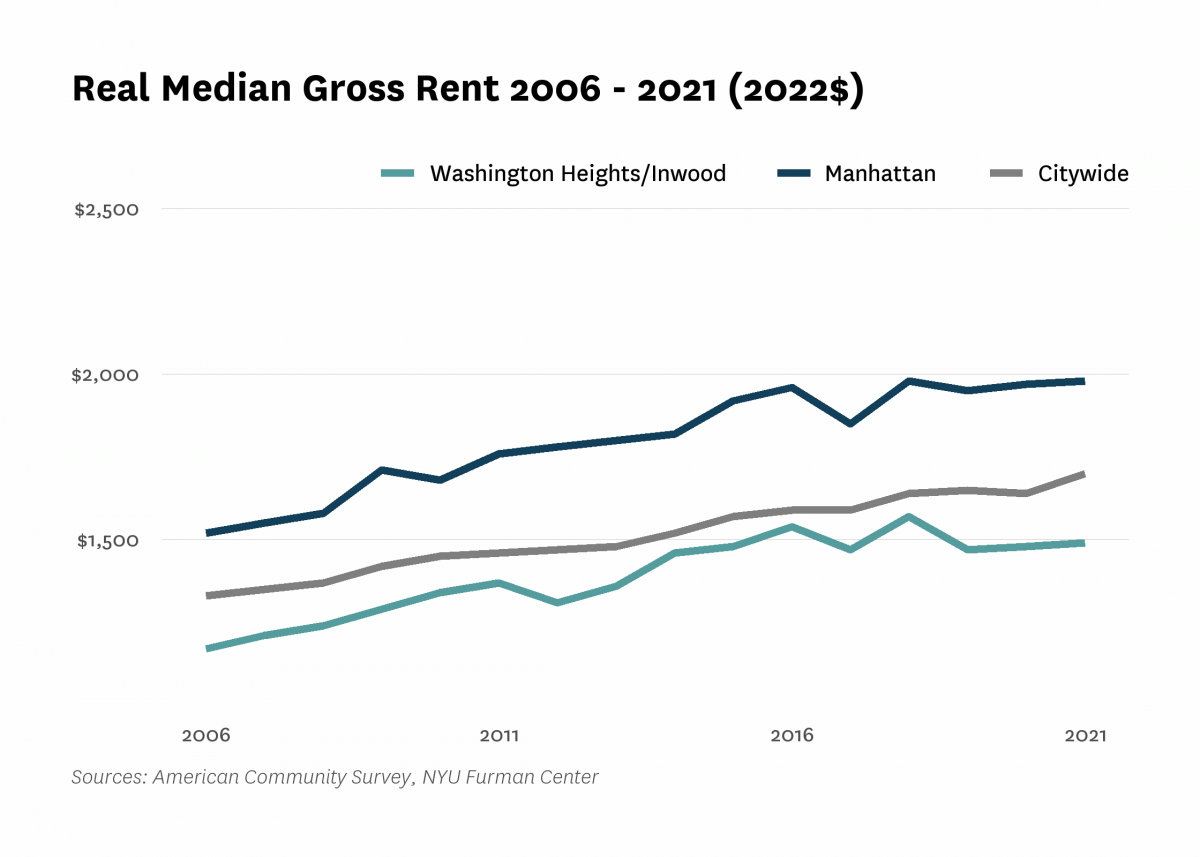
| Median rent, 2- and 3-bedrooms (2022$) | $1,260 | $1,470 | $1,520 | |||
| Median rent, all (2022$) | $1,080 | $1,170 | $1,340 | $1,470 | $1,490 | |
| Median rent, recent movers (2022$) | $1,550 | $2,010 | $2,090 | |||
| Median rent, studios and 1-bedrooms (2022$) | $1,230 | $1,450 | $1,540 | |||
| Change in collected rent (2019-2020) | -2.0% | |||||
| Affordability | ||||||
| Rental units affordable at 30% AMI (% of recently available units) | 7.7% | 5.3% | 4.4% | |||
| Rental units affordable at 80% AMI (% of recently available units) | 59.6% | 47.8% | 49.9% | |||
| Rental units affordable at 120% AMI (% of recently available units) | 95.1% | 96.0% | 97.4% | |||
| Rent Burden | ||||||
| Moderately rent-burdened households | 22.9% | 23.3% | 22.3% | 24.6% | ||
| Moderately rent-burdened households, low income | 29.3% | 31.5% | 30.2% | |||
| Moderately rent-burdened households, moderate income | 10.6% | 15.5% | 15.5% | |||
| Severely rent-burdened households | 25.7% | 30.2% | 27.5% | 27.8% | ||
| Severely rent-burdened households, low income | 42.8% | 40.0% | 39.5% | |||
| Severely rent-burdened households, moderate income | 0.8% | 0.2% | 0.5% | |||
| Rental Subsidy | ||||||
| Housing choice vouchers (% of occupied, privately owned rental units) | 9.0% | 7.4% | ||||
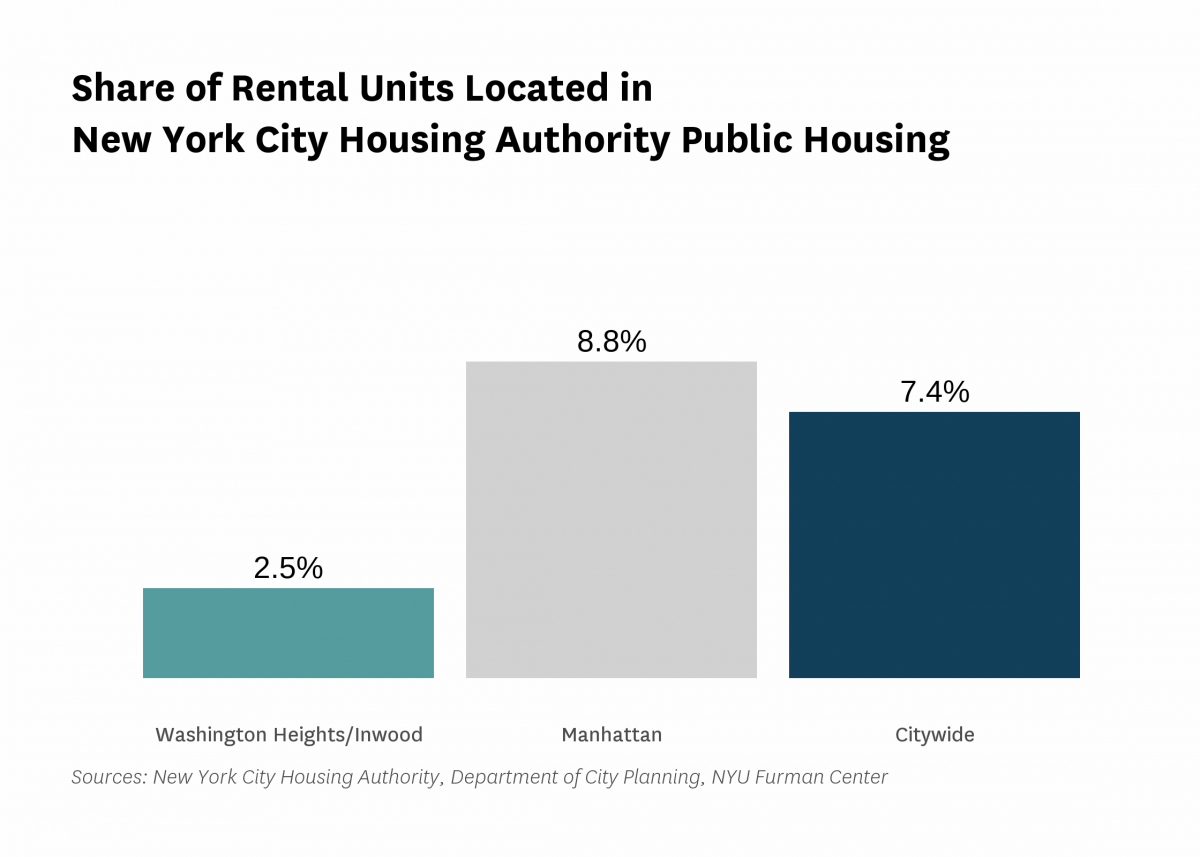
| Public housing (% of rental units) | 2.5% | |||||
Data Notes: See CoreData User Guide for more information about indicator definitions and methods.
Indicators: The rental vacancy rate, severe crowding rate, and the severely rent-burdened households indicators use five-year American Community Survey (ACS) estimates. Data under the 2010 heading comes from the 2006 – 2010 ACS, data under the 2019 heading comes from the 2015 – 2019 ACS and data under the 2021 heading comes from 2017 – 2021 ACS .
All content © 2005 – 2024 Furman Center for Real Estate and Urban Policy | Top of page | Contact Us