| Indicator | 2000 | 2006 | 2010 | 2019 | 2021 | 2022 |
|---|---|---|---|---|---|---|
| Population | ||||||
| Born in New York State | 48.5% | 43.9% | 44.2% | 46.6% | ||
| Disabled population | 5.0% | 5.9% | 6.8% | |||
| Foreign-born population | 21.3% | 20.2% | 22.4% | 22.0% | 23.5% | |
| Population | 192,213 | 216,812 | 199,843 | 179,682 | 197,826 | |
| Population aged 65+ | 13.4% | 14.8% | 16.7% | 21.3% | 25.0% | |
| Households | ||||||
| Households with children under 18 years old | 14.6% | 21.2% | 18.9% | 17.9% | 17.8% | |
| Single-person households | 50.4% | 45.9% | 50.3% | 46.9% | ||
| Race and Ethnicity | ||||||
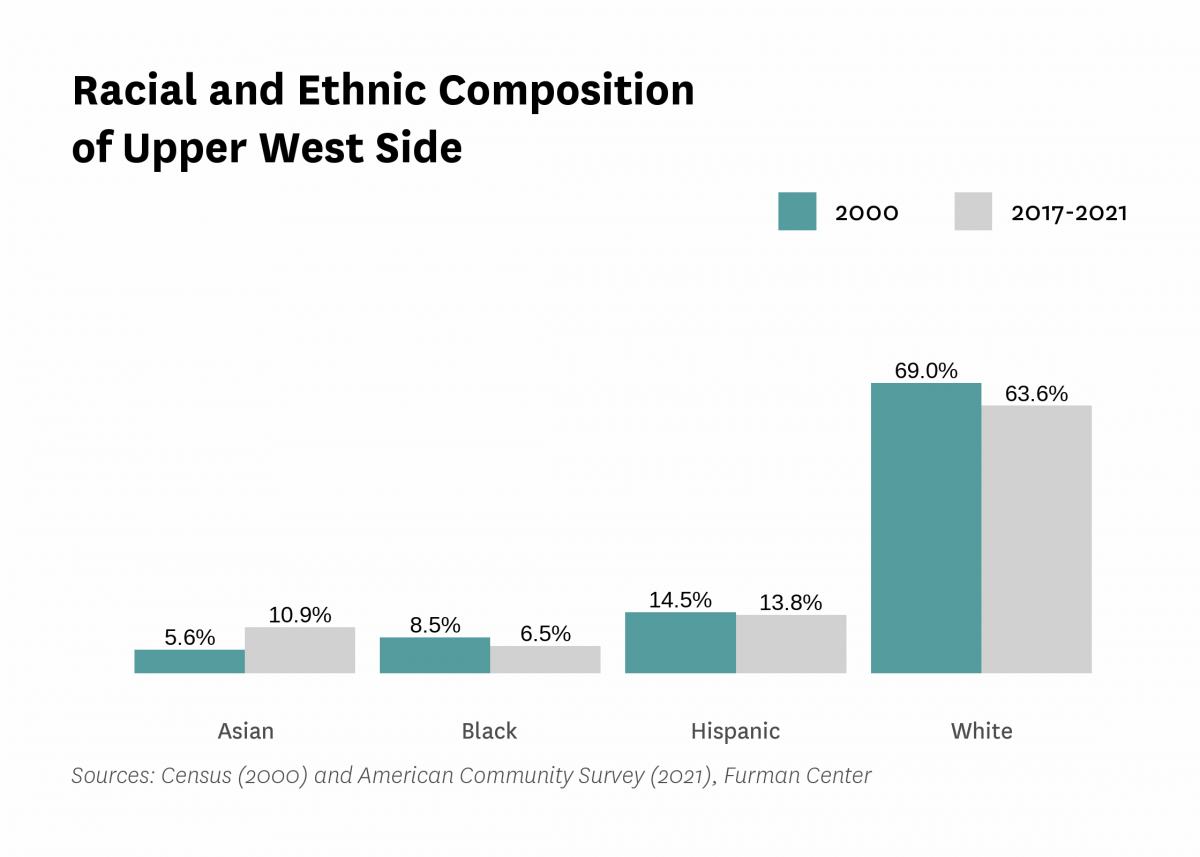
| Percent Asian | 5.6% | 7.7% | 7.7% | 10.1% | 10.9% | |
| Percent Black | 8.5% | 7.0% | 6.6% | 4.7% | 6.5% | |
| Percent Hispanic | 14.5% | 10.8% | 15.3% | 14.0% | 13.8% | |
| Percent white | 69.0% | 72.7% | 68.1% | 68.7% | 63.6% | |
| Racial diversity index | 0.49 | 0.45 | 0.50 | 0.50 | 0.56 | |
| Income and Poverty | ||||||
| Income diversity ratio | 6.7 | 8.6 | 6.7 | 9.2 | ||
| Median household income (2022$) | $115,650 | $127,360 | $115,890 | $152,450 | $120,770 | |
| Median household income, homeowners (2022$) | $257,620 | $222,420 | $278,740 | $231,200 | ||
| Median household income, renters (2022$) | $92,760 | $80,700 | $117,070 | $92,040 | ||
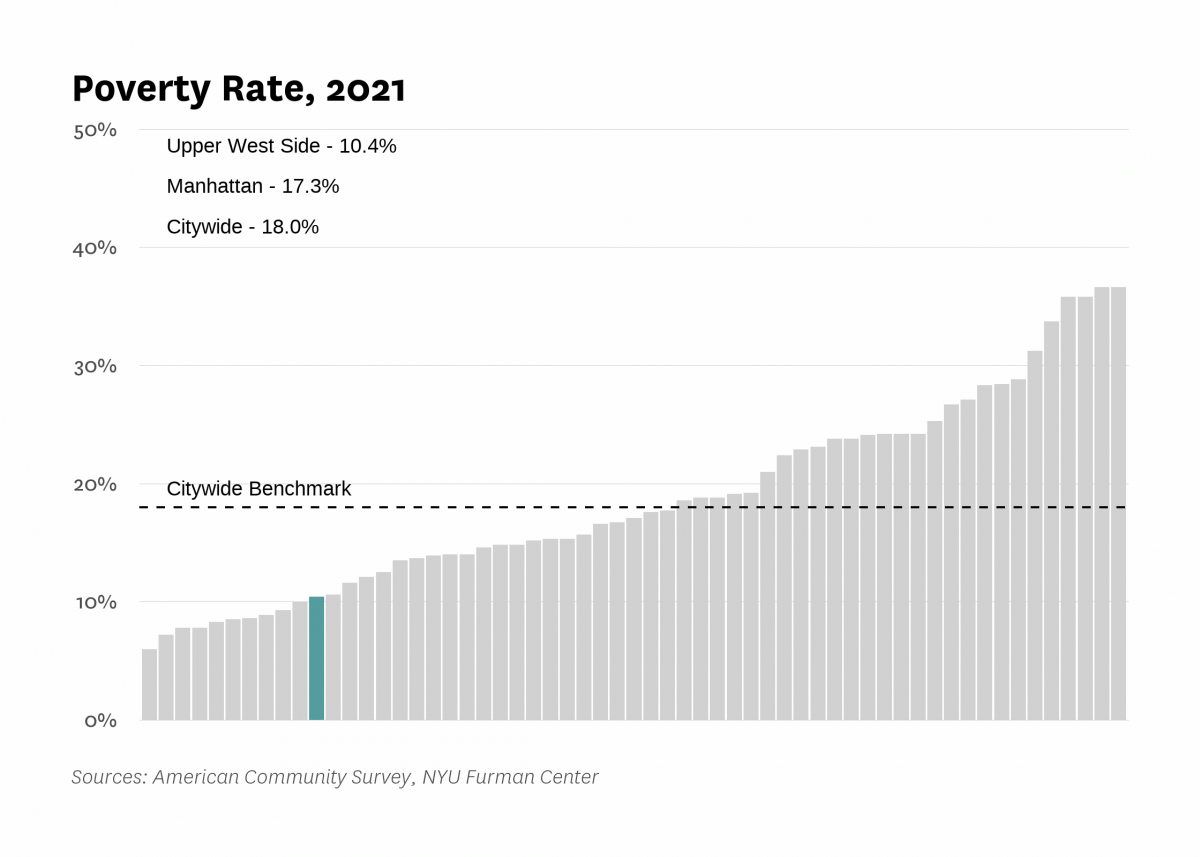
| Poverty rate | 10.0% | 9.0% | 10.4% | 8.7% | 10.4% | |
| Poverty rate, population aged 65+ | 13.2% | 12.5% | 12.2% | 9.3% | ||
| Poverty rate, population under 18 years old | 6.0% | 6.5% | 9.3% | 7.0% | ||
| Labor Market | ||||||
| Labor force participation rate | 70.7% | 68.3% | 68.8% | 63.8% | ||
| Population aged 25+ without a high school diploma | 5.9% | 5.1% | 4.7% | 4.7% | ||
| Unemployment rate | 4.77% | 4.52% | 7.46% | 2.32% | 11.53% | |
| Indicator | 2000 | 2006 | 2010 | 2019 | 2021 | 2022 |
|---|---|---|---|---|---|---|
| Housing Stock | ||||||
| Homeownership rate | 29.2% | 35.6% | 32.0% | 35.1% | 37.1% | |
| Housing units | 120,652 | 113,725 | 118,000 | 124,080 | ||
| Rental vacancy rate | 3.8% | 5.3% | 6.6% | |||
| Serious housing code violations (per 1,000 privately owned rental units) | 13.9 | 14.8 | 41.1 | 34.9 | 42.8 | |
| Severe crowding rate (% of renter households) | 1.8% | 3.1% | 3.4% | |||
| Total housing code violations (per 1,000 privately owned rental units) | 108.6 | 81.8 | 165.6 | 161.7 | 150.5 | |
| Finance - Distress | ||||||
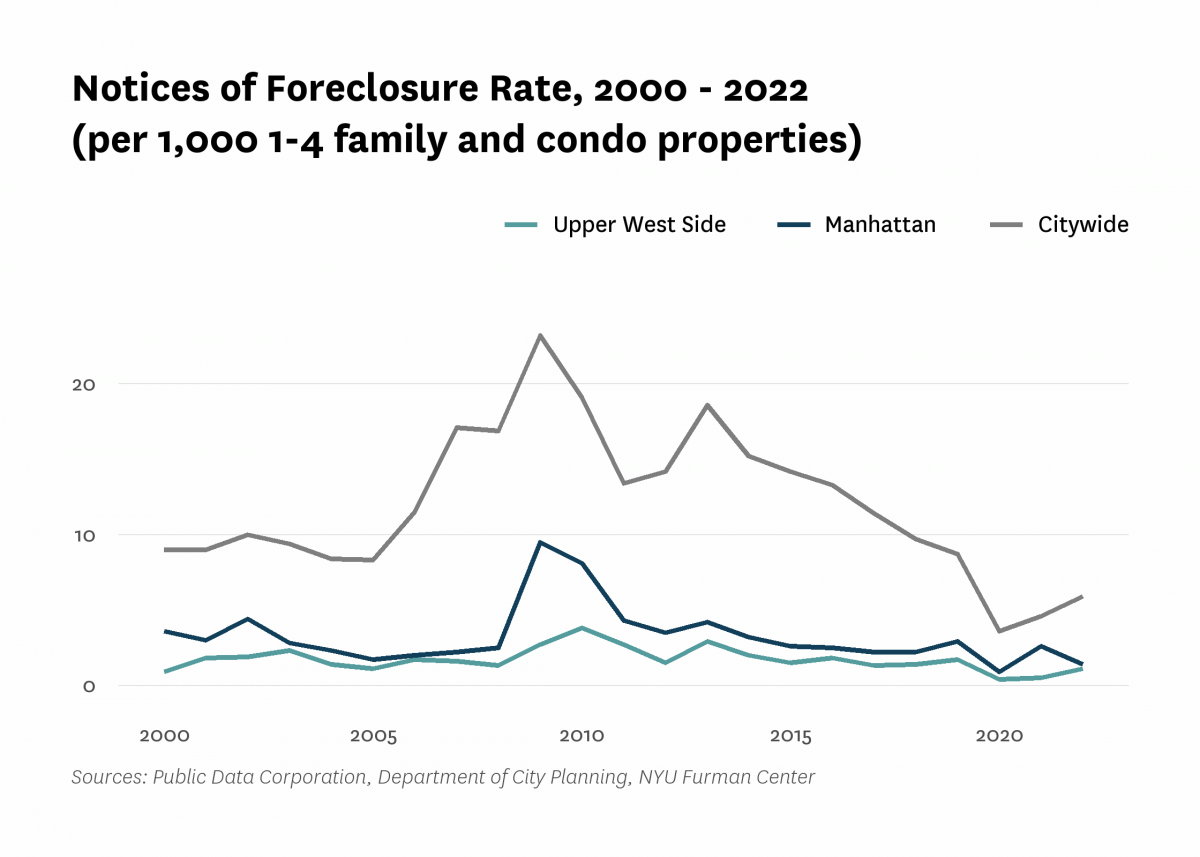
| Notices of foreclosure rate (per 1,000 1-4 family and condo properties) | 0.9 | 1.7 | 3.8 | 1.7 | 0.5 | 1.1 |
| Notices of foreclosure, all residential properties | 15 | 27 | 77 | 38 | 11 | 26 |
| Notices of foreclosure, initial, 1-4 family and condo properties | 8 | 21 | 63 | 17 | 2 | 14 |
| Notices of foreclosure, repeat, 1-4 family and condo properties | 2 | 5 | 8 | 18 | 9 | 10 |
| Pre-foreclosure notice rate (per 1,000 1-4 family and condo properties) | 8.2 | 4.6 | 8.3 | |||
| Pre-foreclosure notices, 1-4 family and condo properties | 168 | 97 | 177 | |||
| Properties entering REO, 1-4 family | 0 | 0 | 0 | |||
| Finance - Lending | ||||||
| FHA/VA-backed home purchase loans (% of home purchase loans) | 0.0% | 0.0% | 0.0% | 0.0% | ||
| Higher-cost home purchase loans (% of home purchase loans) | 1.8% | 0.7% | 0.4% | 0.6% | ||
| Higher-cost refinance loans (% of refinance loans) | 6.0% | 0.1% | 0.3% | 0.1% | ||
| Home purchase loan rate (per 1,000 properties) | 29.8 | 20.5 | 16.1 | 24.3 | ||
| Home purchase loans in LMI tracts (% of home purchase loans) | 3.4% | 1.0% | 2.3% | 2.1% | ||
| Home purchase loans to LMI borrowers (% of home purchase loans) | 0.4% | 2.7% | 0.7% | 1.3% | ||
| Refinance loan rate (per 1,000 properties) | 11.6 | 38.3 | 15.9 | 30.2 | ||
| Sales - Volume | ||||||
| Sales volume, 1 family building | 4 | 5 | 8 | 3 | 11 | 10 |
| Sales volume, 2-4 family building | 9 | 11 | 12 | 1 | 7 | 15 |
| Sales volume, 5+ family building | 33 | 68 | 60 | 33 | 68 | 51 |
| Sales volume, condominium | 33 | 1,135 | 1,046 | 615 | 1,144 | 928 |
| Sales volume, all property types | 79 | 1,219 | 1,126 | 652 | 1,230 | 1,004 |
| Sales - Median Prices | ||||||
| Median sales price per unit, 1 family building (2022$) | $11,428,480 | $8,782,880 | $7,033,620 | $7,247,220 | $6,684,460 | $7,287,500 |
| Median sales price per unit, 2-4 family building (2022$) | $1,015,390 | $1,519,440 | $2,366,000 | $1,979,050 | $2,307,730 | $2,145,750 |
| Median sales price per unit, 5+ family building (2022$) | $297,400 | $477,790 | $449,330 | $602,080 | $414,680 | $481,880 |
| Median sales price per unit, condominium (2022$) | $955,910 | $1,337,950 | $1,386,620 | $1,711,460 | $1,442,990 | $1,804,530 |
| Sales - Housing Price Index | ||||||
| Index of housing price appreciation, 1 family building | 100.0 | 132.3 | 160.0 | 152.2 | 244.0 | |
| Index of housing price appreciation, 2-4 family building | 100.0 | 178.8 | 182.4 | 298.2 | 373.1 | 321.6 |
| Index of housing price appreciation, 5+ family building | 100.0 | 182.8 | 232.5 | 330.5 | 355.1 | 419.1 |
| Index of housing price appreciation, condominium | 100.0 | 226.6 | 229.8 | 303.8 | 299.0 | 319.0 |
| Index of housing price appreciation, all property types | 100.0 | 202.7 | 208.4 | 276.4 | 273.3 | 293.6 |
| Subsidized Housing | ||||||
| Total number of subsidized properties (properties) | 244 | |||||
| HUD Financing or Insurance (properties) | 10 | |||||
| HUD Financing or Insurance (units) | 1,114 | |||||
| HUD Project-based Rental Assistance Program (properties) | 19 | |||||
| HUD Project-based Rental Assistance Program (units) | 1,406 | |||||
| Low Income Housing Tax Credit (properties) | 37 | |||||
| Low Income Housing Tax Credit (units) | 4,912 | |||||
| Public Housing (properties) | 21 | |||||
| Public Housing (units) | 4,729 | |||||
| Mitchell-Lama (properties) | 11 | |||||
| Mitchell-Lama (units) | 1,758 | |||||
| 421-a Tax Exemption (properties) | 17 | |||||
| 421-a Tax Exemption (units) | 5,602 | |||||
| 420-c Tax Exemption (properties) | 34 | |||||
| 420-c Tax Exemption (units) | 1,884 | |||||
| NYC Housing Production Programs and Zoning Incentives or Requirements (properties) | 108 | |||||
| Eligible to expire from housing programs between 2023 and 2028 (properties) | 8 | |||||
| Eligible to expire from housing programs between 2023 and 2028 (units) | 1,490 | |||||
| Eligible to expire from housing programs between 2029 and 2038 (properties) | 25 | |||||
| Eligible to expire from housing programs between 2029 and 2038 (units) | 2,798 | |||||
| Eligible to expire from housing programs in 2039 and later (properties) | 26 | |||||
| Eligible to expire from housing programs in 2039 and later (units) | 3,162 | |||||
| Indicator | 2000 | 2006 | 2010 | 2019 | 2021 | 2022 |
|---|---|---|---|---|---|---|
| Density | ||||||
| Population density (1,000 persons per square mile) | 73.2 | 67.5 | 60.6 | 66.8 | ||
| Development | ||||||
| Units authorized by new residential building permits | 441 | 0 | 0 | 352 | 125 | 252 |
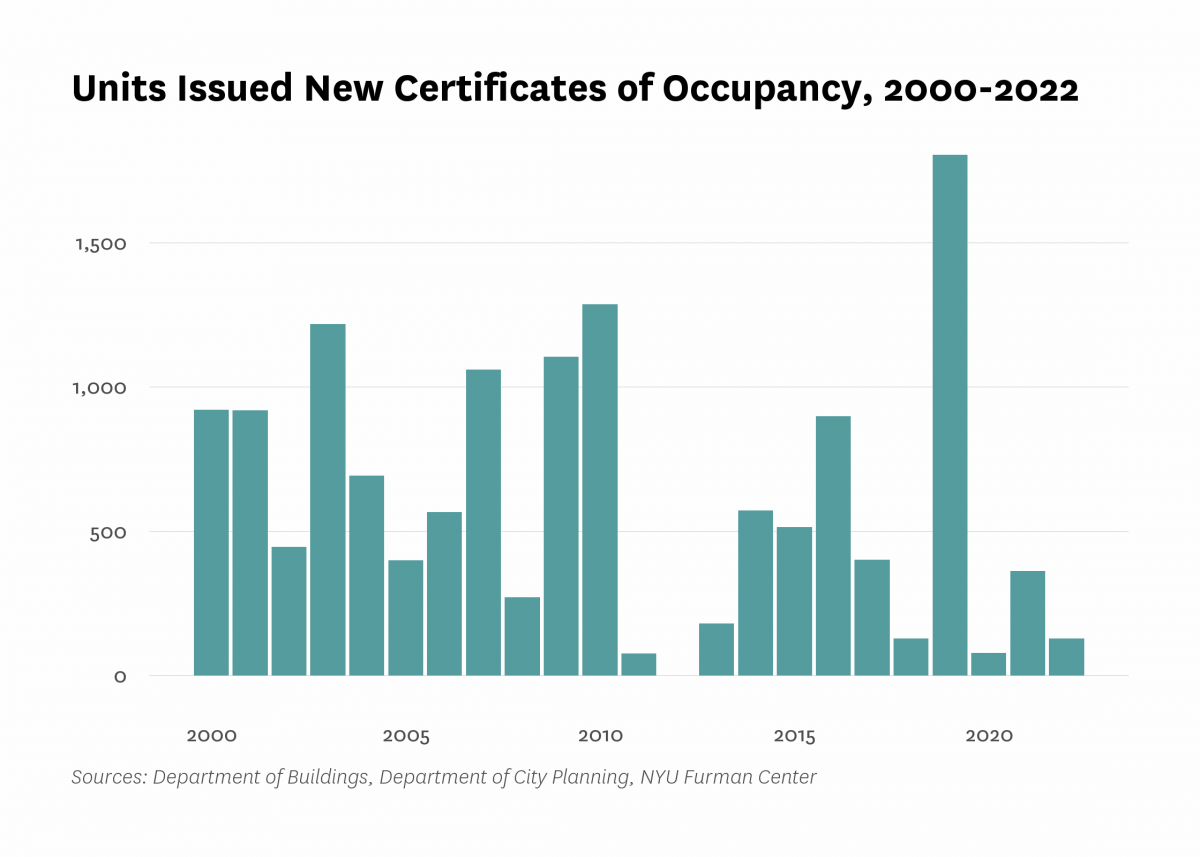
| Units issued new certificates of occupancy | 921 | 566 | 1,285 | 1,803 | 363 | 128 |
| Indicator | 2000 | 2006 | 2010 | 2019 | 2021 | 2022 |
|---|---|---|---|---|---|---|
| Commute | ||||||
| Car-free commute (% of commuters) | 83.3% | 83.9% | 85.7% | 85.5% | 85.6% | |
| Mean travel time to work (minutes) | 30.3 | 28.8 | 29.6 | 30.5 | 29.0 | |
| Crime and Incarceration | ||||||
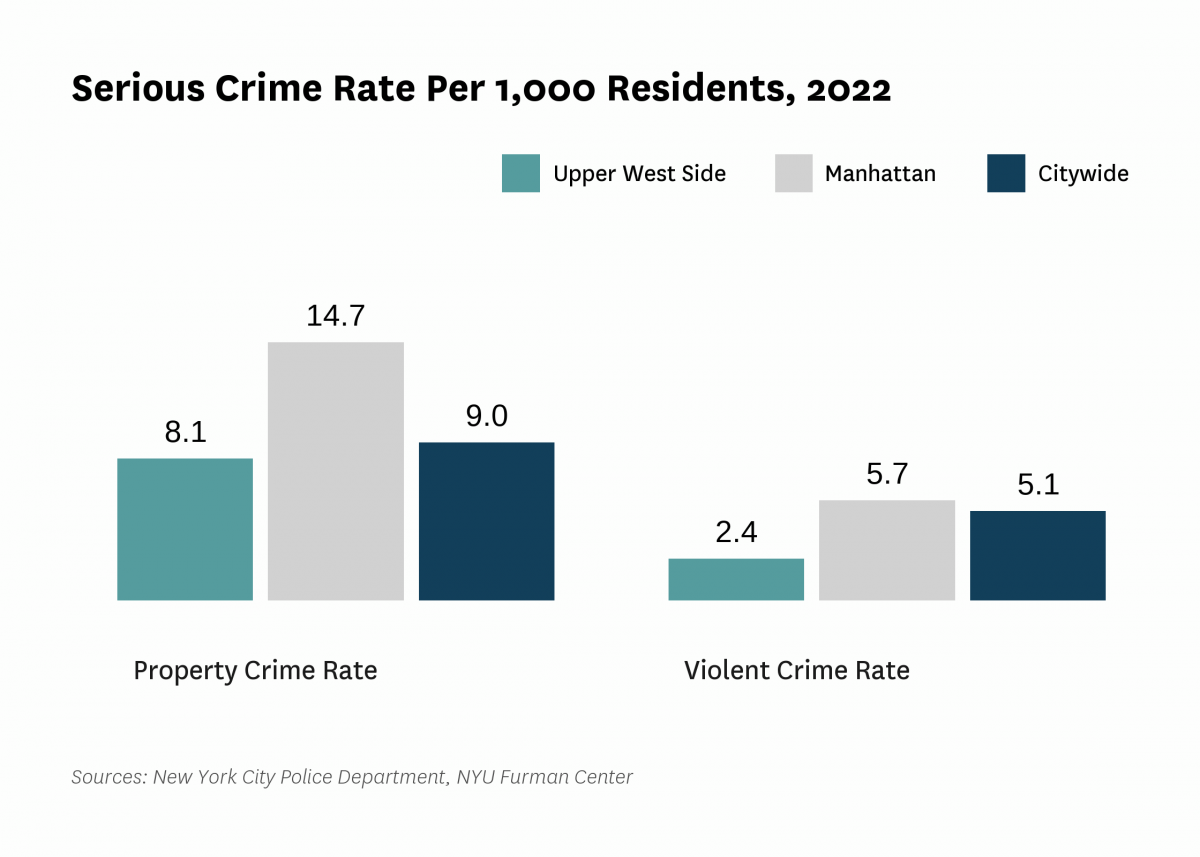
| Serious crime rate (per 1,000 residents) | 11.9 | 9.0 | 8.8 | 9.4 | 10.6 | |
| Serious crime rate, property (per 1,000 residents) | 9.2 | 7.0 | 6.6 | 7.1 | 8.1 | |
| Serious crime rate, violent (per 1,000 residents) | 2.7 | 2.1 | 2.2 | 2.3 | 2.4 | |
| Schools | ||||||
| Students performing at grade level in English language arts, 4th grade | 78.8% | 72.8% | ||||
| Students performing at grade level in math, 4th grade | 75.7% | 73.7% | ||||
| Indicator | 2000 | 2006 | 2010 | 2019 | 2021 | 2022 |
|---|---|---|---|---|---|---|
| Median Rent | ||||||
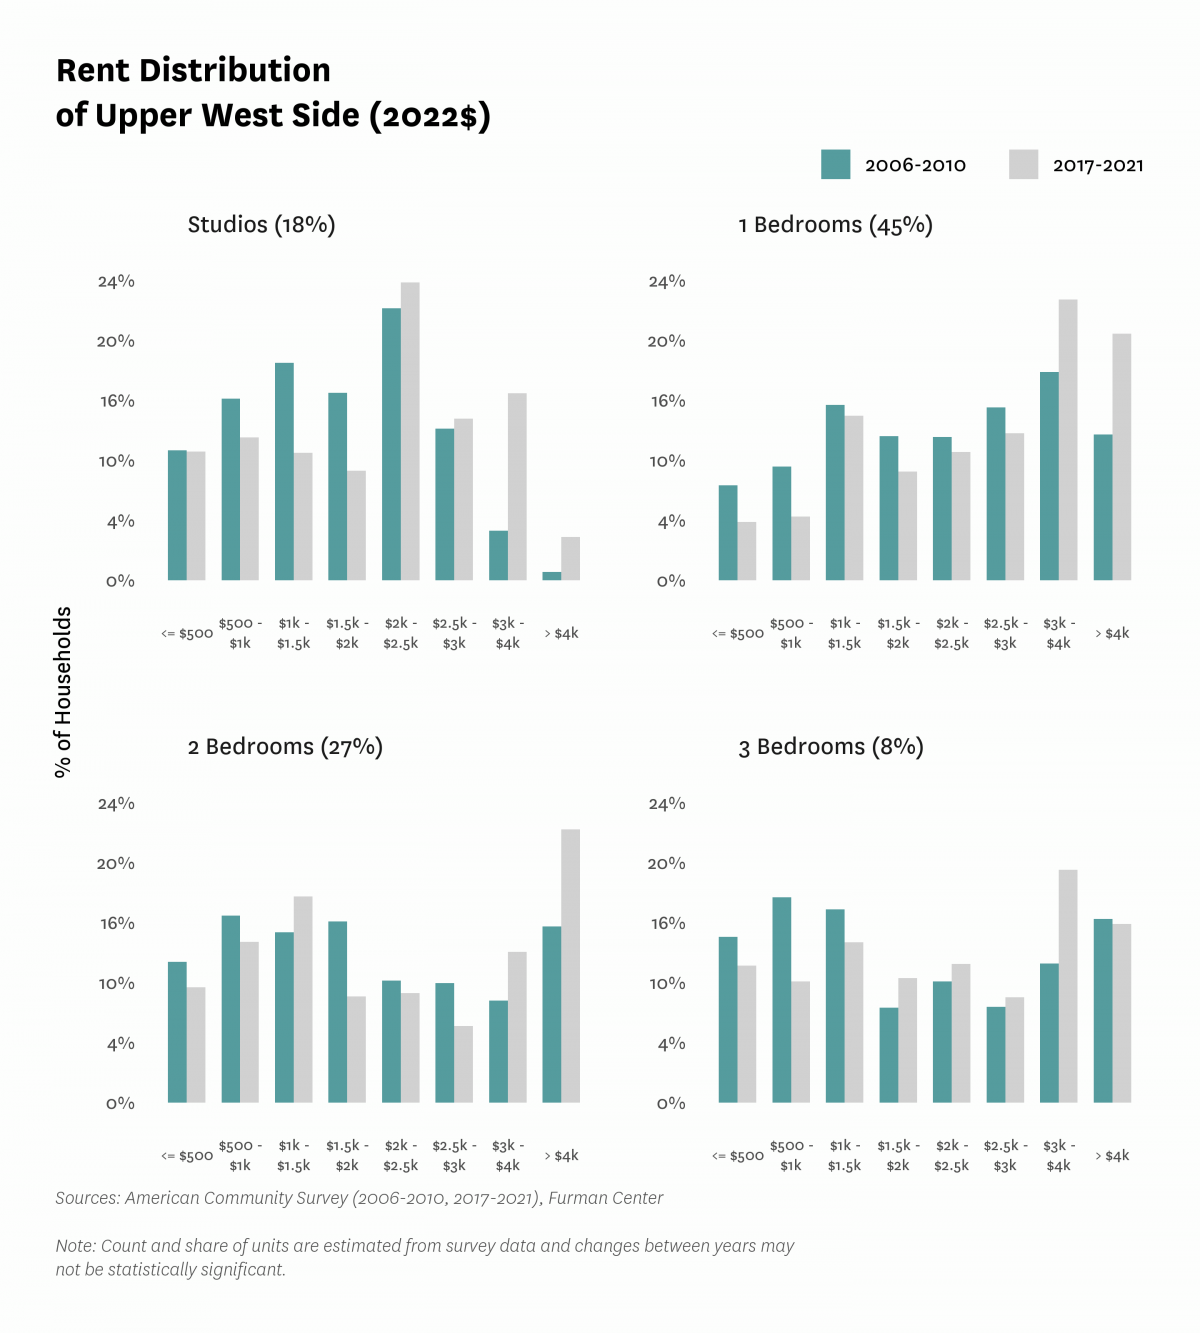
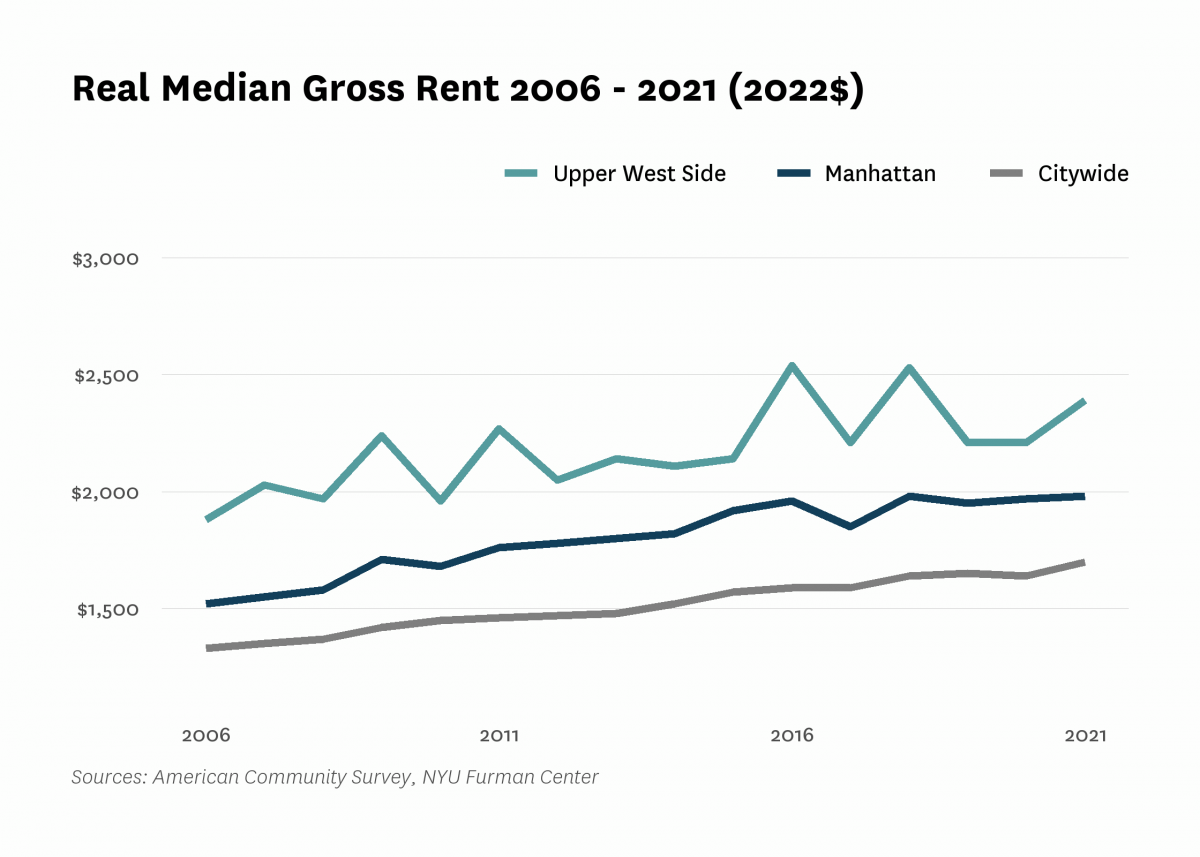
| Median rent, 2- and 3-bedrooms (2022$) | $1,790 | $1,960 | $2,150 | |||
| Median rent, all (2022$) | $1,700 | $1,880 | $1,960 | $2,210 | $2,390 | |
| Median rent, recent movers (2022$) | $2,710 | $2,790 | $2,940 | |||
| Median rent, studios and 1-bedrooms (2022$) | $2,090 | $2,340 | $2,510 | |||
| Change in collected rent (2019-2020) | -3.0% | |||||
| Affordability | ||||||
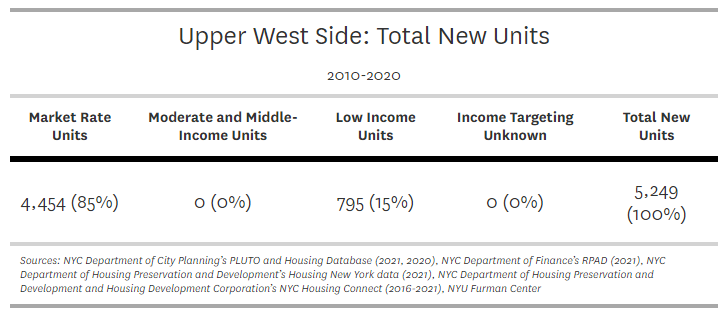
| Rental units affordable at 30% AMI (% of recently available units) | 2.3% | 5.9% | 4.8% | |||
| Rental units affordable at 80% AMI (% of recently available units) | 17.4% | 26.1% | 21.9% | |||
| Rental units affordable at 120% AMI (% of recently available units) | 39.0% | 53.5% | 55.7% | |||
| Rent Burden | ||||||
| Moderately rent-burdened households | 21.3% | 22.4% | 18.2% | 23.8% | ||
| Moderately rent-burdened households, low income | 25.9% | 24.0% | 25.4% | |||
| Moderately rent-burdened households, moderate income | 36.5% | 38.4% | 33.1% | |||
| Severely rent-burdened households | 16.6% | 20.1% | 20.3% | 20.9% | ||
| Severely rent-burdened households, low income | 48.2% | 51.8% | 52.8% | |||
| Severely rent-burdened households, moderate income | 11.3% | 12.9% | 12.3% | |||
| Rental Subsidy | ||||||
| Housing choice vouchers (% of occupied, privately owned rental units) | 2.1% | 2.2% | ||||
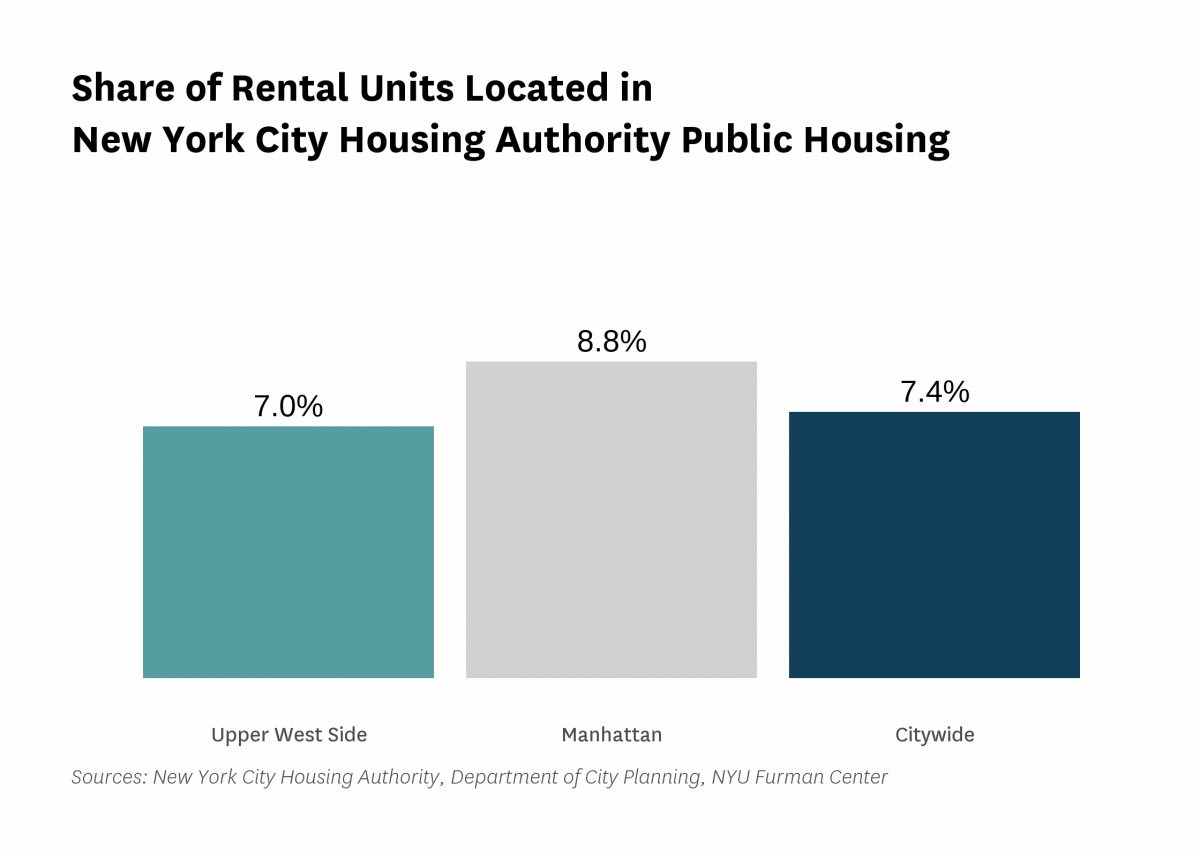
| Public housing (% of rental units) | 7.0% | |||||

Data Notes: See CoreData User Guide for more information about indicator definitions and methods.
Indicators: The rental vacancy rate, severe crowding rate, and the severely rent-burdened households indicators use five-year American Community Survey (ACS) estimates. Data under the 2010 heading comes from the 2006 – 2010 ACS, data under the 2019 heading comes from the 2015 – 2019 ACS and data under the 2021 heading comes from 2017 – 2021 ACS .
All content © 2005 – 2024 Furman Center for Real Estate and Urban Policy | Top of page | Contact Us