| Indicator | 2000 | 2006 | 2010 | 2019 | 2021 | 2022 |
|---|---|---|---|---|---|---|
| Population | ||||||
| Born in New York State | 72.5% | 71.7% | 69.9% | 68.0% | ||
| Disabled population | 7.1% | 7.2% | 7.7% | |||
| Foreign-born population | 16.4% | 20.9% | 21.4% | 23.5% | 25.6% | |
| Population | 443,728 | 477,377 | 469,363 | 476,143 | 493,494 | |
| Population aged 65+ | 11.6% | 11.8% | 12.7% | 16.7% | 17.0% | |
| Households | ||||||
| Households with children under 18 years old | 38.5% | 38.7% | 36.8% | 31.1% | 32.5% | |
| Single-person households | 21.6% | 21.4% | 23.6% | 24.9% | ||
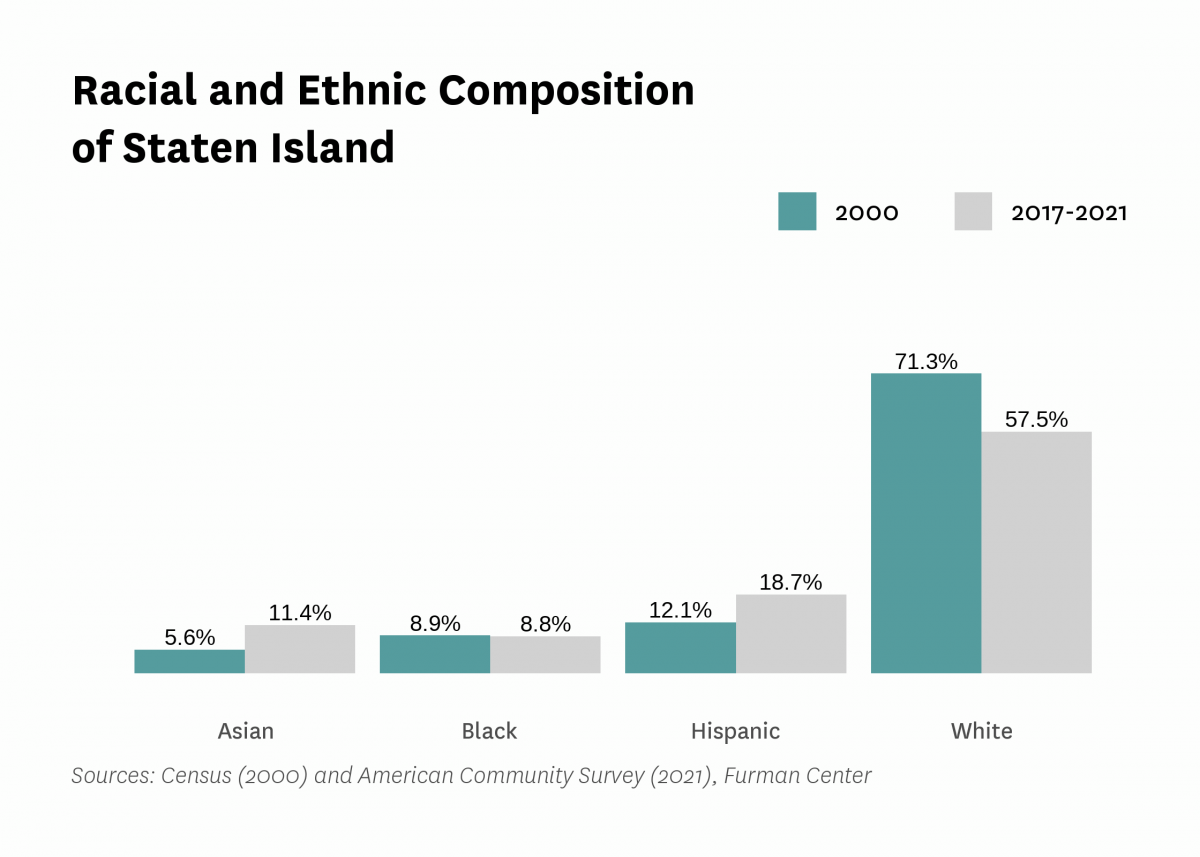
| Race and Ethnicity | ||||||
| Percent Asian | 5.6% | 7.4% | 7.8% | 10.7% | 11.4% | |
| Percent Black | 8.9% | 9.4% | 9.6% | 9.5% | 8.8% | |
| Percent Hispanic | 12.1% | 14.9% | 17.4% | 18.6% | 18.7% | |
| Percent white | 71.3% | 66.8% | 64.1% | 59.5% | 57.5% | |
| Racial diversity index | 0.47 | 0.52 | 0.54 | 0.59 | 0.61 | |
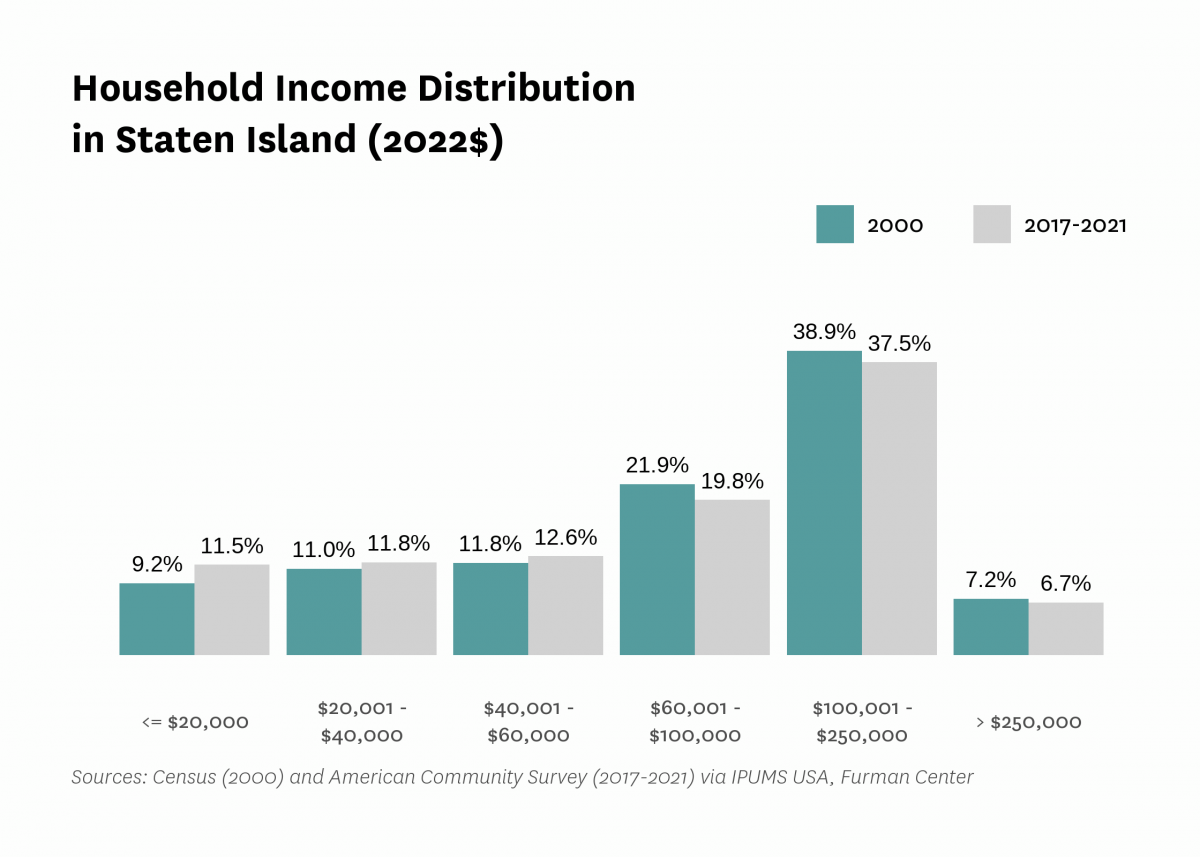
| Income and Poverty | ||||||
| Income diversity ratio | 4.3 | 5.3 | 4.3 | 4.7 | ||
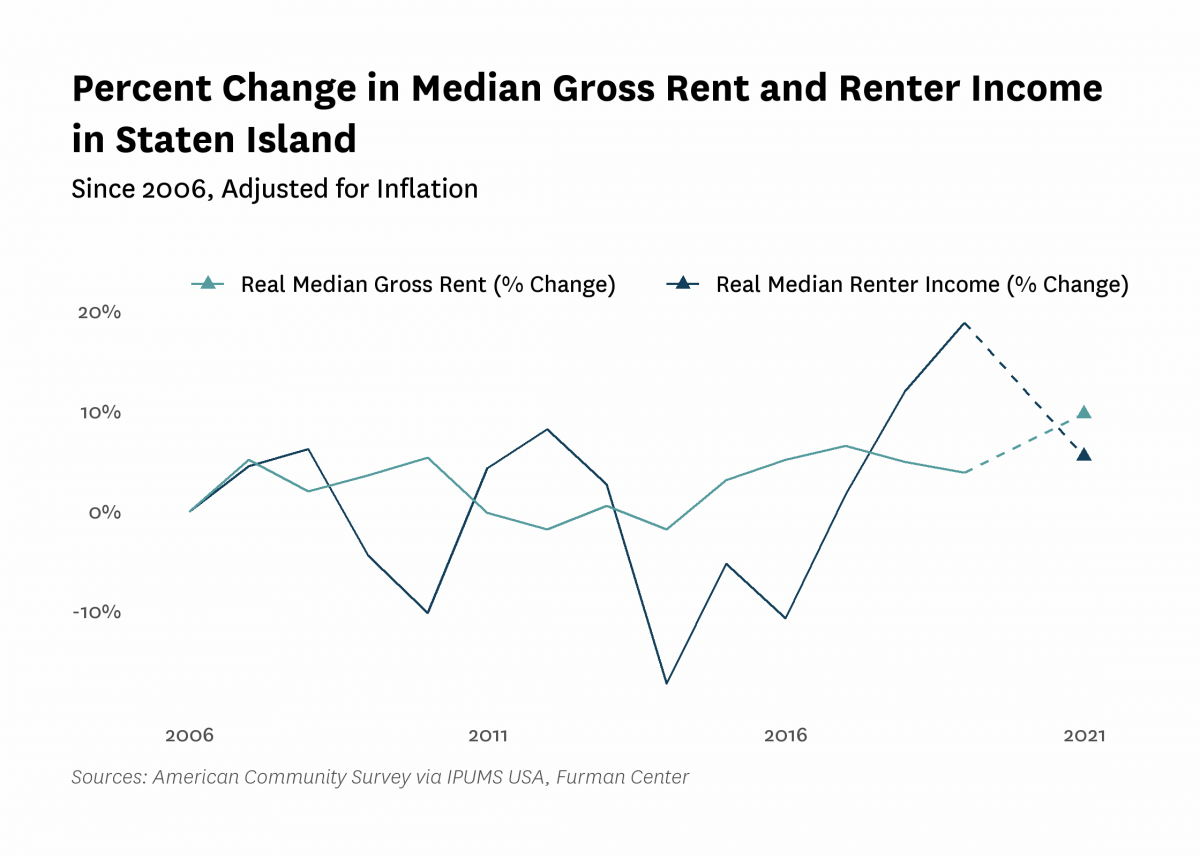
| Median household income (2022$) | $96,440 | $96,430 | $90,850 | $100,150 | $91,310 | |
| Median household income, homeowners (2022$) | $117,390 | $115,090 | $125,240 | $111,370 | ||
| Median household income, renters (2022$) | $45,960 | $41,300 | $54,640 | $48,490 | ||
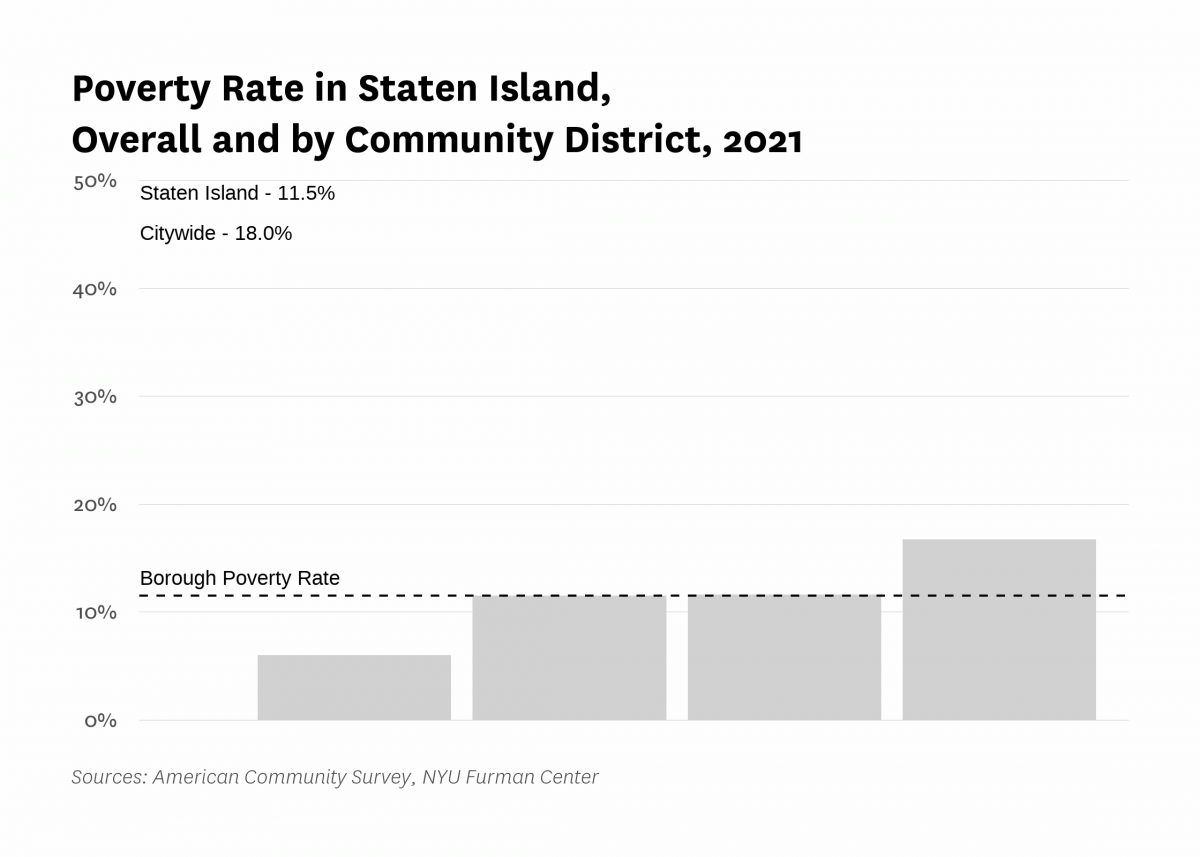
| Poverty rate | 10.0% | 9.2% | 11.8% | 8.3% | 11.5% | |
| Poverty rate, population aged 65+ | 11.0% | 11.8% | 8.0% | 10.9% | ||
| Poverty rate, population under 18 years old | 11.8% | 17.1% | 12.5% | 15.6% | ||
| Labor Market | ||||||
| Labor force participation rate | 61.8% | 58.7% | 61.6% | 58.4% | ||
| Population aged 25+ with a bachelor's degree or higher | 23.2% | 26.8% | 30.7% | 36.2% | 37.4% | |
| Population aged 25+ without a high school diploma | 12.1% | 12.0% | 11.0% | 9.9% | ||
| Unemployment rate | 5.89% | 5.36% | 9.06% | 3.99% | 7.52% | |
| Indicator | 2000 | 2006 | 2010 | 2019 | 2021 | 2022 |
|---|---|---|---|---|---|---|
| Housing Stock | ||||||
| Homeownership rate | 63.8% | 72.0% | 69.6% | 65.7% | 69.8% | |
| Housing units | 177,353 | 176,696 | 181,765 | 184,154 | ||
| Rental vacancy rate | 7.6% | 6.5% | 6.2% | |||
| Serious housing code violations (per 1,000 privately owned rental units) | 19.0 | 37.2 | 38.4 | 33.4 | 47.9 | |
| Severe crowding rate (% of renter households) | 1.9% | 2.8% | 4.4% | |||
| Total housing code violations (per 1,000 privately owned rental units) | 131.5 | 164.8 | 160.8 | 151.0 | 186.1 | |
| Finance - Distress | ||||||
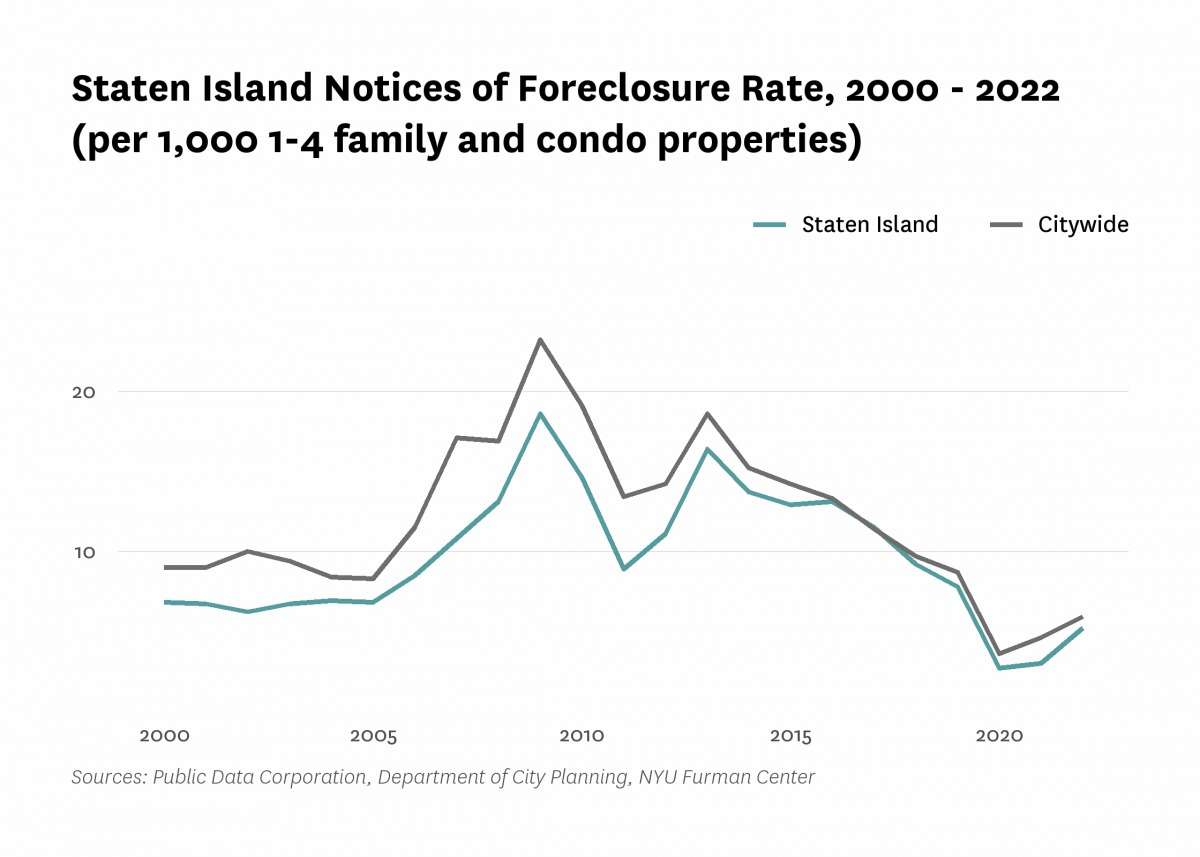
| Notices of foreclosure rate (per 1,000 1-4 family and condo properties) | 6.8 | 8.5 | 14.6 | 7.8 | 3.0 | 5.2 |
| Notices of foreclosure, all residential properties | 735 | 994 | 1,722 | 938 | 366 | 623 |
| Notices of foreclosure, initial, 1-4 family and condo properties | 690 | 757 | 1,392 | 403 | 98 | 248 |
| Notices of foreclosure, repeat, 1-4 family and condo properties | 31 | 228 | 317 | 521 | 259 | 369 |
| Pre-foreclosure notice rate (per 1,000 1-4 family and condo properties) | 51.8 | 20.0 | 44.5 | |||
| Pre-foreclosure notices, 1-4 family and condo properties | 6,145 | 2,382 | 5,309 | |||
| Properties entering REO, 1-4 family | 6 | 55 | 181 | |||
| Finance - Lending | ||||||
| FHA/VA-backed home purchase loans (% of home purchase loans) | 1.1% | 31.1% | 11.9% | 10.7% | ||
| Higher-cost home purchase loans (% of home purchase loans) | 21.6% | 0.5% | 6.7% | 5.3% | ||
| Higher-cost refinance loans (% of refinance loans) | 29.6% | 1.9% | 2.5% | 0.8% | ||
| Home purchase loan rate (per 1,000 properties) | 41.9 | 20.4 | 27.1 | 41.3 | ||
| Home purchase loans in LMI tracts (% of home purchase loans) | 8.3% | 9.9% | 7.5% | 5.7% | ||
| Home purchase loans to LMI borrowers (% of home purchase loans) | 2.8% | 5.3% | 11.6% | 16.1% | ||
| Refinance loan rate (per 1,000 properties) | 61.7 | 25.8 | 29.3 | 62.0 | ||
| Sales - Volume | ||||||
| Sales volume, 1 family building | 3,608 | 3,786 | 1,811 | 2,560 | 3,209 | 3,176 |
| Sales volume, 2-4 family building | 1,296 | 1,637 | 670 | 943 | 1,100 | 1,354 |
| Sales volume, 5+ family building | 7 | 23 | 16 | 16 | 11 | 14 |
| Sales volume, condominium | 532 | 619 | 356 | 461 | 652 | 555 |
| Sales volume, all property types | 5,443 | 6,065 | 2,853 | 3,980 | 4,972 | 5,099 |
| Sales - Median Prices | ||||||
| Median sales price per unit, 1 family building (2022$) | $356,870 | $590,140 | $510,610 | $612,390 | $636,620 | $639,440 |
| Median sales price per unit, 2-4 family building (2022$) | $230,970 | $351,240 | $306,170 | $393,020 | $411,150 | $395,000 |
| Median sales price per unit, 5+ family building (2022$) | $93,470 | $142,280 | $115,080 | $135,130 | $176,840 | $199,000 |
| Median sales price per unit, condominium (2022$) | $212,430 | $393,470 | $323,190 | $384,660 | $403,190 | $405,000 |
| Sales - Housing Price Index | ||||||
| Index of housing price appreciation, 1 family building | 100.0 | 190.2 | 174.9 | 242.3 | 269.6 | 284.1 |
| Index of housing price appreciation, 2-4 family building | 100.0 | 198.7 | 162.1 | 245.8 | 262.1 | 271.9 |
| Index of housing price appreciation, 5+ family building | 100.0 | 176.1 | 185.0 | 166.7 | 440.7 | 434.2 |
| Index of housing price appreciation, condominium | 100.0 | 225.7 | 202.2 | 279.3 | 297.7 | 315.5 |
| Index of housing price appreciation, all property types | 100.0 | 196.9 | 176.1 | 247.9 | 272.3 | 285.5 |
| Subsidized Housing | ||||||
| Total number of subsidized properties (properties) | 118 | |||||
| HUD Financing or Insurance (properties) | 10 | |||||
| HUD Financing or Insurance (units) | 815 | |||||
| HUD Project-based Rental Assistance Program (properties) | 17 | |||||
| HUD Project-based Rental Assistance Program (units) | 2,913 | |||||
| Low Income Housing Tax Credit (properties) | 27 | |||||
| Low Income Housing Tax Credit (units) | 3,827 | |||||
| Public Housing (properties) | 13 | |||||
| Public Housing (units) | 4,506 | |||||
| Mitchell-Lama (properties) | 1 | |||||
| Mitchell-Lama (units) | 536 | |||||
| 421-a Tax Exemption (properties) | 38 | |||||
| 421-a Tax Exemption (units) | 1,572 | |||||
| 420-c Tax Exemption (properties) | 13 | |||||
| 420-c Tax Exemption (units) | 1,310 | |||||
| NYC Housing Production Programs and Zoning Incentives or Requirements (properties) | 36 | |||||
| Eligible to expire from housing programs between 2023 and 2028 (properties) | 10 | |||||
| Eligible to expire from housing programs between 2023 and 2028 (units) | 511 | |||||
| Eligible to expire from housing programs between 2029 and 2038 (properties) | 9 | |||||
| Eligible to expire from housing programs between 2029 and 2038 (units) | 1,936 | |||||
| Eligible to expire from housing programs in 2039 and later (properties) | 21 | |||||
| Eligible to expire from housing programs in 2039 and later (units) | 3,406 | |||||
| Indicator | 2000 | 2006 | 2010 | 2019 | 2021 | 2022 |
|---|---|---|---|---|---|---|
| Density | ||||||
| Population density (1,000 persons per square mile) | 8.3 | 8.2 | 8.3 | 8.6 | ||
| Development | ||||||
| Units authorized by new residential building permits | 2,660 | 5 | 369 | 582 | 437 | 880 |
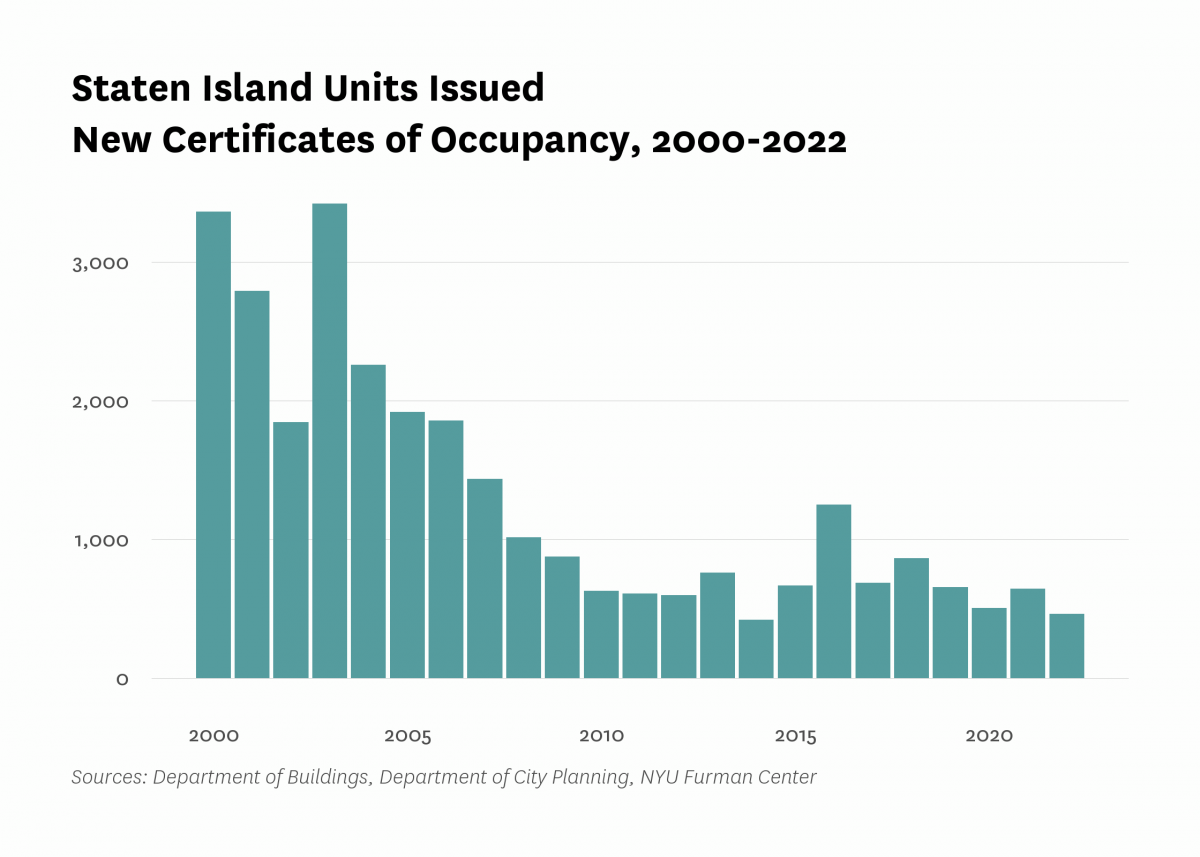
| Units issued new certificates of occupancy | 3,364 | 1,856 | 627 | 654 | 644 | 462 |
| Indicator | 2000 | 2006 | 2010 | 2019 | 2021 | 2022 |
|---|---|---|---|---|---|---|
| Commute | ||||||
| Car-free commute (% of commuters) | 31.6% | 35.8% | 33.0% | 34.2% | 25.7% | |
| Mean travel time to work (minutes) | 43.9 | 42.6 | 40.1 | 46.4 | 41.1 | |
| Crime and Incarceration | ||||||
| Serious crime rate (per 1,000 residents) | 10.5 | 7.6 | 6.3 | 5.1 | 5.2 | 6.6 |
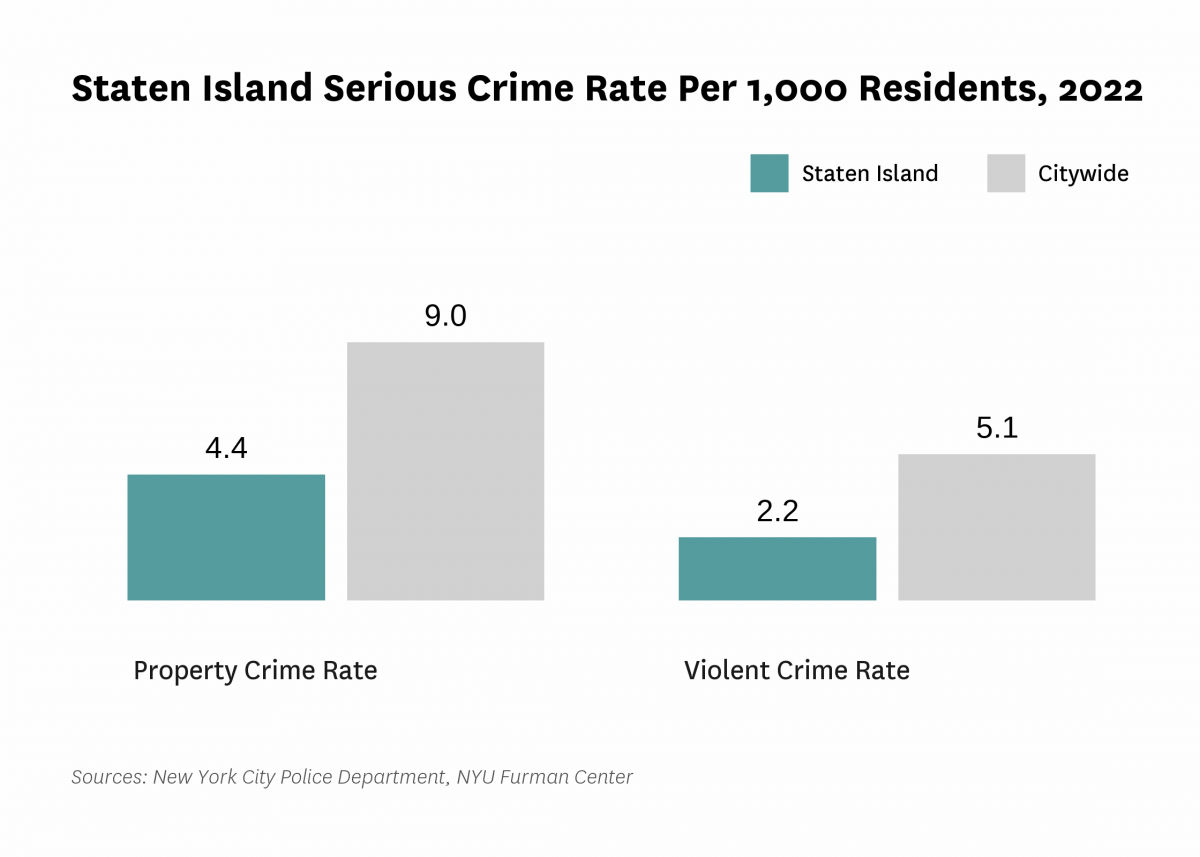
| Serious crime rate, property (per 1,000 residents) | 7.8 | 5.5 | 4.2 | 3.1 | 3.4 | 4.4 |
| Serious crime rate, violent (per 1,000 residents) | 2.7 | 2.1 | 2.1 | 1.9 | 1.7 | 2.2 |
| Schools | ||||||
| Students performing at grade level in English language arts, 4th grade | 53.5% | 49.7% | ||||
| Students performing at grade level in math, 4th grade | 54.8% | 46.8% | ||||
| Indicator | 2000 | 2006 | 2010 | 2019 | 2021 | 2022 |
|---|---|---|---|---|---|---|
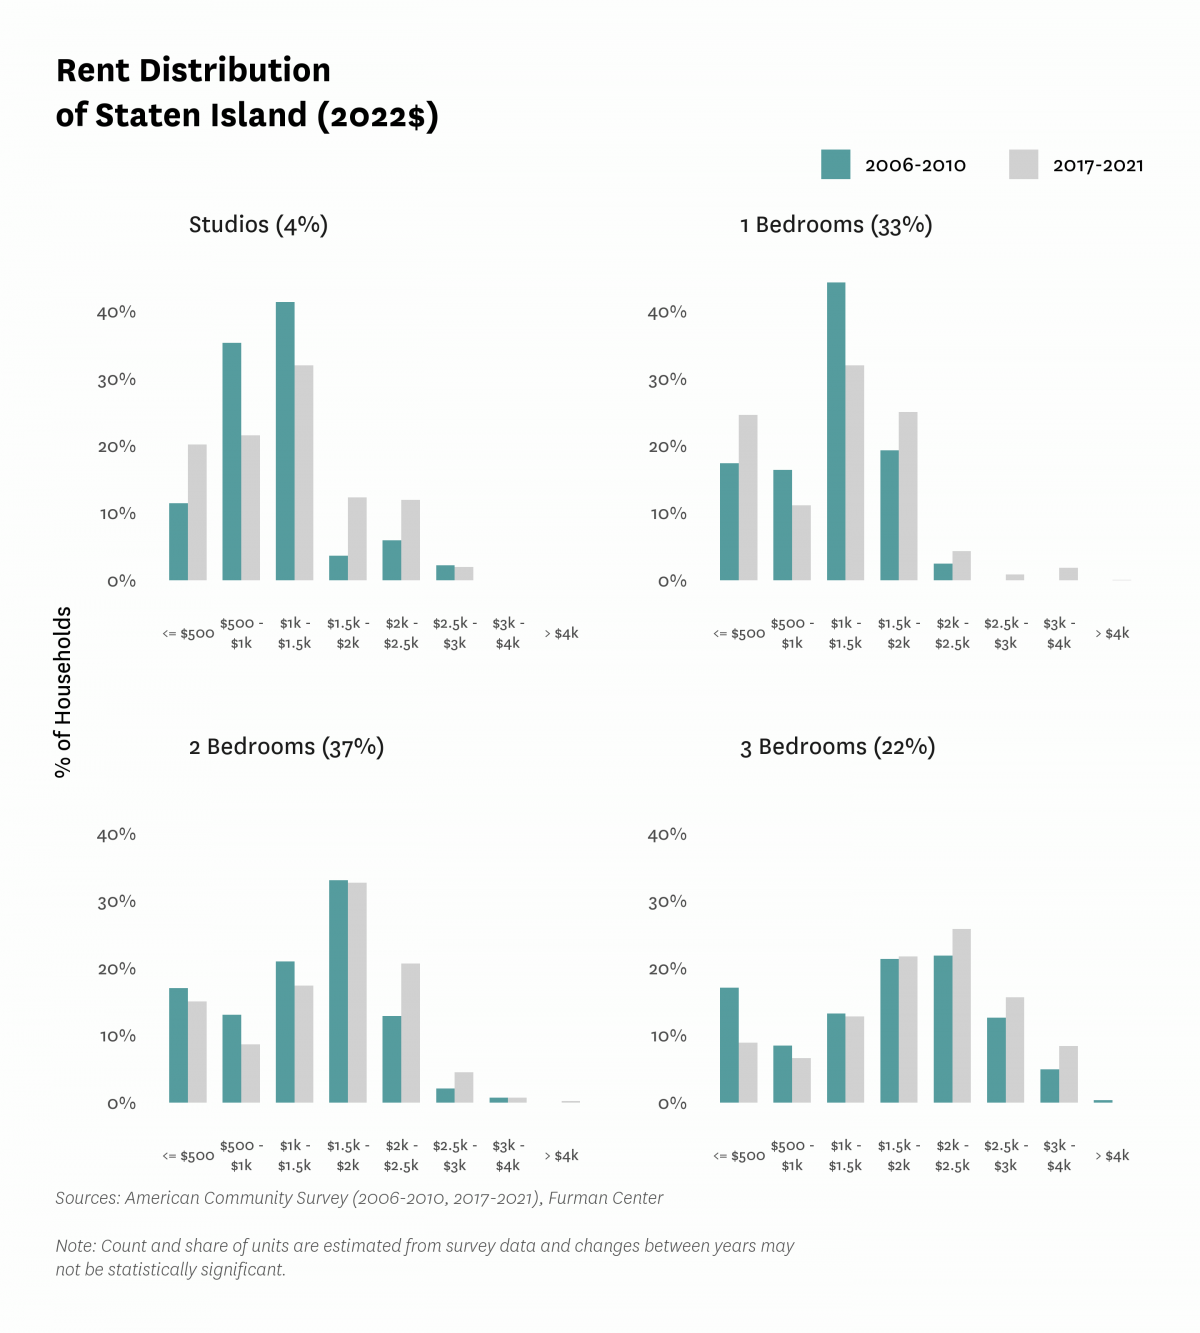
| Median Rent | ||||||
| Median rent, 2- and 3-bedrooms (2022$) | $1,600 | $1,680 | $1,830 | |||
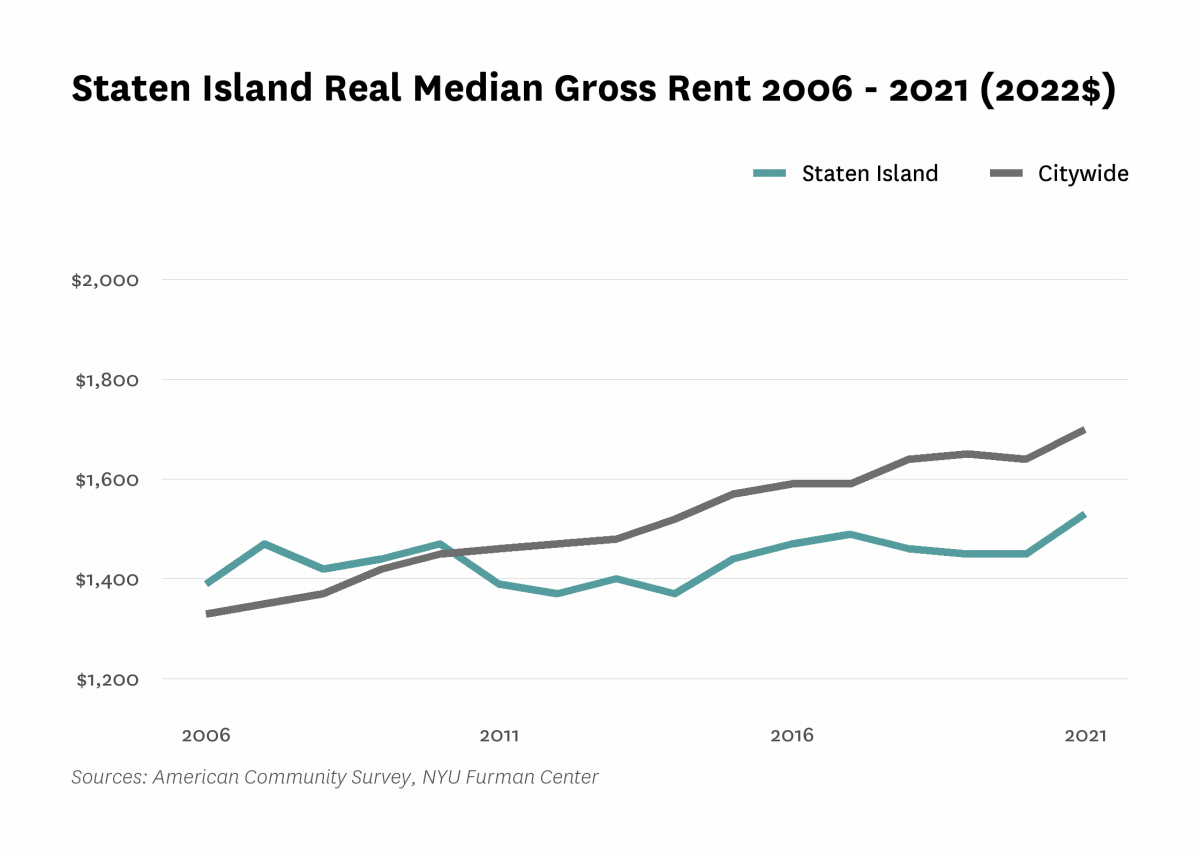
| Median rent, all (2022$) | $1,260 | $1,390 | $1,470 | $1,450 | $1,530 | |
| Median rent, recent movers (2022$) | $1,600 | $1,560 | $1,750 | |||
| Median rent, studios and 1-bedrooms (2022$) | $1,210 | $1,200 | $1,290 | |||
| Affordability | ||||||
| Rental units affordable at 30% AMI (% of recently available units) | 12.9% | 8.0% | 7.6% | |||
| Rental units affordable at 80% AMI (% of recently available units) | 62.5% | 77.7% | 69.7% | |||
| Rental units affordable at 120% AMI (% of recently available units) | 96.7% | 97.7% | 97.1% | |||
| Rent Burden | ||||||
| Moderately rent-burdened households | 24.7% | 25.1% | 25.8% | 23.0% | ||
| Moderately rent-burdened households, low income | 29.6% | 30.1% | 31.8% | |||
| Moderately rent-burdened households, moderate income | 19.7% | 10.1% | 6.6% | |||
| Severely rent-burdened households | 21.5% | 30.7% | 30.4% | 29.5% | ||
| Severely rent-burdened households, low income | 44.8% | 39.7% | 41.9% | |||
| Severely rent-burdened households, moderate income | 0.6% | 0.1% | 0.5% | |||
| Rental Subsidy | ||||||
| Housing choice vouchers (% of occupied, privately owned rental units) | 5.4% | 5.6% | ||||
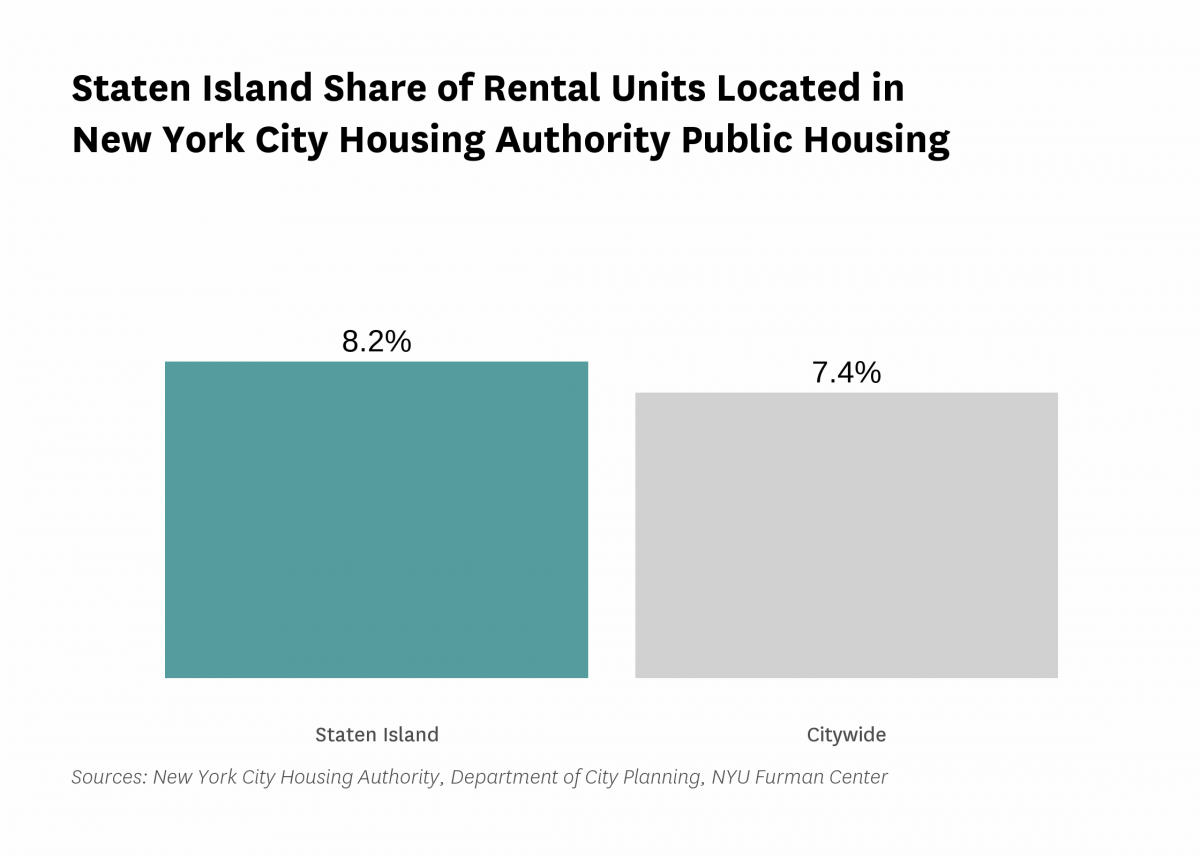
| Public housing (% of rental units) | 8.2% | |||||
Data Notes: See CoreData User Guide for more information about indicator definitions and methods.
Indicators: The rental vacancy rate, severe crowding rate, and the severely rent-burdened households indicators use five-year American Community Survey (ACS) estimates. Data under the 2010 heading comes from the 2006 – 2010 ACS, data under the 2019 heading comes from the 2015 – 2019 ACS and data under the 2021 heading comes from 2017 – 2021 ACS .
All content © 2005 – 2024 Furman Center for Real Estate and Urban Policy | Top of page | Contact Us