| Indicator | 2000 | 2006 | 2010 | 2019 | 2021 | 2022 |
|---|---|---|---|---|---|---|
| Population | ||||||
| Born in New York State | 53.4% | 51.9% | 48.6% | 46.7% | ||
| Disabled population | 4.6% | 3.1% | 5.3% | |||
| Foreign-born population | 17.4% | 16.6% | 16.1% | 16.7% | 17.5% | |
| Population | 105,555 | 110,032 | 119,558 | 114,043 | 117,511 | |
| Population aged 65+ | 8.6% | 8.1% | 7.8% | 10.6% | 11.1% | |
| Households | ||||||
| Households with children under 18 years old | 25.1% | 26.3% | 29.2% | 34.6% | 28.3% | |
| Single-person households | 34.1% | 28.7% | 24.3% | 29.2% | ||
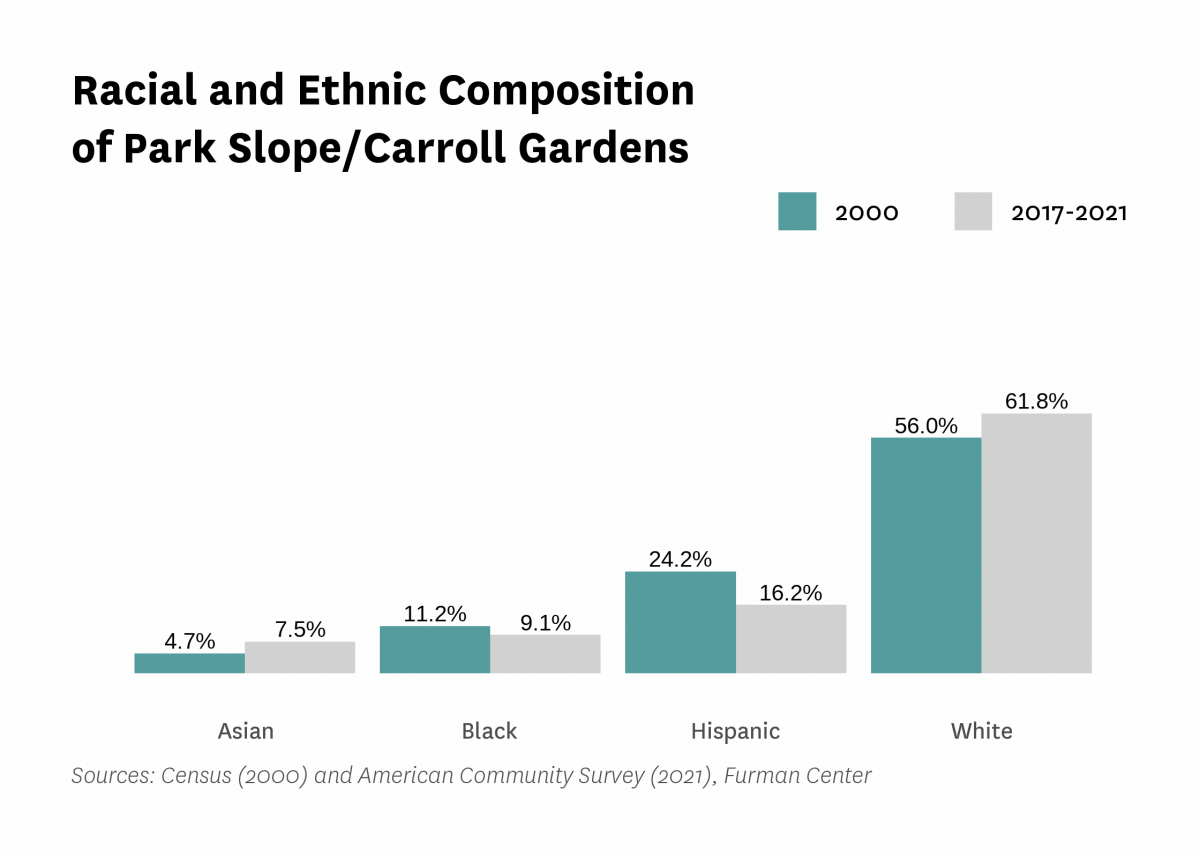
| Race and Ethnicity | ||||||
| Percent Asian | 4.7% | 6.8% | 6.0% | 8.5% | 7.5% | |
| Percent Black | 11.2% | 8.2% | 8.6% | 8.5% | 9.1% | |
| Percent Hispanic | 24.2% | 21.8% | 19.8% | 10.5% | 16.2% | |
| Percent white | 56.0% | 60.6% | 62.2% | 67.8% | 61.8% | |
| Racial diversity index | 0.61 | 0.57 | 0.56 | 0.52 | 0.58 | |
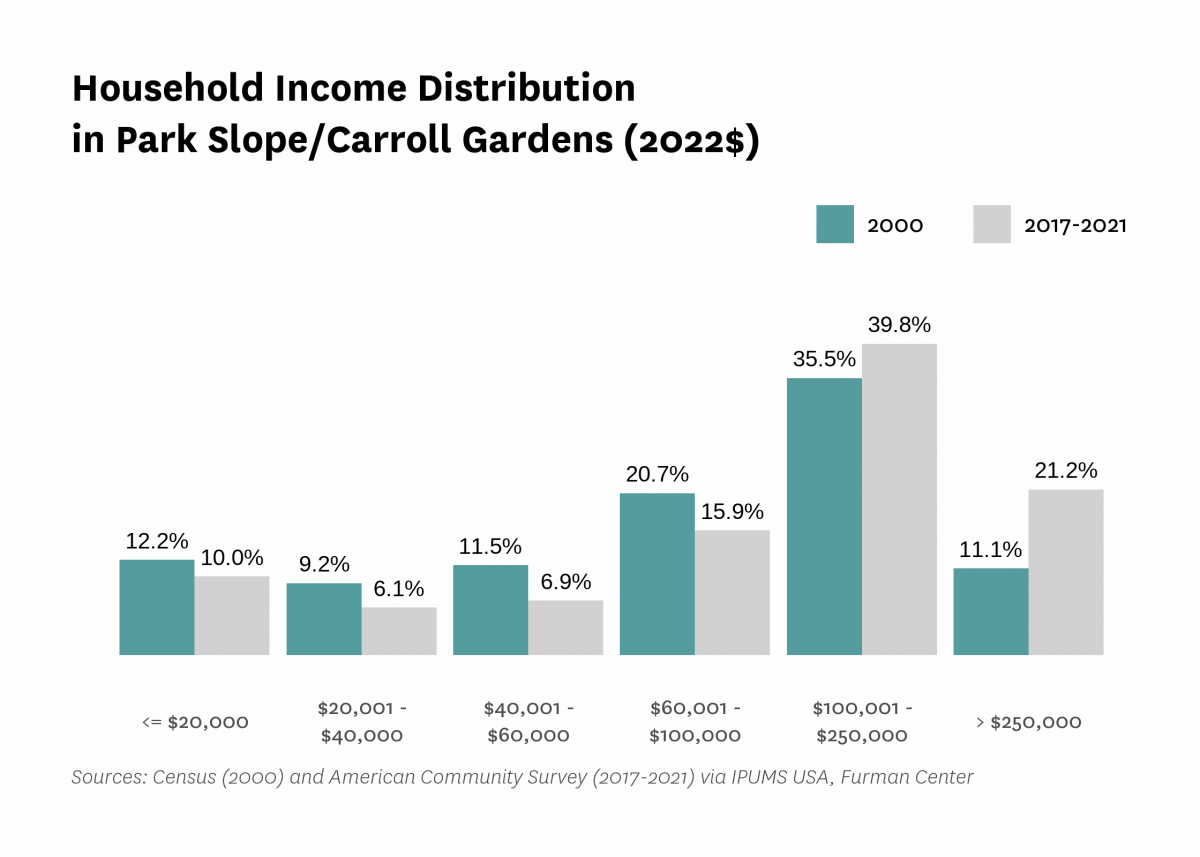
| Income and Poverty | ||||||
| Income diversity ratio | 4.4 | 5.7 | 4.9 | 5.8 | ||
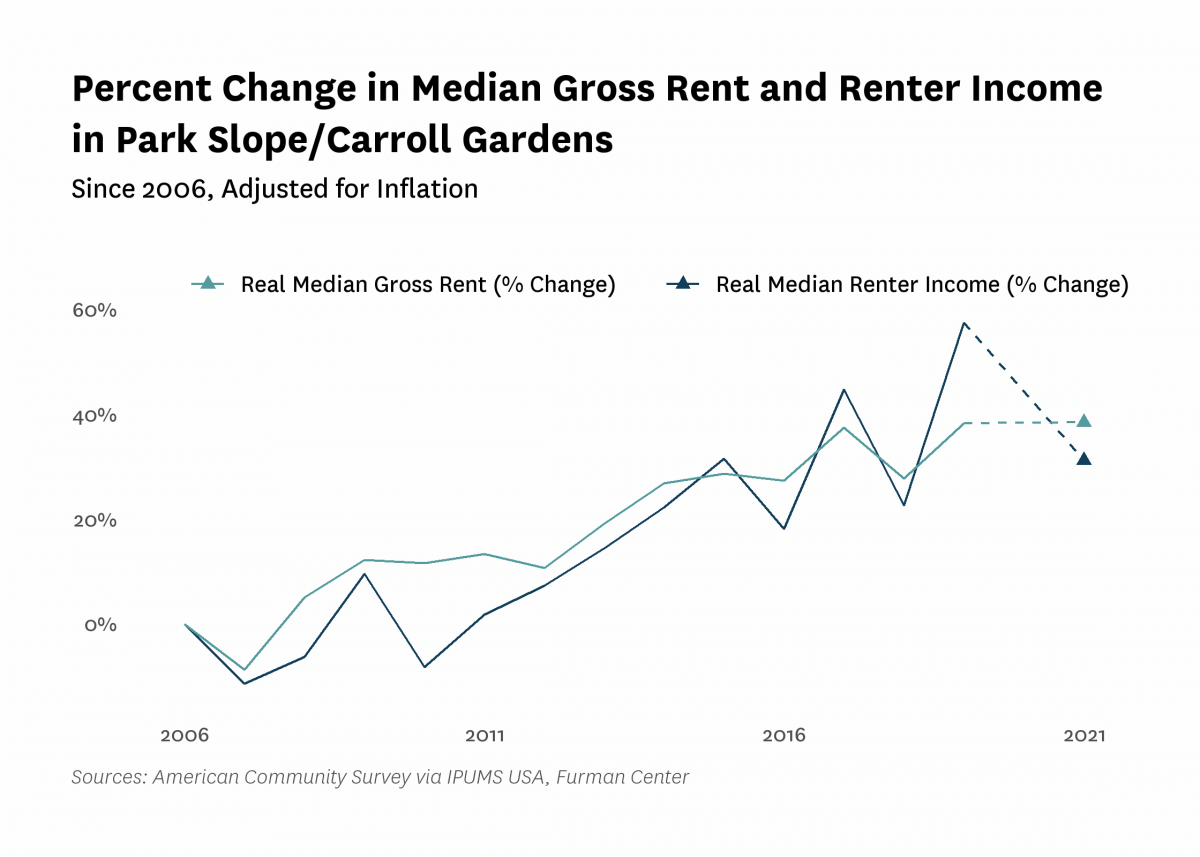
| Median household income (2022$) | $92,870 | $104,280 | $106,800 | $173,100 | $153,570 | |
| Median household income, homeowners (2022$) | $157,770 | $159,100 | $251,170 | $228,350 | ||
| Median household income, renters (2022$) | $87,250 | $80,160 | $137,480 | $114,510 | ||
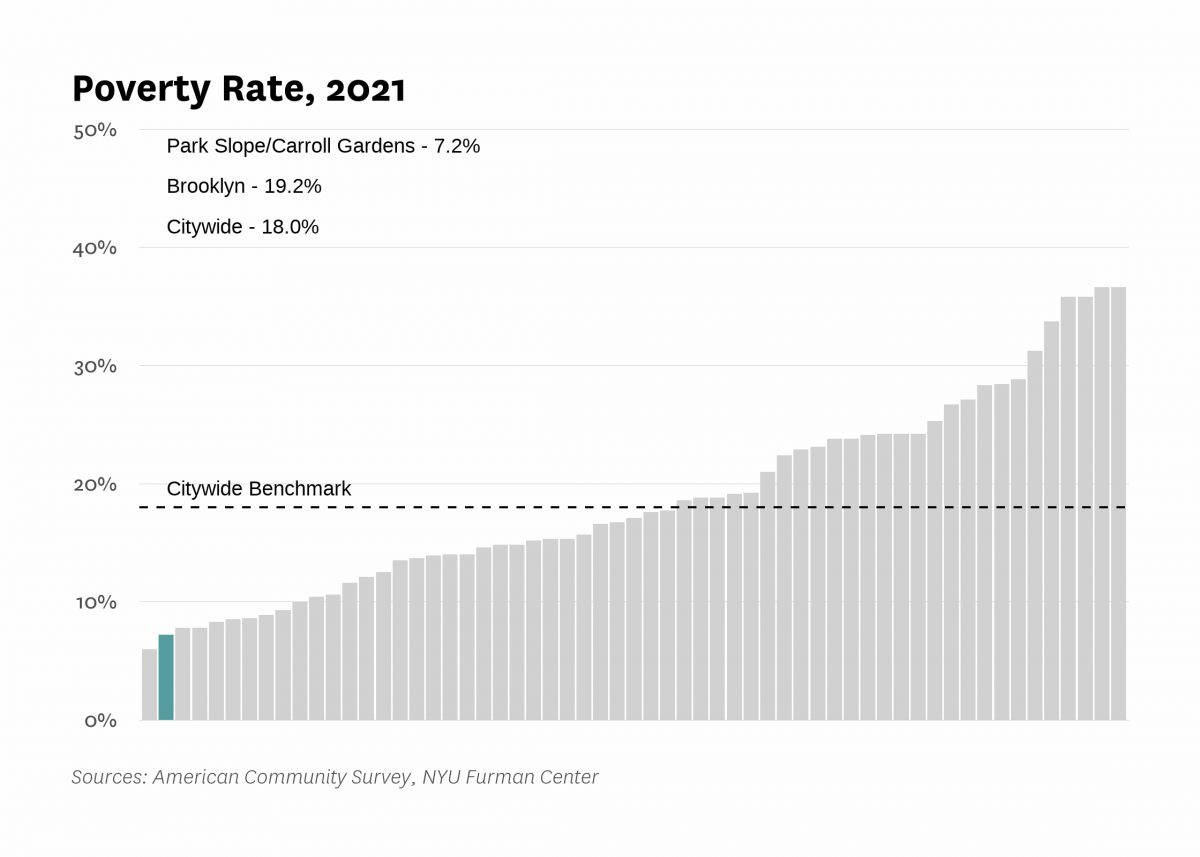
| Poverty rate | 14.4% | 12.0% | 11.3% | 7.6% | 7.2% | |
| Poverty rate, population aged 65+ | 21.5% | 16.7% | 13.1% | 10.2% | ||
| Poverty rate, population under 18 years old | 17.1% | 13.3% | 6.6% | 5.3% | ||
| Labor Market | ||||||
| Labor force participation rate | 74.4% | 76.7% | 77.1% | 78.3% | ||
| Population aged 25+ without a high school diploma | 12.0% | 9.5% | 5.4% | 4.9% | ||
| Unemployment rate | 5.51% | 5.14% | 7.88% | 3.41% | 8.79% | |
| Indicator | 2000 | 2006 | 2010 | 2019 | 2021 | 2022 |
|---|---|---|---|---|---|---|
| Housing Stock | ||||||
| Homeownership rate | 28.7% | 34.7% | 36.0% | 39.5% | 35.8% | |
| Housing units | 50,284 | 55,234 | 50,019 | 56,647 | ||
| Rental vacancy rate | 2.5% | 3.1% | 5.3% | |||
| Serious housing code violations (per 1,000 privately owned rental units) | 20.3 | 18.0 | 25.7 | 46.2 | 38.3 | |
| Severe crowding rate (% of renter households) | 1.6% | 2.5% | 2.4% | |||
| Total housing code violations (per 1,000 privately owned rental units) | 115.5 | 76.9 | 110.2 | 314.1 | 266.4 | |
| Finance - Distress | ||||||
| Notices of foreclosure rate (per 1,000 1-4 family and condo properties) | 3.8 | 3.9 | 4.4 | 2.3 | 0.9 | 3.2 |
| Notices of foreclosure, all residential properties | 43 | 48 | 69 | 34 | 14 | 53 |
| Notices of foreclosure, initial, 1-4 family and condo properties | 23 | 33 | 38 | 15 | 8 | 29 |
| Notices of foreclosure, repeat, 1-4 family and condo properties | 13 | 10 | 17 | 16 | 5 | 15 |
| Pre-foreclosure notice rate (per 1,000 1-4 family and condo properties) | 13.5 | 8.2 | 16.4 | |||
| Pre-foreclosure notices, 1-4 family and condo properties | 182 | 114 | 228 | |||
| Properties entering REO, 1-4 family | 4 | 1 | 0 | |||
| Finance - Lending | ||||||
| FHA/VA-backed home purchase loans (% of home purchase loans) | 0.1% | 6.4% | 0.0% | 0.2% | ||
| Higher-cost home purchase loans (% of home purchase loans) | 4.1% | 0.7% | 0.5% | 0.6% | ||
| Higher-cost refinance loans (% of refinance loans) | 14.5% | 1.2% | 0.5% | 0.3% | ||
| Home purchase loan rate (per 1,000 properties) | 49.8 | 42.7 | 32.9 | 60.4 | ||
| Home purchase loans in LMI tracts (% of home purchase loans) | 7.8% | 6.0% | 0.3% | 0.4% | ||
| Home purchase loans to LMI borrowers (% of home purchase loans) | 1.7% | 19.7% | 0.6% | 1.1% | ||
| Refinance loan rate (per 1,000 properties) | 30.2 | 38.6 | 28.9 | 63.2 | ||
| Sales - Volume | ||||||
| Sales volume, 1 family building | 33 | 28 | 28 | 22 | 45 | 42 |
| Sales volume, 2-4 family building | 226 | 293 | 166 | 110 | 172 | 221 |
| Sales volume, 5+ family building | 35 | 54 | 37 | 25 | 42 | 50 |
| Sales volume, condominium | 136 | 317 | 404 | 313 | 519 | 421 |
| Sales volume, all property types | 430 | 692 | 635 | 470 | 778 | 734 |
| Sales - Median Prices | ||||||
| Median sales price per unit, 1 family building (2022$) | $722,250 | $1,774,140 | $1,924,350 | $2,811,240 | $3,978,850 | $3,547,500 |
| Median sales price per unit, 2-4 family building (2022$) | $325,010 | $667,500 | $658,300 | $1,114,770 | $1,136,180 | $1,132,500 |
| Median sales price per unit, 5+ family building (2022$) | $106,000 | $199,900 | $208,290 | $696,850 | $367,600 | $557,780 |
| Median sales price per unit, condominium (2022$) | $422,180 | $922,930 | $809,530 | $1,521,920 | $1,315,670 | $1,541,250 |
| Sales - Housing Price Index | ||||||
| Index of housing price appreciation, 1 family building | 100.0 | 241.5 | 220.5 | 446.6 | 455.7 | 538.1 |
| Index of housing price appreciation, 2-4 family building | 100.0 | 247.6 | 255.4 | 466.1 | 517.6 | 547.6 |
| Index of housing price appreciation, 5+ family building | 100.0 | 247.1 | 325.2 | 761.8 | 630.9 | 855.4 |
| Index of housing price appreciation, condominium | 100.0 | 262.3 | 253.1 | 427.5 | 455.7 | 496.3 |
| Index of housing price appreciation, all property types | 100.0 | 258.1 | 263.1 | 458.1 | 487.7 | 543.2 |
| Subsidized Housing | ||||||
| Total number of subsidized properties (properties) | 112 | |||||
| HUD Financing or Insurance (properties) | 0 | |||||
| HUD Financing or Insurance (units) | 0 | |||||
| HUD Project-based Rental Assistance Program (properties) | 2 | |||||
| HUD Project-based Rental Assistance Program (units) | 126 | |||||
| Low Income Housing Tax Credit (properties) | 22 | |||||
| Low Income Housing Tax Credit (units) | 682 | |||||
| Public Housing (properties) | 6 | |||||
| Public Housing (units) | 4,781 | |||||
| Mitchell-Lama (properties) | 0 | |||||
| Mitchell-Lama (units) | 0 | |||||
| 421-a Tax Exemption (properties) | 114 | |||||
| 421-a Tax Exemption (units) | 3,989 | |||||
| 420-c Tax Exemption (properties) | 31 | |||||
| 420-c Tax Exemption (units) | 424 | |||||
| NYC Housing Production Programs and Zoning Incentives or Requirements (properties) | 46 | |||||
| Eligible to expire from housing programs between 2023 and 2028 (properties) | 8 | |||||
| Eligible to expire from housing programs between 2023 and 2028 (units) | 158 | |||||
| Eligible to expire from housing programs between 2029 and 2038 (properties) | 10 | |||||
| Eligible to expire from housing programs between 2029 and 2038 (units) | 212 | |||||
| Eligible to expire from housing programs in 2039 and later (properties) | 5 | |||||
| Eligible to expire from housing programs in 2039 and later (units) | 337 | |||||
| Indicator | 2000 | 2006 | 2010 | 2019 | 2021 | 2022 |
|---|---|---|---|---|---|---|
| Density | ||||||
| Population density (1,000 persons per square mile) | 27.5 | 29.9 | 28.5 | 29.4 | ||
| Development | ||||||
| Units authorized by new residential building permits | 101 | 0 | 15 | 199 | 208 | 7,206 |
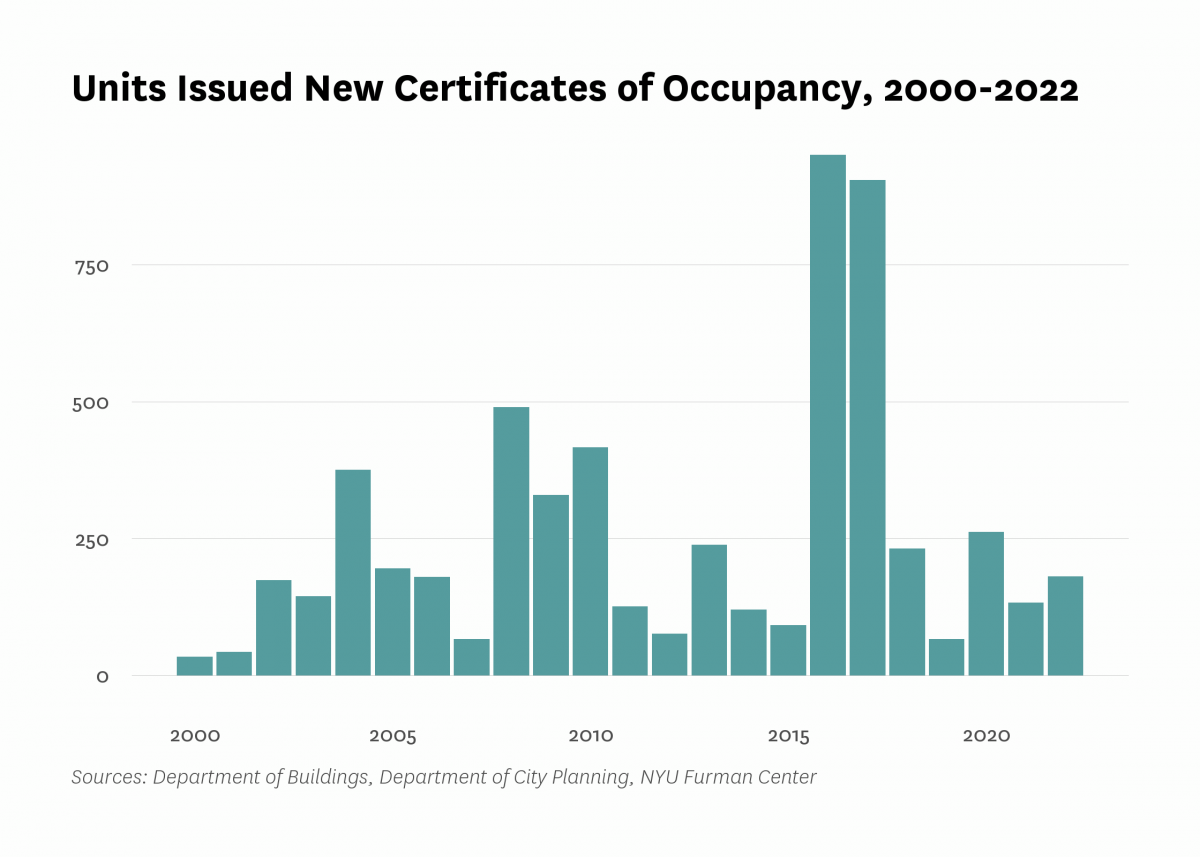
| Units issued new certificates of occupancy | 34 | 180 | 417 | 67 | 133 | 181 |
| Indicator | 2000 | 2006 | 2010 | 2019 | 2021 | 2022 |
|---|---|---|---|---|---|---|
| Commute | ||||||
| Car-free commute (% of commuters) | 81.5% | 82.9% | 88.6% | 87.4% | 81.6% | |
| Mean travel time to work (minutes) | 37.9 | 37.4 | 37.5 | 39.9 | 35.5 | |
| Crime and Incarceration | ||||||
| Serious crime rate (per 1,000 residents) | 14.8 | 12.5 | 9.0 | 9.4 | 12.0 | |
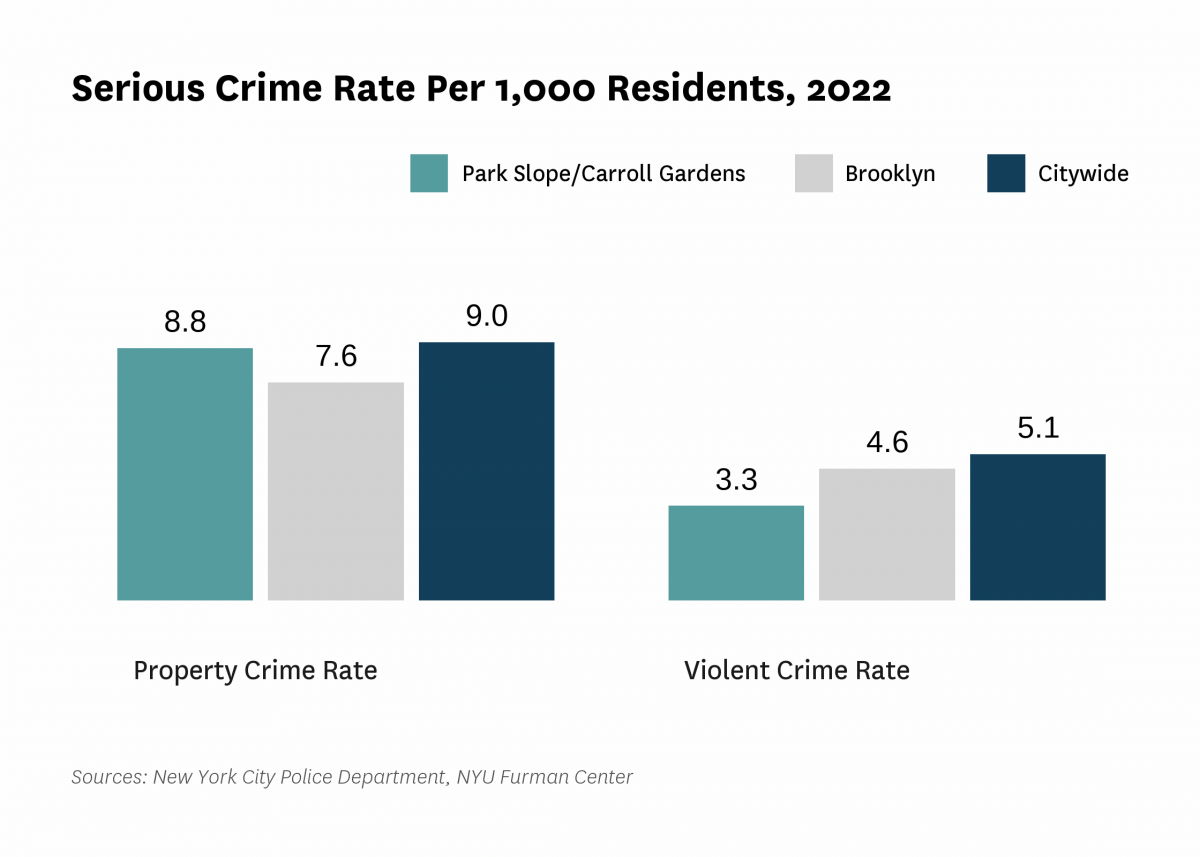
| Serious crime rate, property (per 1,000 residents) | 10.6 | 9.3 | 6.8 | 6.8 | 8.8 | |
| Serious crime rate, violent (per 1,000 residents) | 4.2 | 3.2 | 2.2 | 2.6 | 3.3 | |
| Schools | ||||||
| Students performing at grade level in English language arts, 4th grade | 73.8% | 75.6% | ||||
| Students performing at grade level in math, 4th grade | 70.4% | 73.7% | ||||
| Indicator | 2000 | 2006 | 2010 | 2019 | 2021 | 2022 |
|---|---|---|---|---|---|---|
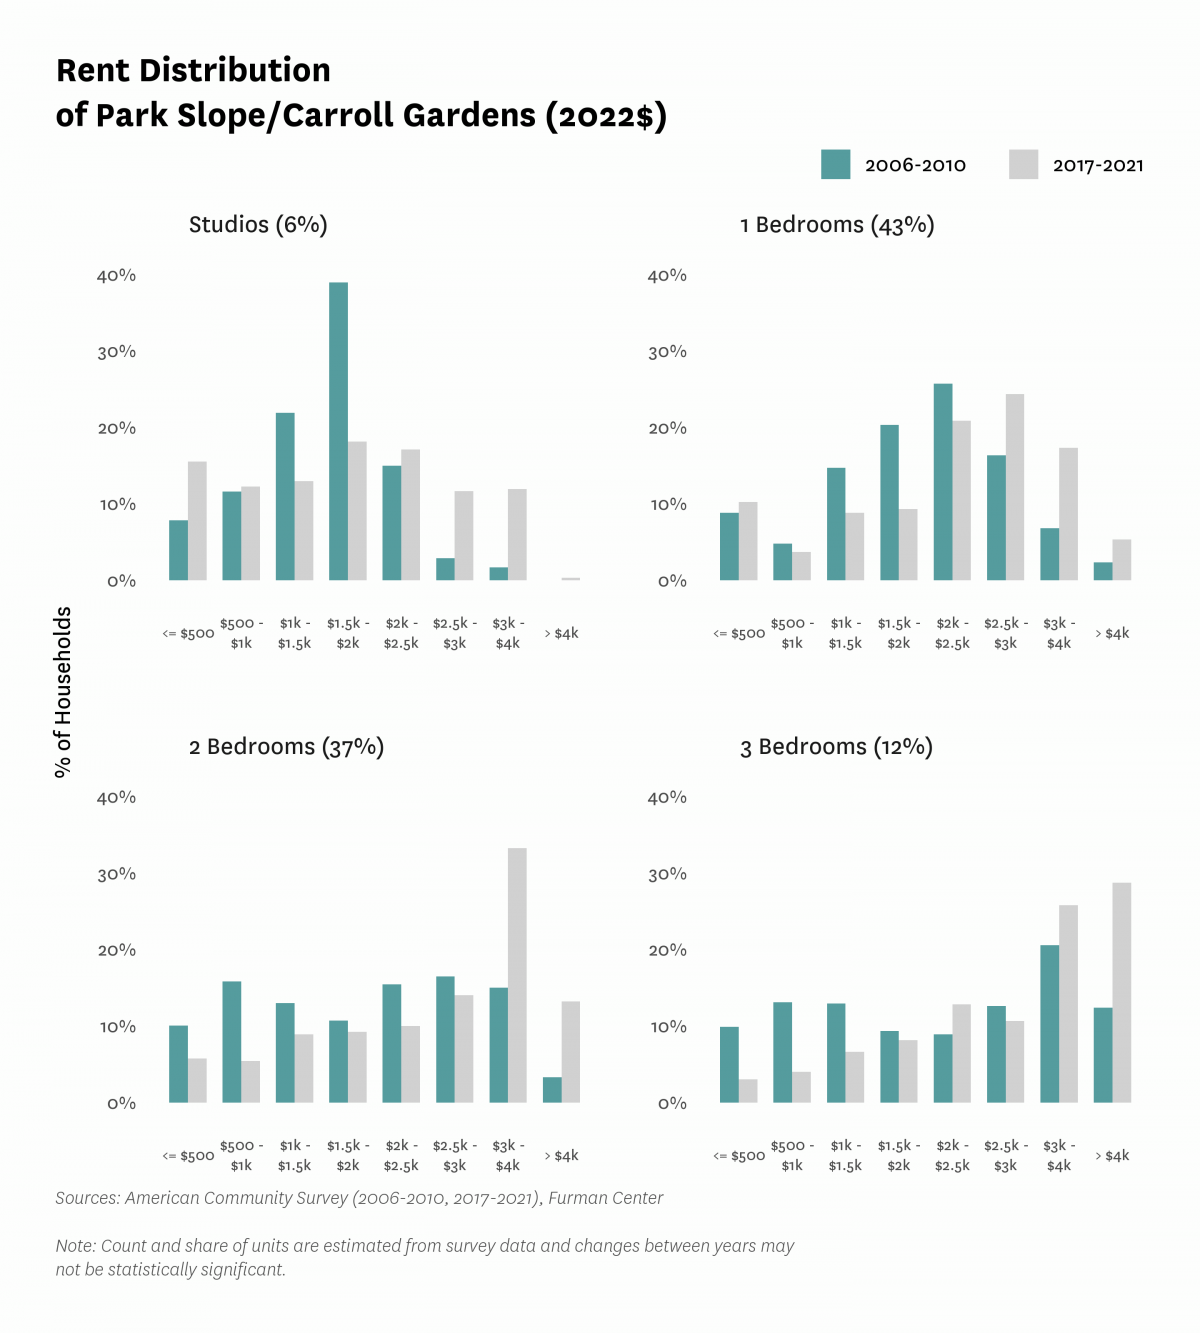
| Median Rent | ||||||
| Median rent, 2- and 3-bedrooms (2022$) | $2,090 | $2,790 | $2,950 | |||
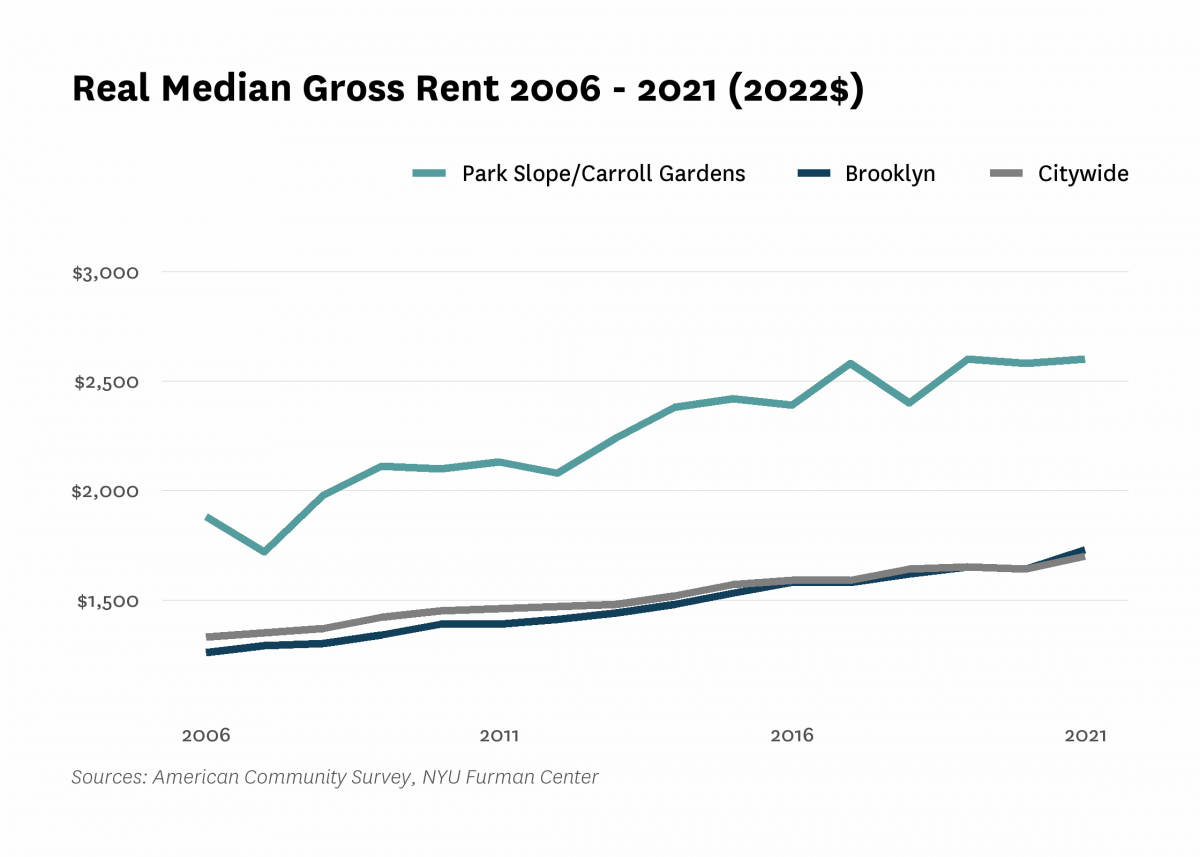
| Median rent, all (2022$) | $1,500 | $1,880 | $2,100 | $2,600 | $2,600 | |
| Median rent, recent movers (2022$) | $2,510 | $2,880 | $3,050 | |||
| Median rent, studios and 1-bedrooms (2022$) | $1,970 | $2,230 | $2,340 | |||
| Change in collected rent (2019-2020) | -2.8% | |||||
| Affordability | ||||||
| Rental units affordable at 30% AMI (% of recently available units) | 2.8% | 2.1% | 2.2% | |||
| Rental units affordable at 80% AMI (% of recently available units) | 10.1% | 15.2% | 14.8% | |||
| Rental units affordable at 120% AMI (% of recently available units) | 55.5% | 59.6% | 60.3% | |||
| Rent Burden | ||||||
| Moderately rent-burdened households | 19.0% | 25.7% | 19.4% | 23.0% | ||
| Moderately rent-burdened households, low income | 30.1% | 24.1% | 31.3% | |||
| Moderately rent-burdened households, moderate income | 42.1% | 49.3% | 42.4% | |||
| Severely rent-burdened households | 18.4% | 17.1% | 17.2% | 14.5% | ||
| Severely rent-burdened households, low income | 40.7% | 47.1% | 42.6% | |||
| Severely rent-burdened households, moderate income | 5.1% | 3.7% | 3.3% | |||
| Rental Subsidy | ||||||
| Housing choice vouchers (% of occupied, privately owned rental units) | 1.2% | 0.9% | ||||
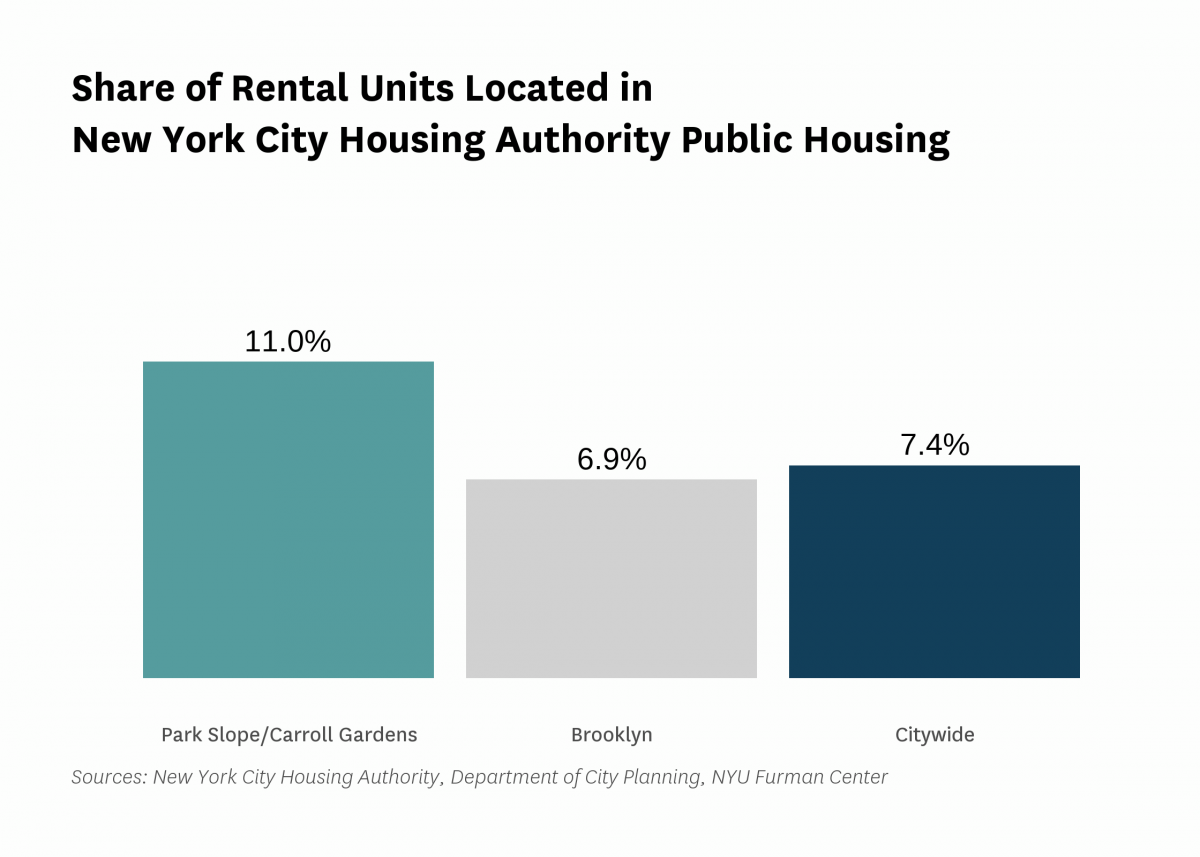
| Public housing (% of rental units) | 11.0% | |||||


Data Notes: See CoreData User Guide for more information about indicator definitions and methods.
Indicators: The rental vacancy rate, severe crowding rate, and the severely rent-burdened households indicators use five-year American Community Survey (ACS) estimates. Data under the 2010 heading comes from the 2006 – 2010 ACS, data under the 2019 heading comes from the 2015 – 2019 ACS and data under the 2021 heading comes from 2017 – 2021 ACS .
All content © 2005 – 2024 Furman Center for Real Estate and Urban Policy | Top of page | Contact Us