| Indicator | 2000 | 2006 | 2010 | 2019 | 2021 | 2022 |
|---|---|---|---|---|---|---|
| Population | ||||||
| Born in New York State | 44.5% | 48.5% | 46.5% | 45.3% | ||
| Disabled population | 10.9% | 8.1% | 9.9% | |||
| Foreign-born population | 36.6% | 41.3% | 40.7% | 44.4% | 42.8% | |
| Population | 132,672 | 124,968 | 124,826 | 151,684 | 130,407 | |
| Population aged 65+ | 7.6% | 9.7% | 8.6% | 9.6% | 9.7% | |
| Households | ||||||
| Households with children under 18 years old | 47.4% | 43.3% | 44.1% | 35.0% | 34.4% | |
| Single-person households | 28.0% | 32.8% | 35.3% | 34.6% | ||
| Race and Ethnicity | ||||||
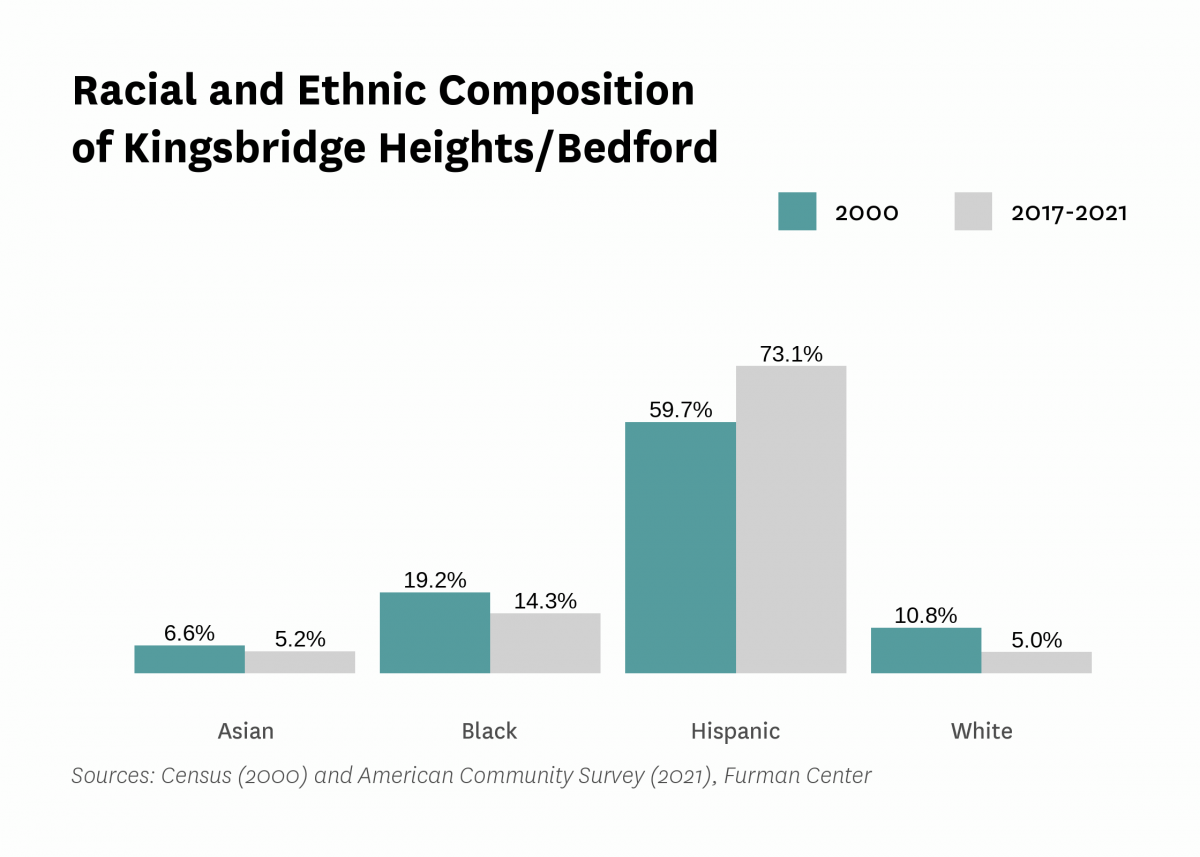
| Percent Asian | 6.6% | 6.4% | 5.0% | 6.5% | 5.2% | |
| Percent Black | 19.2% | 20.0% | 20.7% | 12.7% | 14.3% | |
| Percent Hispanic | 59.7% | 61.9% | 66.0% | 73.2% | 73.1% | |
| Percent white | 10.8% | 7.4% | 7.2% | 6.2% | 5.0% | |
| Racial diversity index | 0.59 | 0.57 | 0.51 | 0.44 | 0.44 | |
| Income and Poverty | ||||||
| Income diversity ratio | 5.0 | 5.3 | 5.8 | 5.8 | ||
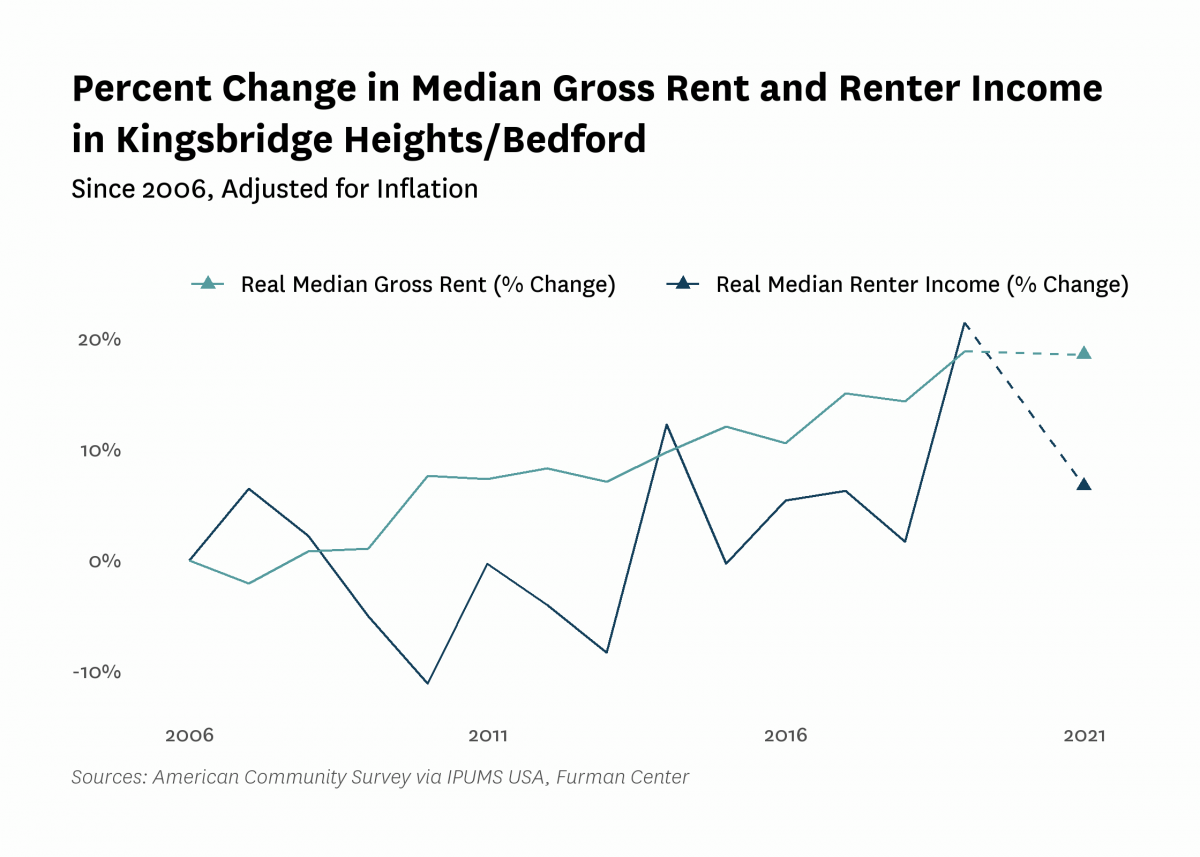
| Median household income (2022$) | $47,660 | $39,720 | $35,040 | $46,090 | $39,950 | |
| Median household income, homeowners (2022$) | $71,440 | $90,190 | $106,320 | $82,190 | ||
| Median household income, renters (2022$) | $36,710 | $32,630 | $44,570 | $39,170 | ||
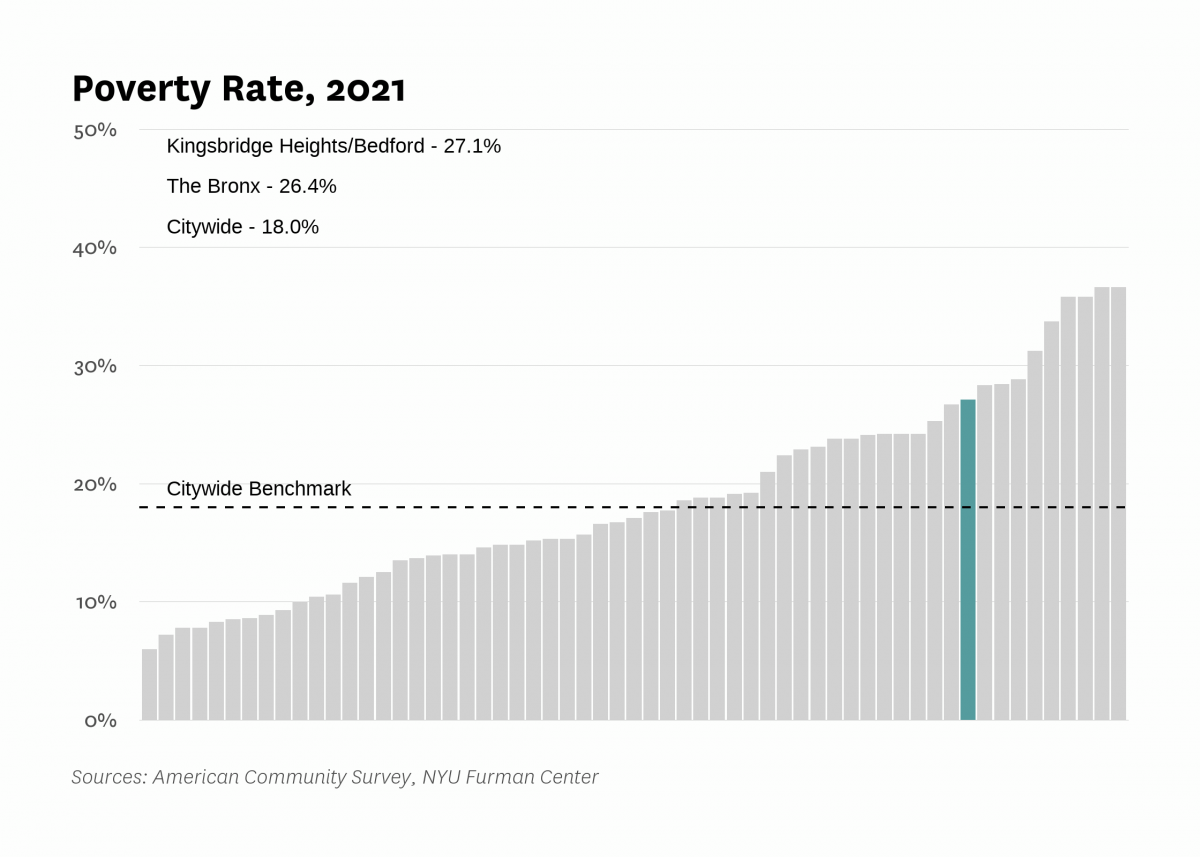
| Poverty rate | 34.3% | 34.2% | 32.7% | 22.6% | 27.1% | |
| Poverty rate, population aged 65+ | 25.9% | 32.5% | 27.0% | 34.3% | ||
| Poverty rate, population under 18 years old | 47.6% | 41.4% | 30.8% | 35.3% | ||
| Labor Market | ||||||
| Labor force participation rate | 57.8% | 61.7% | 69.6% | 64.2% | ||
| Population aged 25+ without a high school diploma | 33.3% | 35.6% | 31.7% | 25.9% | ||
| Unemployment rate | 14.93% | 13.22% | 17.62% | 11.73% | 16.94% | |
| Indicator | 2000 | 2006 | 2010 | 2019 | 2021 | 2022 |
|---|---|---|---|---|---|---|
| Housing Stock | ||||||
| Homeownership rate | 7.4% | 9.4% | 6.3% | 5.9% | 7.1% | |
| Housing units | 48,375 | 47,257 | 53,228 | 52,875 | ||
| Rental vacancy rate | 3.5% | 2.8% | 2.7% | |||
| Serious housing code violations (per 1,000 privately owned rental units) | 152.1 | 149.0 | 172.8 | 187.0 | 196.3 | |
| Severe crowding rate (% of renter households) | 4.9% | 7.8% | 8.3% | |||
| Total housing code violations (per 1,000 privately owned rental units) | 716.5 | 633.0 | 558.9 | 592.9 | 564.8 | |
| Finance - Distress | ||||||
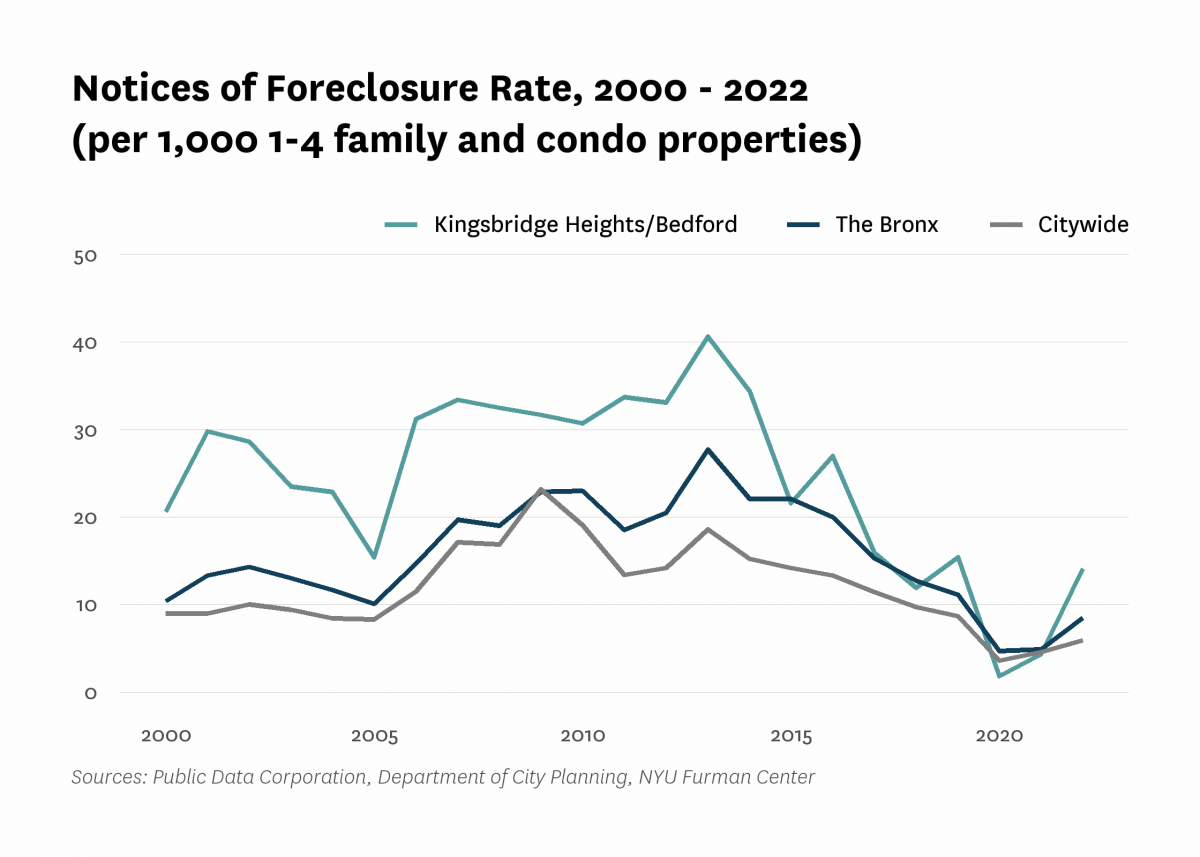
| Notices of foreclosure rate (per 1,000 1-4 family and condo properties) | 20.6 | 31.2 | 30.7 | 15.4 | 4.3 | 14.1 |
| Notices of foreclosure, all residential properties | 41 | 55 | 64 | 29 | 9 | 26 |
| Notices of foreclosure, initial, 1-4 family and condo properties | 30 | 43 | 36 | 11 | 3 | 11 |
| Notices of foreclosure, repeat, 1-4 family and condo properties | 4 | 10 | 17 | 15 | 4 | 12 |
| Pre-foreclosure notice rate (per 1,000 1-4 family and condo properties) | 102.2 | 47.3 | 102.2 | |||
| Pre-foreclosure notices, 1-4 family and condo properties | 172 | 77 | 166 | |||
| Properties entering REO, 1-4 family | 10 | 1 | 5 | |||
| Finance - Lending | ||||||
| FHA/VA-backed home purchase loans (% of home purchase loans) | 0.0% | 33.3% | 6.5% | 8.3% | ||
| Higher-cost home purchase loans (% of home purchase loans) | 27.1% | 0.0% | 4.3% | 4.6% | ||
| Higher-cost refinance loans (% of refinance loans) | 33.5% | 4.0% | 6.4% | 3.4% | ||
| Home purchase loan rate (per 1,000 properties) | 43.7 | 12.6 | 18.3 | 21.8 | ||
| Home purchase loans in LMI tracts (% of home purchase loans) | 77.3% | 21.2% | 57.6% | 71.3% | ||
| Home purchase loans to LMI borrowers (% of home purchase loans) | 18.6% | 78.8% | 28.6% | 42.1% | ||
| Refinance loan rate (per 1,000 properties) | 35.9 | 9.5 | 9.4 | 17.6 | ||
| Sales - Volume | ||||||
| Sales volume, 1 family building | 25 | 42 | 8 | 17 | 13 | 30 |
| Sales volume, 2-4 family building | 58 | 119 | 28 | 35 | 31 | 46 |
| Sales volume, 5+ family building | 26 | 63 | 26 | 16 | 22 | 18 |
| Sales volume, condominium | 0 | 2 | 8 | 2 | 1 | 2 |
| Sales volume, all property types | 109 | 226 | 70 | 70 | 67 | 96 |
| Sales - Median Prices | ||||||
| Median sales price per unit, 1 family building (2022$) | $322,890 | $509,140 | $342,250 | $668,970 | $562,340 | $741,000 |
| Median sales price per unit, 2-4 family building (2022$) | $160,560 | $323,210 | $246,260 | $340,060 | $419,110 | $366,670 |
| Median sales price per unit, 5+ family building (2022$) | $59,710 | $107,060 | $79,890 | $190,740 | $140,710 | $129,930 |
| Median sales price per unit, condominium (2022$) | $200,250 | $466,770 | $278,740 | $302,390 | $337,500 | |
| Sales - Housing Price Index | ||||||
| Index of housing price appreciation, 1 family building | 100.0 | 218.4 | 133.1 | 290.1 | 308.3 | 409.3 |
| Index of housing price appreciation, 2-4 family building | 100.0 | 209.0 | 165.7 | 328.2 | 380.2 | 355.5 |
| Index of housing price appreciation, 5+ family building | 100.0 | 244.7 | 186.6 | 539.4 | 405.4 | 328.4 |
| Index of housing price appreciation, condominium info | 100.0 | |||||
| Index of housing price appreciation, all property types | 100.0 | 221.5 | 162.7 | 357.4 | 380.9 | 384.1 |
| Subsidized Housing | ||||||
| Total number of subsidized properties (properties) | 205 | |||||
| HUD Financing or Insurance (properties) | 6 | |||||
| HUD Financing or Insurance (units) | 234 | |||||
| HUD Project-based Rental Assistance Program (properties) | 10 | |||||
| HUD Project-based Rental Assistance Program (units) | 426 | |||||
| Low Income Housing Tax Credit (properties) | 34 | |||||
| Low Income Housing Tax Credit (units) | 2,740 | |||||
| Public Housing (properties) | 1 | |||||
| Public Housing (units) | 233 | |||||
| Mitchell-Lama (properties) | 10 | |||||
| Mitchell-Lama (units) | 1,713 | |||||
| 421-a Tax Exemption (properties) | 45 | |||||
| 421-a Tax Exemption (units) | 1,475 | |||||
| 420-c Tax Exemption (properties) | 35 | |||||
| 420-c Tax Exemption (units) | 2,690 | |||||
| NYC Housing Production Programs and Zoning Incentives or Requirements (properties) | 94 | |||||
| Eligible to expire from housing programs between 2023 and 2028 (properties) | 7 | |||||
| Eligible to expire from housing programs between 2023 and 2028 (units) | 313 | |||||
| Eligible to expire from housing programs between 2029 and 2038 (properties) | 16 | |||||
| Eligible to expire from housing programs between 2029 and 2038 (units) | 2,004 | |||||
| Eligible to expire from housing programs in 2039 and later (properties) | 30 | |||||
| Eligible to expire from housing programs in 2039 and later (units) | 2,076 | |||||
| Indicator | 2000 | 2006 | 2010 | 2019 | 2021 | 2022 |
|---|---|---|---|---|---|---|
| Density | ||||||
| Population density (1,000 persons per square mile) | 79.7 | 79.6 | 96.7 | 83.2 | ||
| Development | ||||||
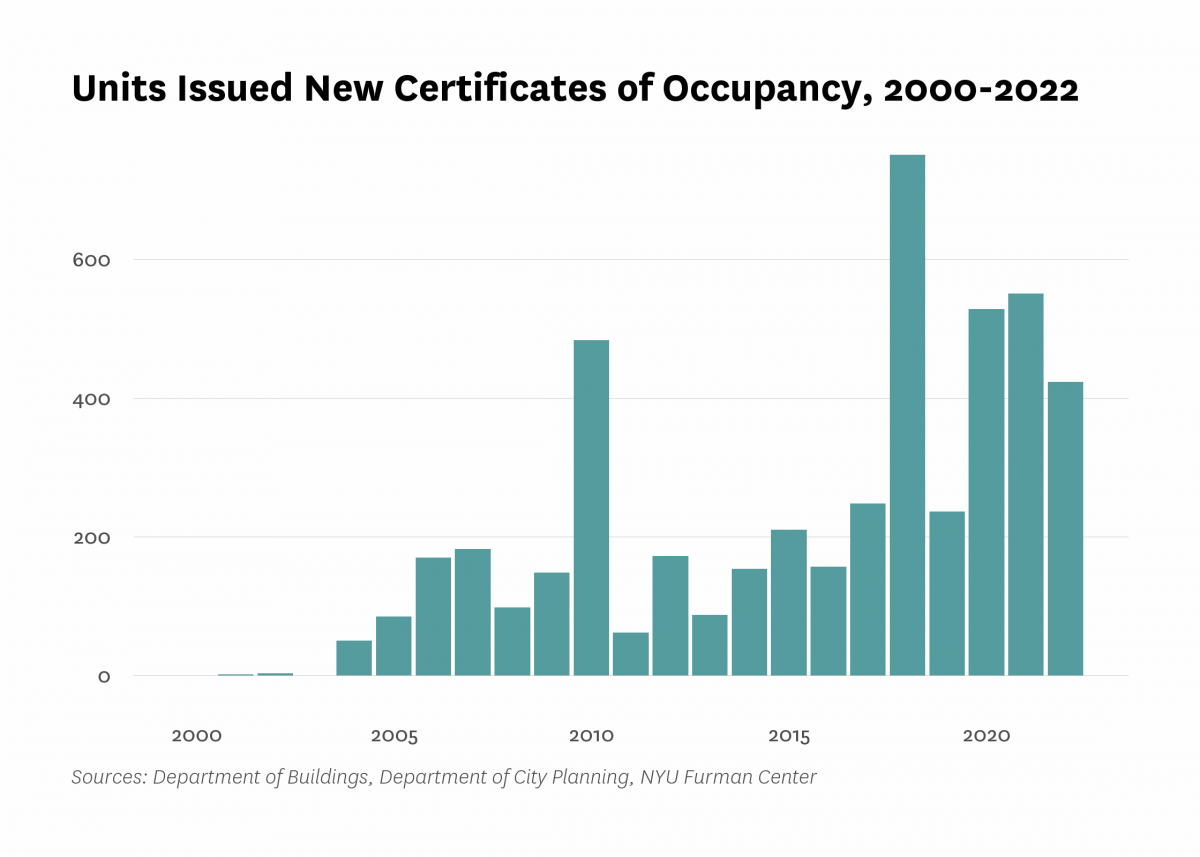
| Units authorized by new residential building permits | 3 | 0 | 84 | 536 | 804 | 1,242 |
| Units issued new certificates of occupancy | 0 | 170 | 483 | 236 | 550 | 423 |
| Indicator | 2000 | 2006 | 2010 | 2019 | 2021 | 2022 |
|---|---|---|---|---|---|---|
| Commute | ||||||
| Car-free commute (% of commuters) | 70.4% | 72.6% | 80.1% | 82.4% | 71.7% | |
| Mean travel time to work (minutes) | 41.9 | 39.4 | 43.1 | 48.2 | 46.1 | |
| Crime and Incarceration | ||||||
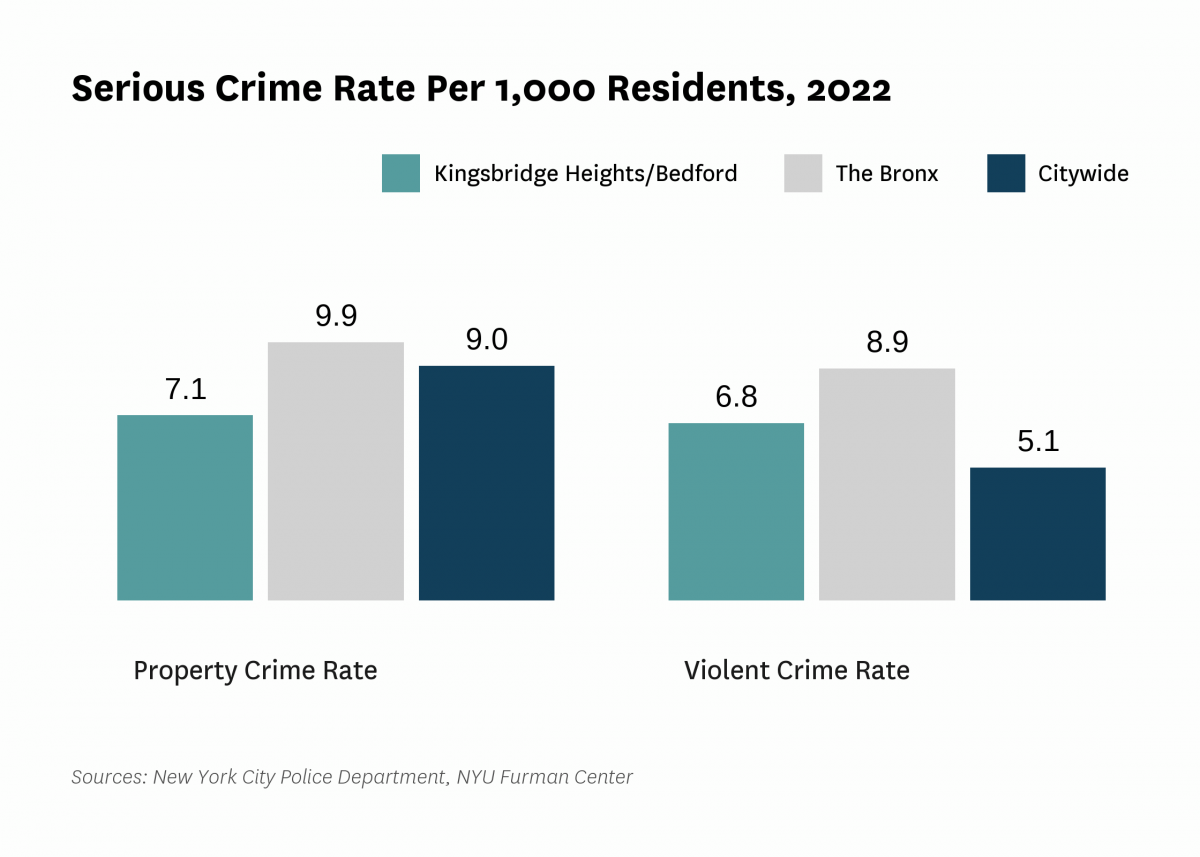
| Serious crime rate (per 1,000 residents) | 15.7 | 15.0 | 13.1 | 14.0 | 13.9 | |
| Serious crime rate, property (per 1,000 residents) | 9.0 | 8.1 | 6.6 | 7.7 | 7.1 | |
| Serious crime rate, violent (per 1,000 residents) | 6.8 | 6.9 | 6.5 | 6.3 | 6.8 | |
| Schools | ||||||
| Students performing at grade level in English language arts, 4th grade | 37.5% | 24.6% | ||||
| Students performing at grade level in math, 4th grade | 35.1% | 20.5% | ||||
| Indicator | 2000 | 2006 | 2010 | 2019 | 2021 | 2022 |
|---|---|---|---|---|---|---|
| Median Rent | ||||||
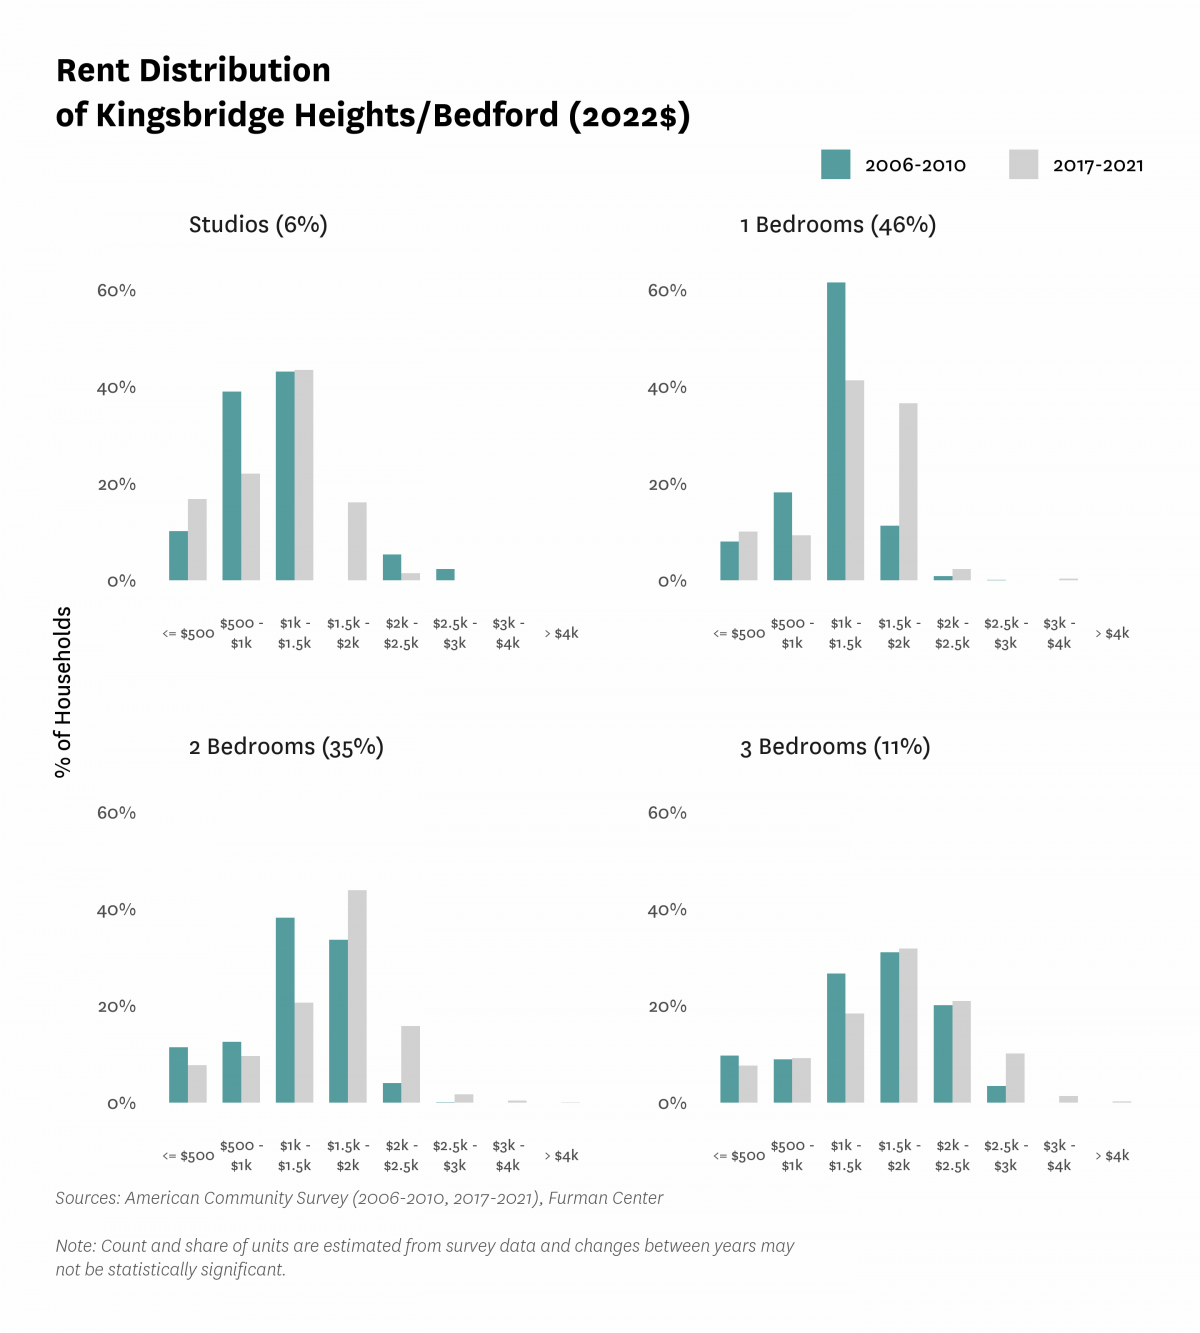
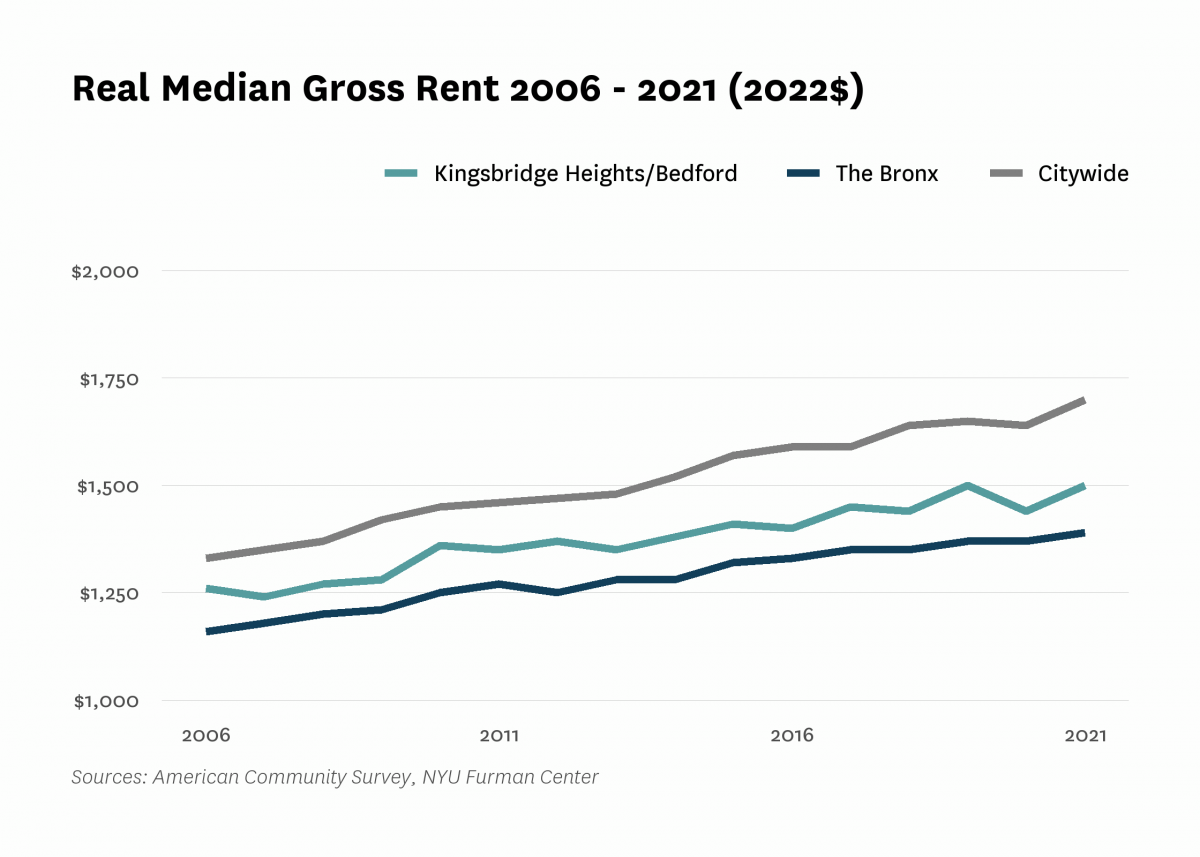
| Median rent, 2- and 3-bedrooms (2022$) | $1,430 | $1,570 | $1,710 | |||
| Median rent, all (2022$) | $1,160 | $1,260 | $1,360 | $1,500 | $1,500 | |
| Median rent, recent movers (2022$) | $1,300 | $1,540 | $1,570 | |||
| Median rent, studios and 1-bedrooms (2022$) | $1,170 | $1,290 | $1,390 | |||
| Change in collected rent (2019-2020) | 5.0% | |||||
| Affordability | ||||||
| Rental units affordable at 30% AMI (% of recently available units) | 8.8% | 11.2% | 13.9% | |||
| Rental units affordable at 80% AMI (% of recently available units) | 88.5% | 91.9% | 92.3% | |||
| Rental units affordable at 120% AMI (% of recently available units) | 99.1% | 100.0% | 100.0% | |||
| Rent Burden | ||||||
| Moderately rent-burdened households | 21.1% | 23.1% | 30.0% | 18.5% | ||
| Moderately rent-burdened households, low income | 28.9% | 32.9% | 29.7% | |||
| Moderately rent-burdened households, moderate income | 3.7% | 1.6% | 1.8% | |||
| Severely rent-burdened households | 30.8% | 38.5% | 36.3% | 36.8% | ||
| Severely rent-burdened households, low income | 48.7% | 43.0% | 47.0% | |||
| Severely rent-burdened households, moderate income | 0.2% | 0.0% | 0.0% | |||
| Rental Subsidy | ||||||
| Housing choice vouchers (% of occupied, privately owned rental units) | 19.9% | 14.1% | ||||
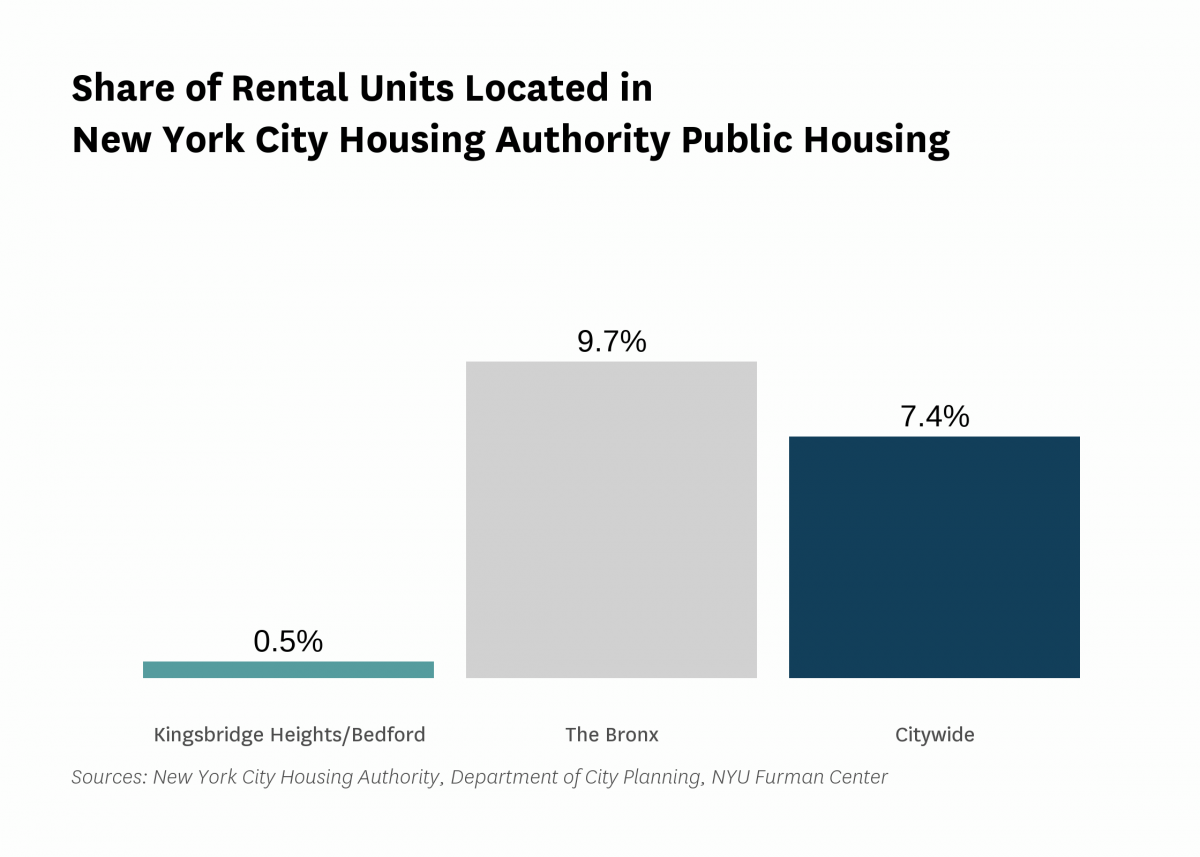
| Public housing (% of rental units) | 0.5% | |||||
Data Notes: See CoreData User Guide for more information about indicator definitions and methods.
Indicators: The rental vacancy rate, severe crowding rate, and the severely rent-burdened households indicators use five-year American Community Survey (ACS) estimates. Data under the 2010 heading comes from the 2006 – 2010 ACS, data under the 2019 heading comes from the 2015 – 2019 ACS and data under the 2021 heading comes from 2017 – 2021 ACS .
All content © 2005 – 2024 Furman Center for Real Estate and Urban Policy | Top of page | Contact Us