| Indicator | 2000 | 2006 | 2010 | 2019 | 2021 | 2022 |
|---|---|---|---|---|---|---|
| Population | ||||||
| Born in New York State | 48.7% | 50.2% | 45.6% | 42.8% | ||
| Disabled population | 6.9% | 6.0% | 8.0% | |||
| Foreign-born population | 16.9% | 18.0% | 19.6% | 19.6% | 20.7% | |
| Population | 115,106 | 111,796 | 125,468 | 133,346 | 147,130 | |
| Population aged 65+ | 9.8% | 10.0% | 9.2% | 11.8% | 12.5% | |
| Households | ||||||
| Households with children under 18 years old | 24.7% | 22.8% | 23.3% | 22.7% | 17.8% | |
| Single-person households | 42.6% | 37.6% | 34.9% | 39.2% | ||
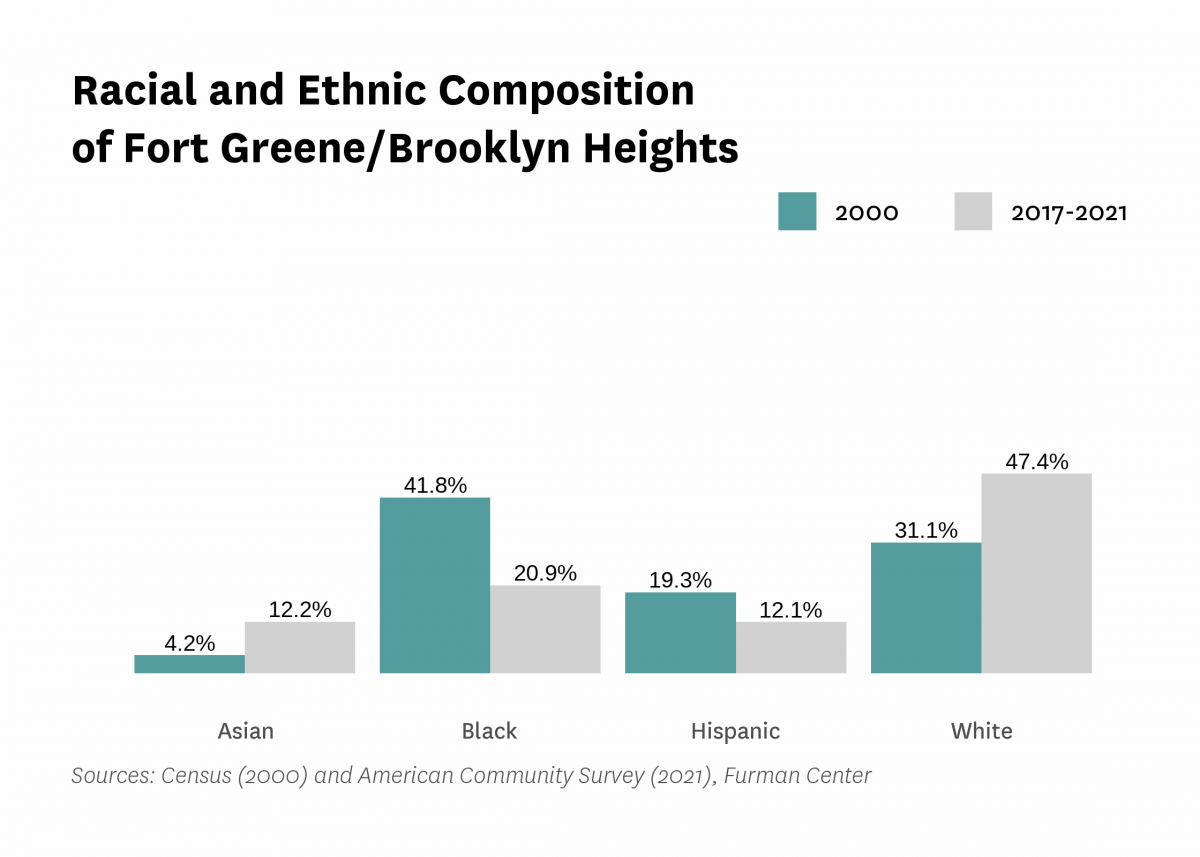
| Race and Ethnicity | ||||||
| Percent Asian | 4.2% | 7.1% | 6.6% | 11.3% | 12.2% | |
| Percent Black | 41.8% | 28.5% | 30.0% | 20.3% | 20.9% | |
| Percent Hispanic | 19.3% | 21.4% | 16.7% | 12.3% | 12.1% | |
| Percent white | 31.1% | 39.4% | 42.7% | 52.1% | 47.4% | |
| Racial diversity index | 0.69 | 0.71 | 0.70 | 0.66 | 0.70 | |
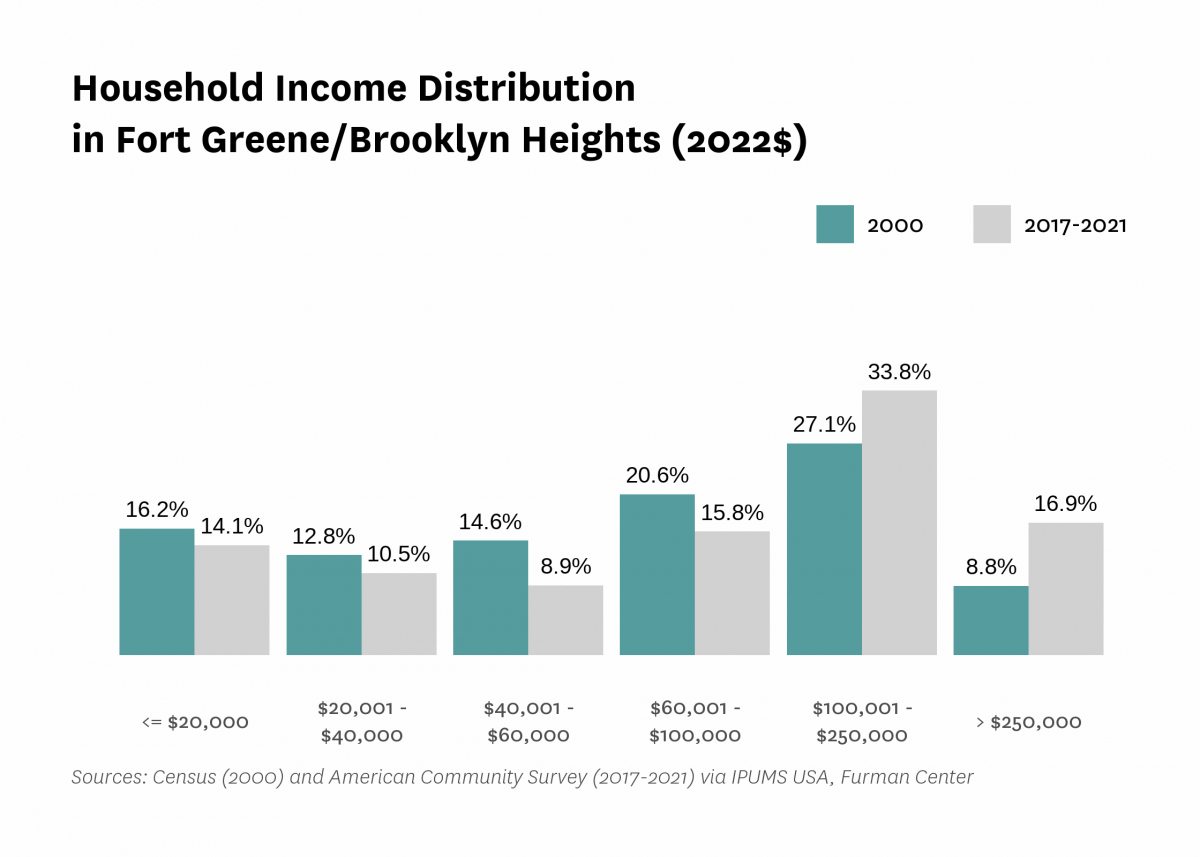
| Income and Poverty | ||||||
| Income diversity ratio | 5.4 | 7.3 | 7.2 | 6.0 | ||
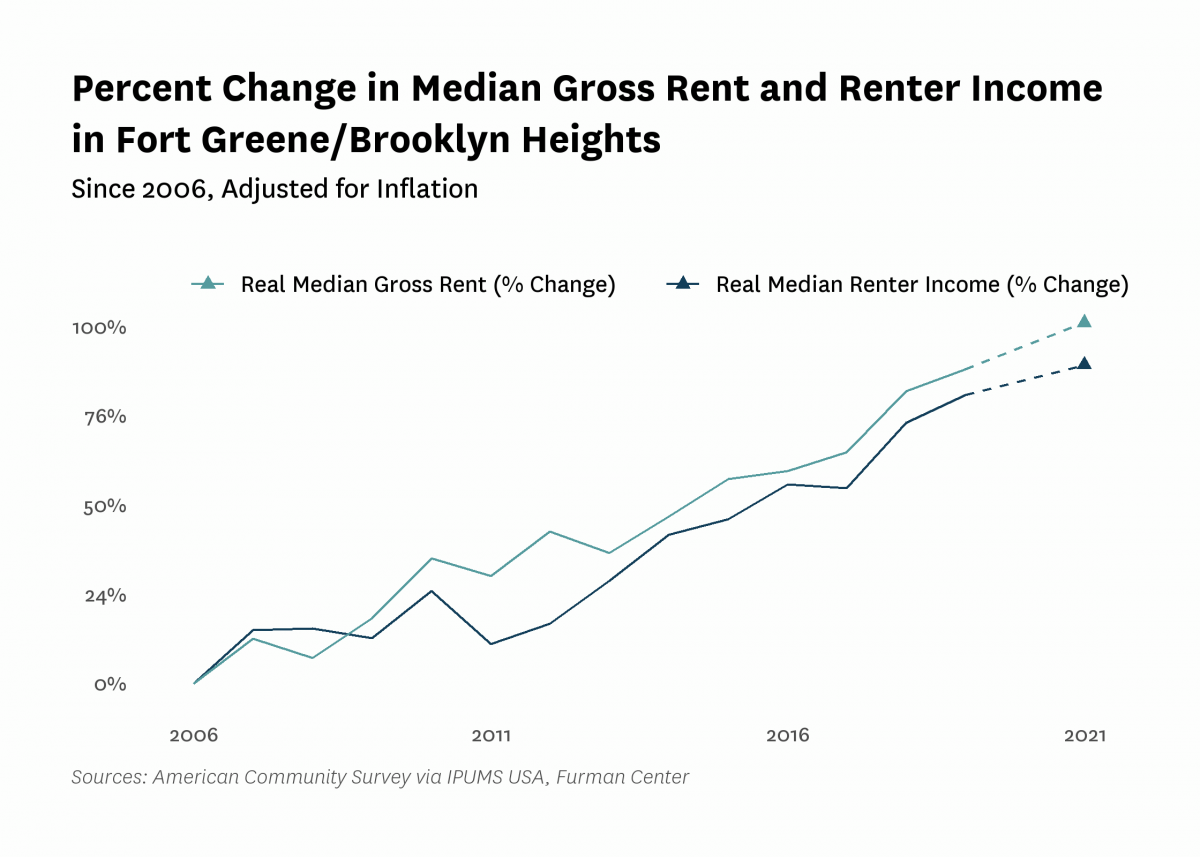
| Median household income (2022$) | $72,020 | $77,220 | $92,440 | $124,370 | $127,910 | |
| Median household income, homeowners (2022$) | $119,930 | $151,360 | $162,190 | $163,190 | ||
| Median household income, renters (2022$) | $57,690 | $72,640 | $104,340 | $109,230 | ||
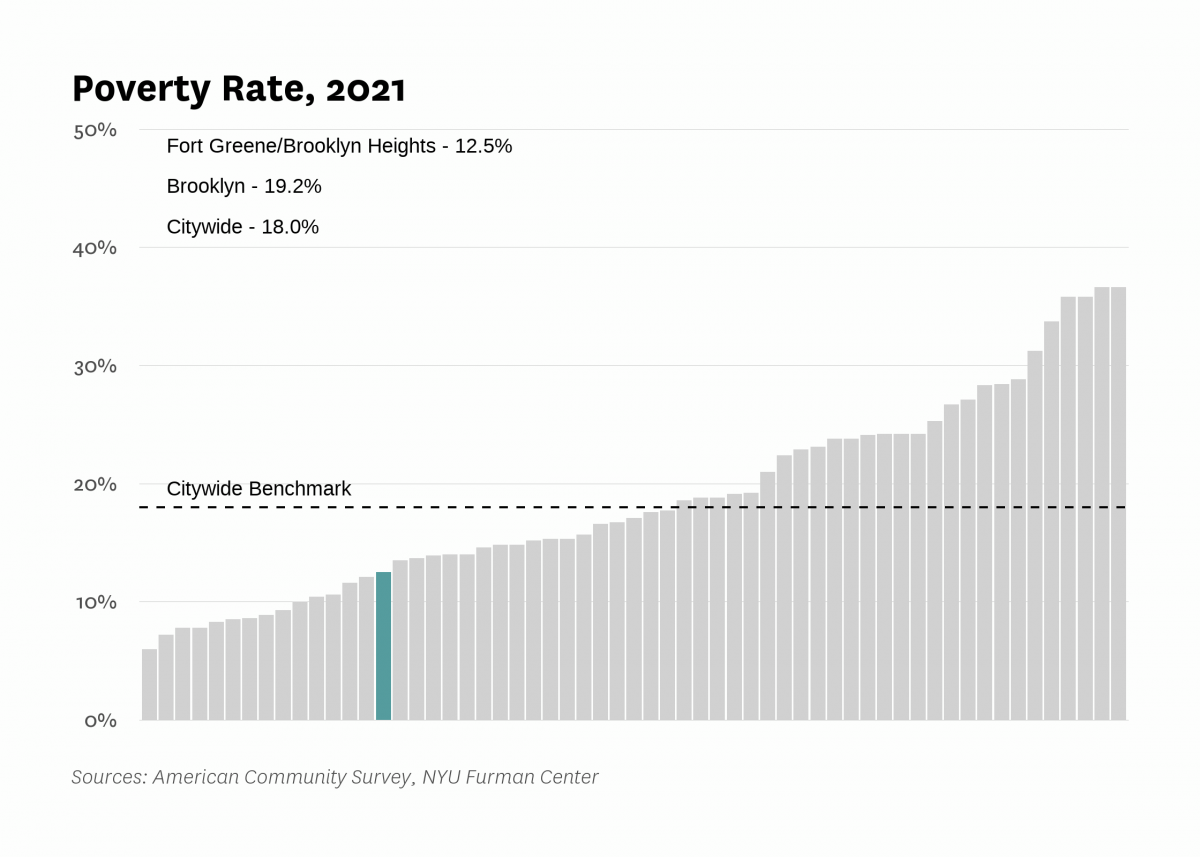
| Poverty rate | 24.5% | 20.4% | 18.1% | 13.8% | 12.5% | |
| Poverty rate, population aged 65+ | 15.4% | 16.5% | 28.8% | 14.6% | ||
| Poverty rate, population under 18 years old | 26.2% | 22.8% | 15.6% | 15.1% | ||
| Labor Market | ||||||
| Labor force participation rate | 65.1% | 69.9% | 73.5% | 74.5% | ||
| Population aged 25+ without a high school diploma | 13.4% | 12.7% | 9.3% | 6.9% | ||
| Unemployment rate | 10.65% | 6.79% | 10.38% | 6.31% | 8.59% | |
| Indicator | 2000 | 2006 | 2010 | 2019 | 2021 | 2022 |
|---|---|---|---|---|---|---|
| Housing Stock | ||||||
| Homeownership rate | 26.3% | 37.8% | 31.1% | 29.1% | 30.8% | |
| Housing units | 55,999 | 60,967 | 69,023 | 76,605 | ||
| Rental vacancy rate | 4.8% | 3.4% | 3.9% | |||
| Serious housing code violations (per 1,000 privately owned rental units) | 24.8 | 10.6 | 24.8 | 28.1 | 30.7 | |
| Severe crowding rate (% of renter households) | 2.7% | 3.8% | 4.0% | |||
| Total housing code violations (per 1,000 privately owned rental units) | 138.0 | 49.0 | 101.7 | 169.0 | 152.5 | |
| Finance - Distress | ||||||
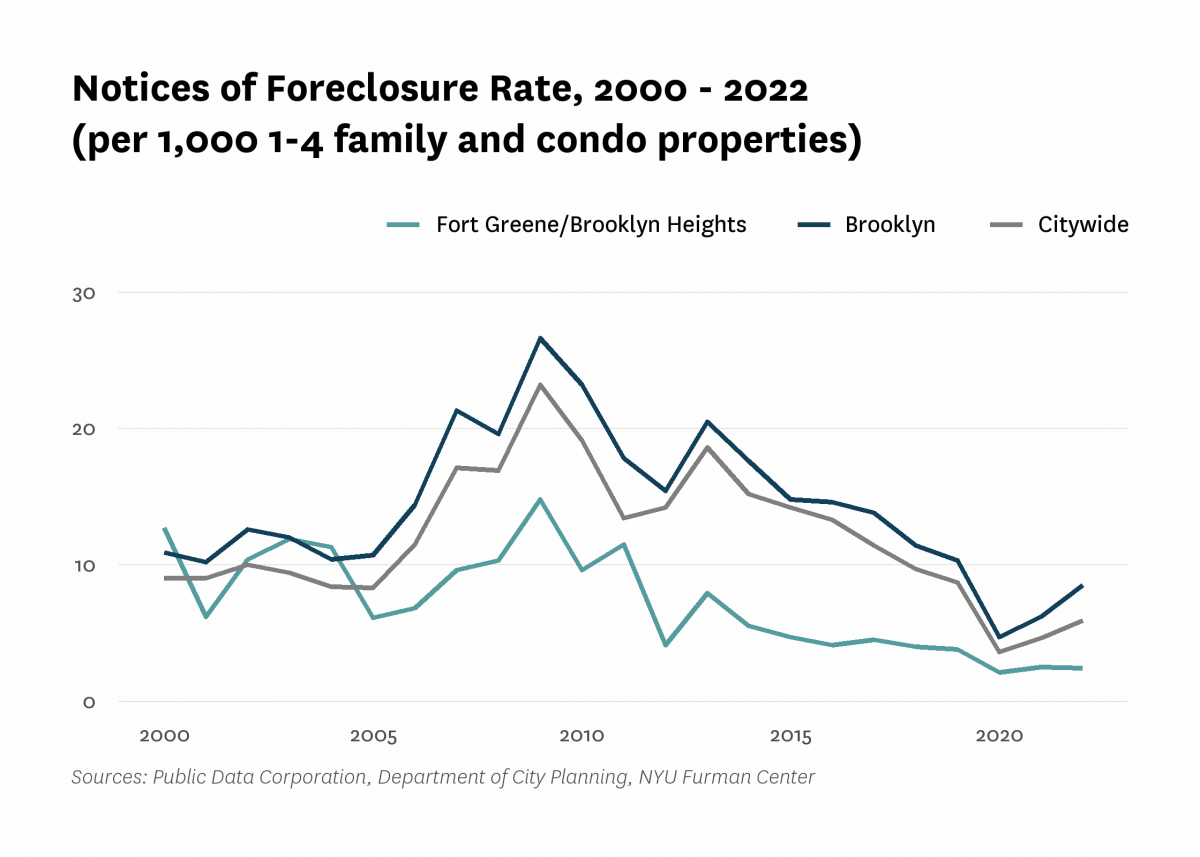
| Notices of foreclosure rate (per 1,000 1-4 family and condo properties) | 12.7 | 6.8 | 9.6 | 3.8 | 2.5 | 2.4 |
| Notices of foreclosure, all residential properties | 84 | 59 | 105 | 55 | 34 | 45 |
| Notices of foreclosure, initial, 1-4 family and condo properties | 46 | 35 | 60 | 19 | 12 | 11 |
| Notices of foreclosure, repeat, 1-4 family and condo properties | 13 | 11 | 29 | 24 | 18 | 20 |
| Pre-foreclosure notice rate (per 1,000 1-4 family and condo properties) | 21.0 | 10.1 | 18.3 | |||
| Pre-foreclosure notices, 1-4 family and condo properties | 239 | 132 | 238 | |||
| Properties entering REO, 1-4 family | 3 | 1 | 2 | |||
| Finance - Lending | ||||||
| FHA/VA-backed home purchase loans (% of home purchase loans) | 0.0% | 11.3% | 0.1% | 0.1% | ||
| Higher-cost home purchase loans (% of home purchase loans) | 6.7% | 0.7% | 0.9% | 0.4% | ||
| Higher-cost refinance loans (% of refinance loans) | 21.9% | 0.8% | 1.1% | 0.3% | ||
| Home purchase loan rate (per 1,000 properties) | 48.4 | 44.1 | 26.2 | 60.1 | ||
| Home purchase loans in LMI tracts (% of home purchase loans) | 19.1% | 3.7% | 6.0% | 7.6% | ||
| Home purchase loans to LMI borrowers (% of home purchase loans) | 3.0% | 34.2% | 2.0% | 1.9% | ||
| Refinance loan rate (per 1,000 properties) | 30.6 | 29.4 | 21.7 | 50.2 | ||
| Sales - Volume | ||||||
| Sales volume, 1 family building | 20 | 21 | 22 | 13 | 18 | 35 |
| Sales volume, 2-4 family building | 172 | 135 | 63 | 55 | 86 | 114 |
| Sales volume, 5+ family building | 27 | 62 | 31 | 31 | 33 | 42 |
| Sales volume, condominium | 42 | 351 | 641 | 332 | 726 | 826 |
| Sales volume, all property types | 261 | 569 | 757 | 431 | 863 | 1,017 |
| Sales - Median Prices | ||||||
| Median sales price per unit, 1 family building (2022$) | $1,002,650 | $3,069,090 | $2,874,610 | $3,679,360 | $3,262,120 | $4,750,000 |
| Median sales price per unit, 2-4 family building (2022$) | $290,060 | $783,430 | $555,820 | $1,152,120 | $1,189,230 | $1,187,500 |
| Median sales price per unit, 5+ family building (2022$) | $106,210 | $202,980 | $156,350 | $443,060 | $515,780 | $520,270 |
| Median sales price per unit, condominium (2022$) | $373,870 | $1,012,910 | $786,670 | $1,393,700 | $1,266,330 | $1,480,000 |
| Sales - Housing Price Index | ||||||
| Index of housing price appreciation, 1 family building | 100.0 | 191.8 | 218.7 | 315.5 | 493.3 | 369.7 |
| Index of housing price appreciation, 2-4 family building | 100.0 | 279.2 | 237.8 | 576.0 | 569.7 | 585.0 |
| Index of housing price appreciation, 5+ family building | 100.0 | 238.7 | 231.4 | 625.5 | 529.6 | 610.2 |
| Index of housing price appreciation, condominium | 100.0 | 258.0 | 243.0 | 429.0 | 437.5 | 454.8 |
| Index of housing price appreciation, all property types | 100.0 | 263.3 | 249.9 | 459.0 | 462.0 | 485.0 |
| Subsidized Housing | ||||||
| Total number of subsidized properties (properties) | 179 | |||||
| HUD Financing or Insurance (properties) | 6 | |||||
| HUD Financing or Insurance (units) | 662 | |||||
| HUD Project-based Rental Assistance Program (properties) | 9 | |||||
| HUD Project-based Rental Assistance Program (units) | 557 | |||||
| Low Income Housing Tax Credit (properties) | 31 | |||||
| Low Income Housing Tax Credit (units) | 4,836 | |||||
| Public Housing (properties) | 8 | |||||
| Public Housing (units) | 3,882 | |||||
| Mitchell-Lama (properties) | 8 | |||||
| Mitchell-Lama (units) | 2,157 | |||||
| 421-a Tax Exemption (properties) | 149 | |||||
| 421-a Tax Exemption (units) | 14,568 | |||||
| 420-c Tax Exemption (properties) | 25 | |||||
| 420-c Tax Exemption (units) | 1,459 | |||||
| NYC Housing Production Programs and Zoning Incentives or Requirements (properties) | 79 | |||||
| Eligible to expire from housing programs between 2023 and 2028 (properties) | 3 | |||||
| Eligible to expire from housing programs between 2023 and 2028 (units) | 68 | |||||
| Eligible to expire from housing programs between 2029 and 2038 (properties) | 9 | |||||
| Eligible to expire from housing programs between 2029 and 2038 (units) | 1,815 | |||||
| Eligible to expire from housing programs in 2039 and later (properties) | 31 | |||||
| Eligible to expire from housing programs in 2039 and later (units) | 4,508 | |||||
| Indicator | 2000 | 2006 | 2010 | 2019 | 2021 | 2022 |
|---|---|---|---|---|---|---|
| Density | ||||||
| Population density (1,000 persons per square mile) | 35.9 | 40.3 | 42.8 | 47.3 | ||
| Development | ||||||
| Units authorized by new residential building permits | 151 | 0 | 380 | 2,153 | 1,235 | 5,016 |
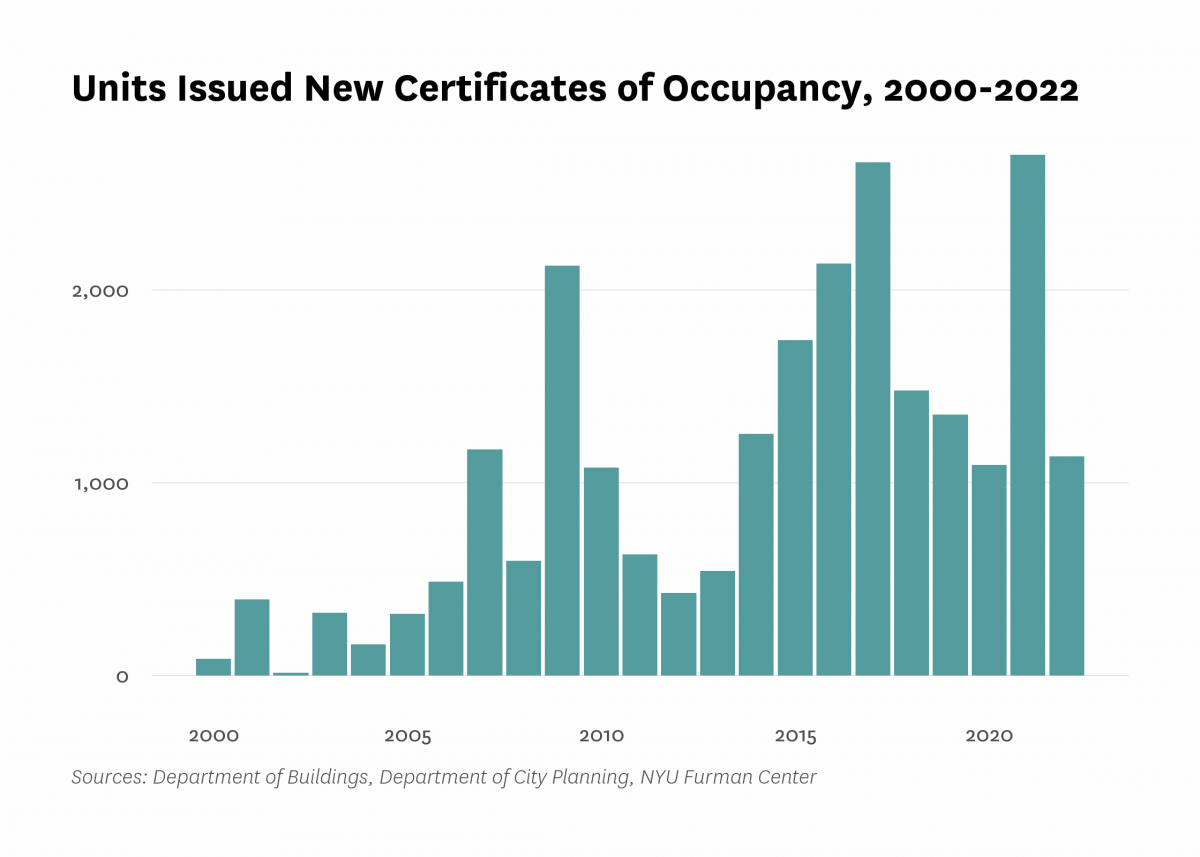
| Units issued new certificates of occupancy | 86 | 488 | 1,079 | 1,353 | 2,700 | 1,137 |
| Indicator | 2000 | 2006 | 2010 | 2019 | 2021 | 2022 |
|---|---|---|---|---|---|---|
| Commute | ||||||
| Car-free commute (% of commuters) | 81.5% | 84.7% | 87.3% | 88.1% | 77.6% | |
| Mean travel time to work (minutes) | 35.7 | 34.3 | 35.2 | 34.8 | 33.5 | |
| Crime and Incarceration | ||||||
| Serious crime rate (per 1,000 residents) | 24.1 | 21.4 | 21.3 | 14.5 | 17.6 | |
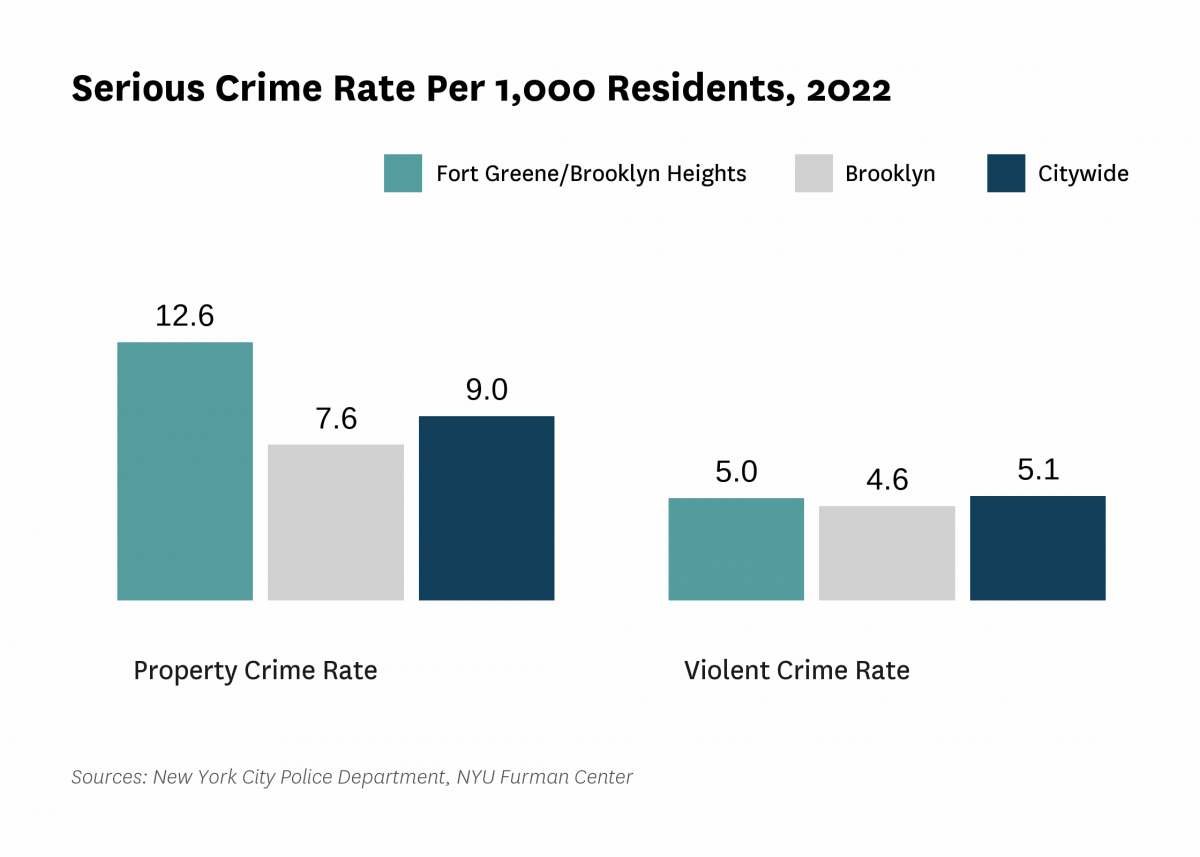
| Serious crime rate, property (per 1,000 residents) | 16.6 | 14.6 | 14.9 | 10.1 | 12.6 | |
| Serious crime rate, violent (per 1,000 residents) | 7.5 | 6.8 | 6.4 | 4.4 | 5.0 | |
| Schools | ||||||
| Students performing at grade level in English language arts, 4th grade | 63.4% | 57.5% | ||||
| Students performing at grade level in math, 4th grade | 56.0% | 54.9% | ||||
| Indicator | 2000 | 2006 | 2010 | 2019 | 2021 | 2022 |
|---|---|---|---|---|---|---|
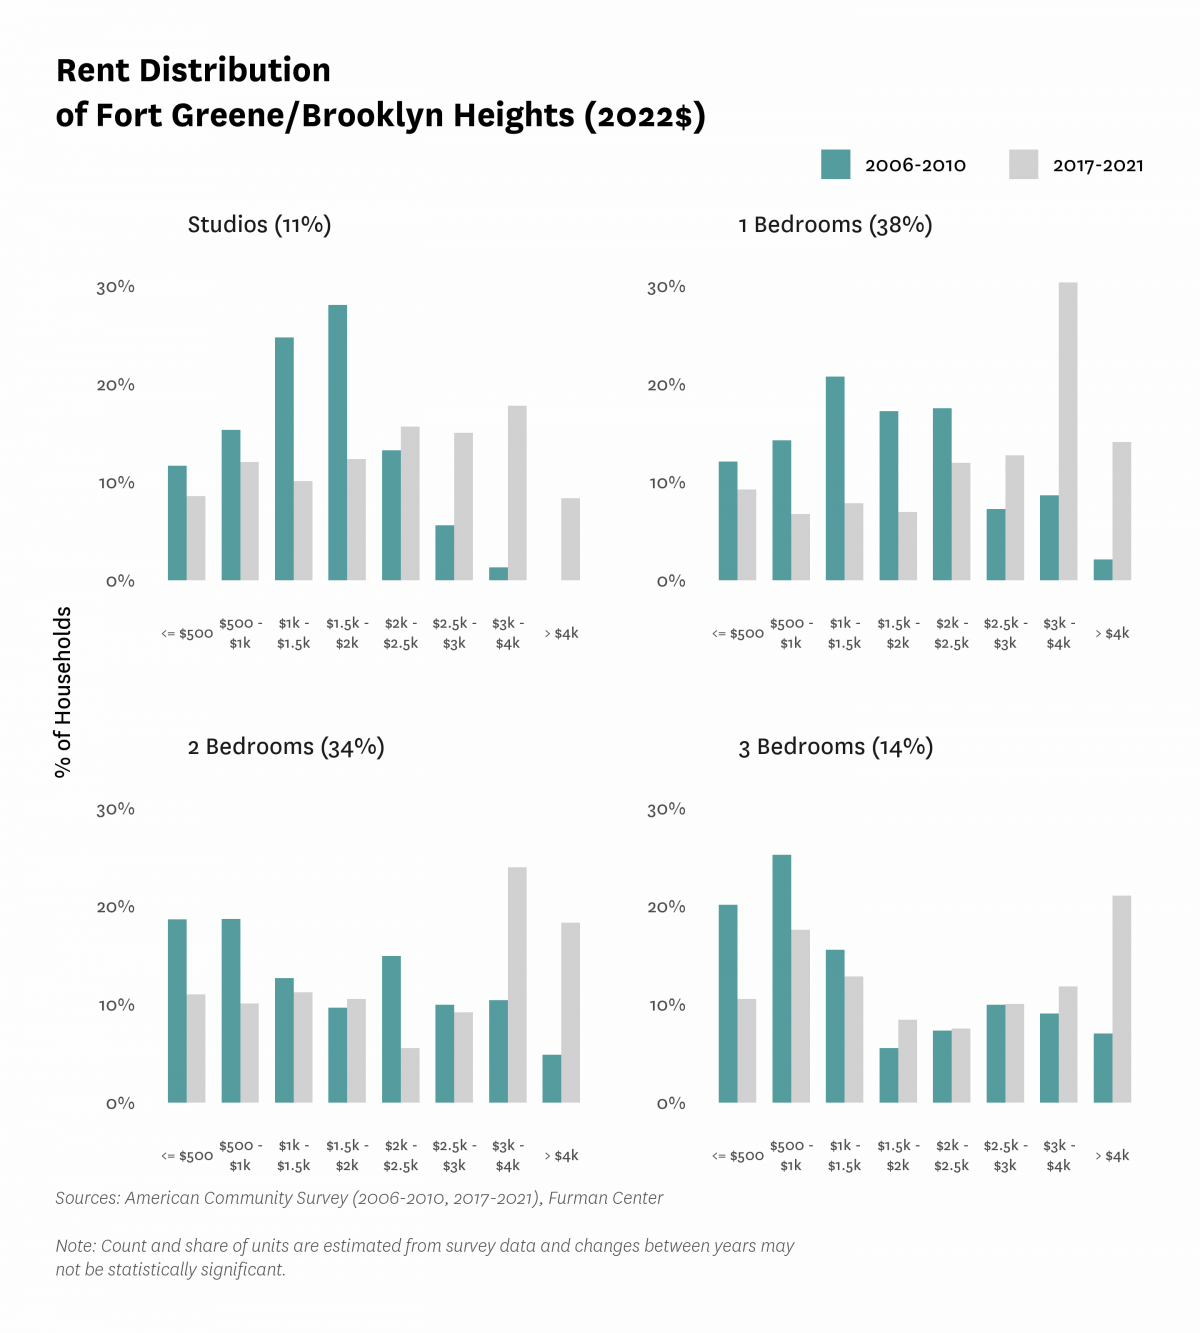
| Median Rent | ||||||
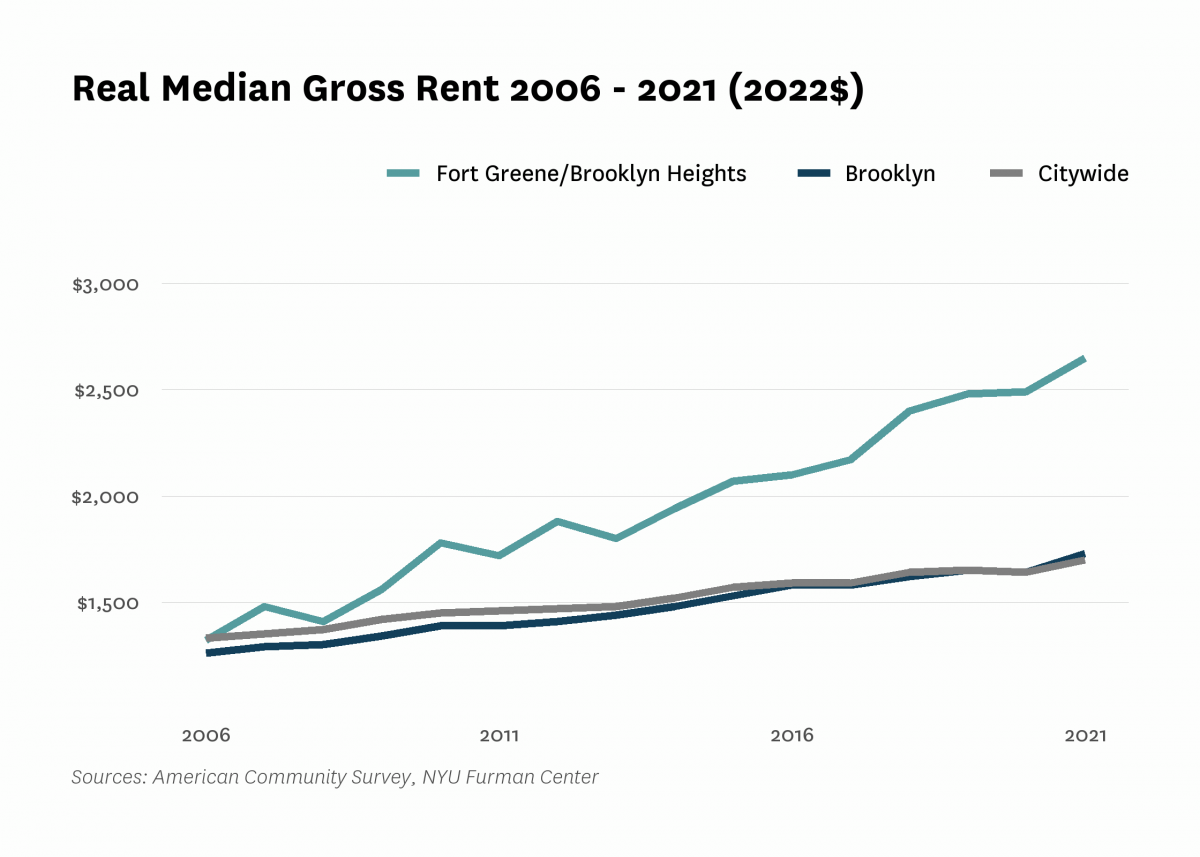
| Median rent, 2- and 3-bedrooms (2022$) | $1,360 | $1,900 | $2,450 | |||
| Median rent, all (2022$) | $1,160 | $1,320 | $1,780 | $2,480 | $2,650 | |
| Median rent, recent movers (2022$) | $2,240 | $3,020 | $3,280 | |||
| Median rent, studios and 1-bedrooms (2022$) | $1,590 | $2,290 | $2,630 | |||
| Change in collected rent (2019-2020) | -0.7% | |||||
| Affordability | ||||||
| Rental units affordable at 30% AMI (% of recently available units) | 8.5% | 6.2% | 3.6% | |||
| Rental units affordable at 80% AMI (% of recently available units) | 26.4% | 18.2% | 13.9% | |||
| Rental units affordable at 120% AMI (% of recently available units) | 64.0% | 46.1% | 47.4% | |||
| Rent Burden | ||||||
| Moderately rent-burdened households | 20.7% | 21.6% | 20.4% | 21.8% | ||
| Moderately rent-burdened households, low income | 25.9% | 27.3% | 26.4% | |||
| Moderately rent-burdened households, moderate income | 25.1% | 43.6% | 46.5% | |||
| Severely rent-burdened households | 18.6% | 20.4% | 19.2% | 19.9% | ||
| Severely rent-burdened households, low income | 40.7% | 40.3% | 44.8% | |||
| Severely rent-burdened households, moderate income | 4.5% | 6.6% | 9.5% | |||
| Rental Subsidy | ||||||
| Housing choice vouchers (% of occupied, privately owned rental units) | 2.1% | 2.2% | ||||
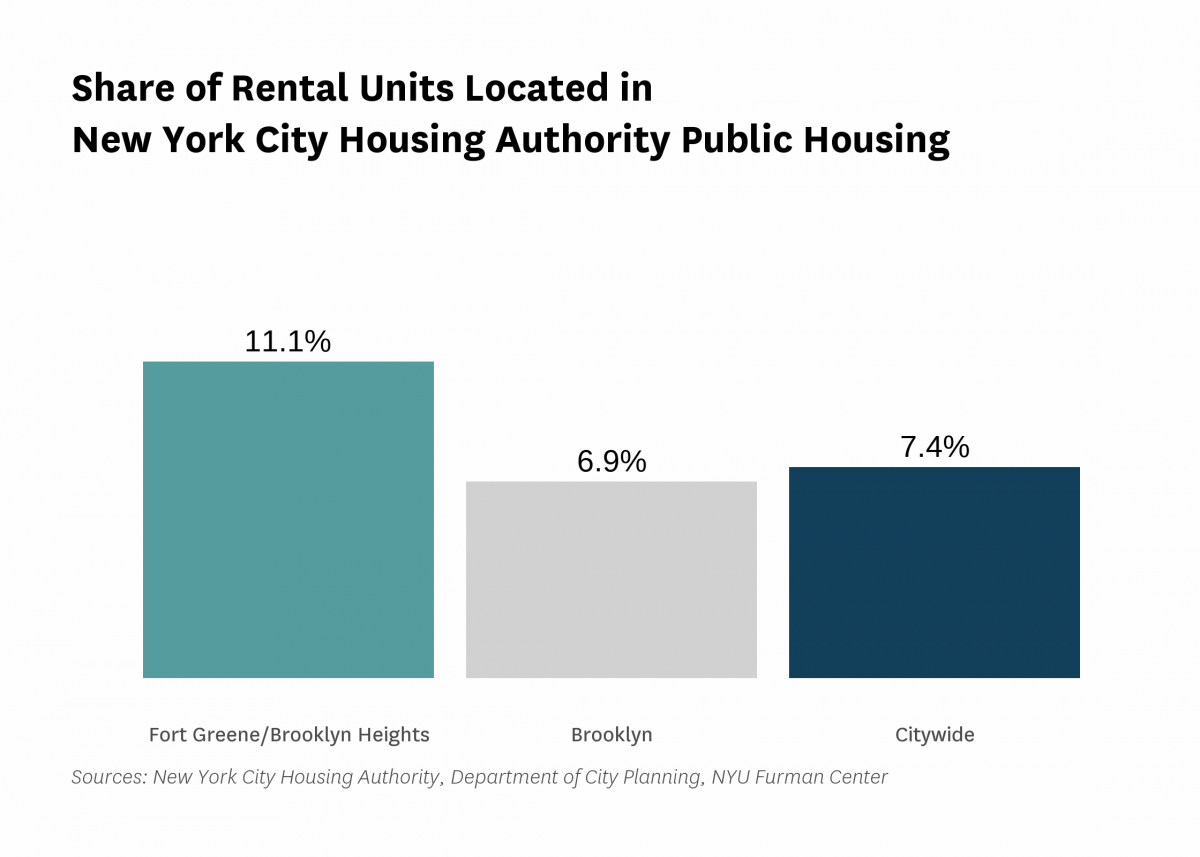
| Public housing (% of rental units) | 11.1% | |||||
Data Notes: See CoreData User Guide for more information about indicator definitions and methods.
Indicators: The rental vacancy rate, severe crowding rate, and the severely rent-burdened households indicators use five-year American Community Survey (ACS) estimates. Data under the 2010 heading comes from the 2006 – 2010 ACS, data under the 2019 heading comes from the 2015 – 2019 ACS and data under the 2021 heading comes from 2017 – 2021 ACS .
All content © 2005 – 2024 Furman Center for Real Estate and Urban Policy | Top of page | Contact Us