| Indicator | 2000 | 2006 | 2010 | 2019 | 2021 | 2022 |
|---|---|---|---|---|---|---|
| Population | ||||||
| Born in New York State | 30.0% | 30.1% | 30.9% | 31.6% | ||
| Disabled population | 5.7% | 5.4% | 4.9% | |||
| Foreign-born population | 66.8% | 66.3% | 63.9% | 65.1% | 63.8% | |
| Population | 142,022 | 138,593 | 136,517 | 156,074 | 137,364 | |
| Population aged 65+ | 8.6% | 9.8% | 11.0% | 12.1% | 15.4% | |
| Households | ||||||
| Households with children under 18 years old | 41.8% | 40.2% | 36.4% | 39.5% | 31.1% | |
| Single-person households | 22.4% | 24.6% | 19.1% | 25.6% | ||
| Race and Ethnicity | ||||||
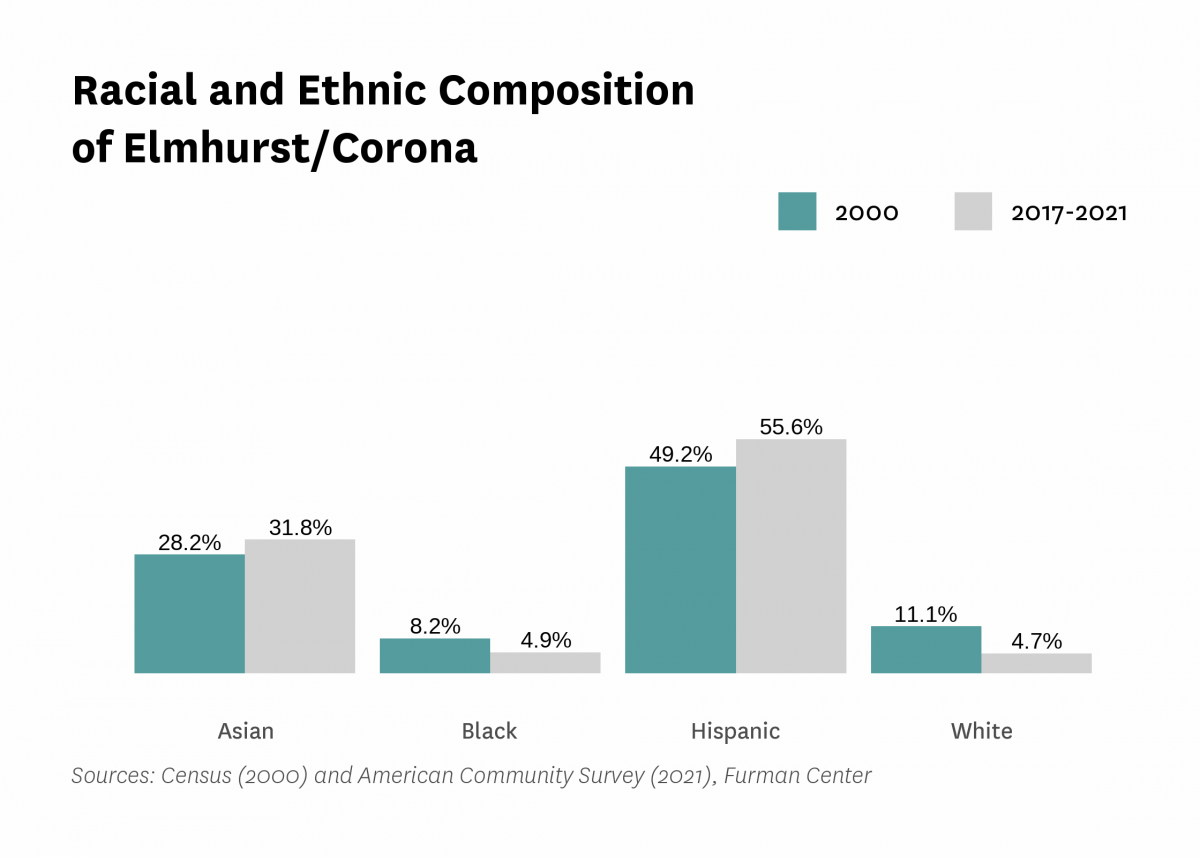
| Percent Asian | 28.2% | 31.7% | 35.3% | 35.3% | 31.8% | |
| Percent Black | 8.2% | 5.8% | 6.5% | 3.7% | 4.9% | |
| Percent Hispanic | 49.2% | 51.8% | 47.5% | 53.5% | 55.6% | |
| Percent white | 11.1% | 9.4% | 8.1% | 5.3% | 4.7% | |
| Racial diversity index | 0.66 | 0.62 | 0.64 | 0.58 | 0.58 | |
| Income and Poverty | ||||||
| Income diversity ratio | 4.4 | 3.8 | 3.6 | 4.6 | ||
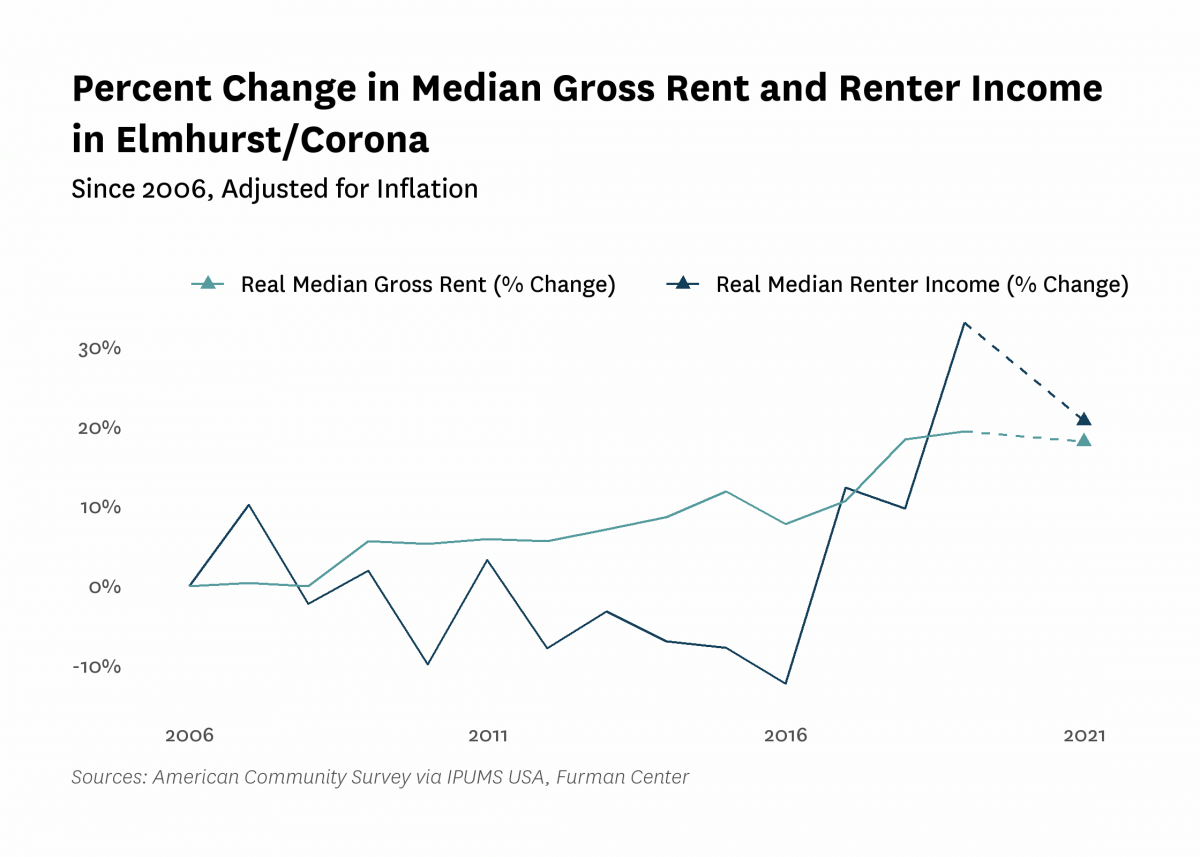
| Median household income (2022$) | $63,080 | $58,210 | $53,160 | $74,860 | $67,330 | |
| Median household income, homeowners (2022$) | $81,810 | $77,570 | $93,800 | $72,820 | ||
| Median household income, renters (2022$) | $52,030 | $46,900 | $69,250 | $62,840 | ||
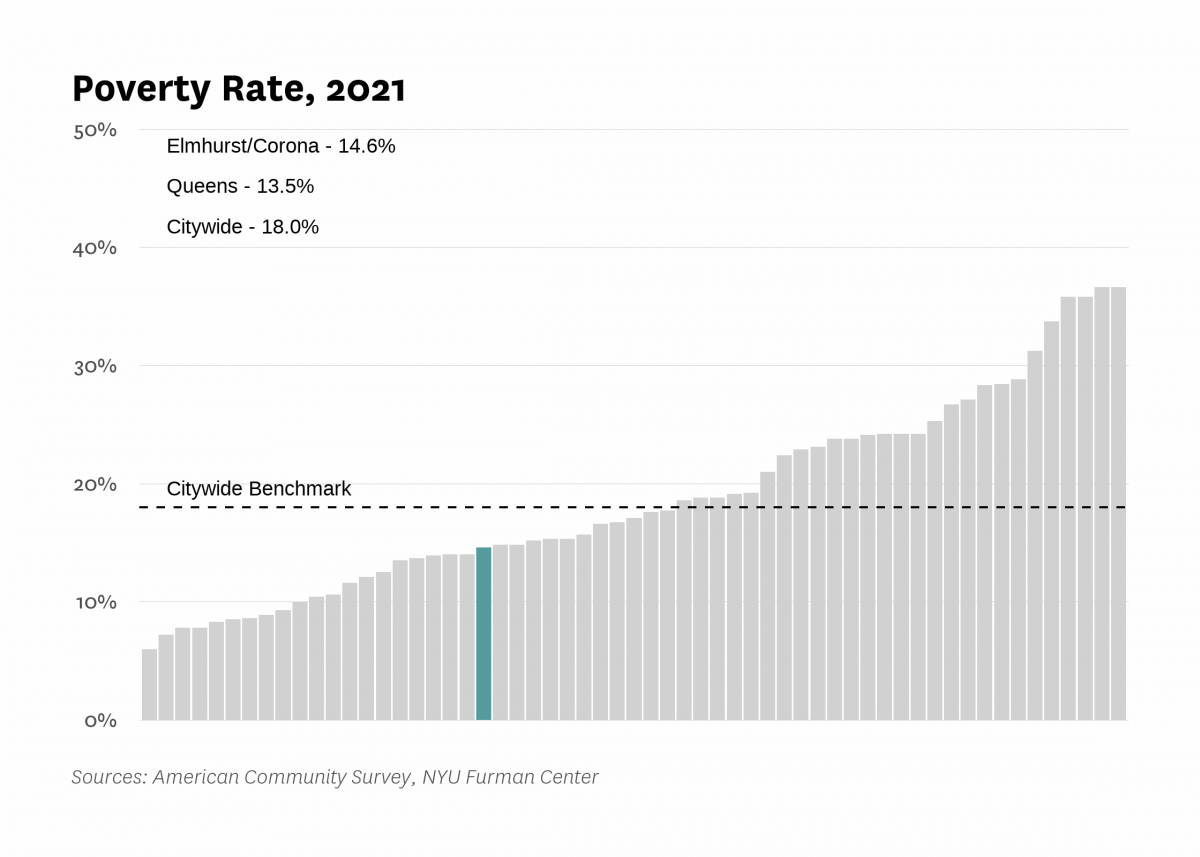
| Poverty rate | 19.2% | 18.8% | 19.2% | 10.2% | 14.6% | |
| Poverty rate, population aged 65+ | 22.7% | 13.4% | 15.2% | 20.7% | ||
| Poverty rate, population under 18 years old | 25.7% | 26.3% | 14.6% | 17.1% | ||
| Labor Market | ||||||
| Labor force participation rate | 64.4% | 64.0% | 69.1% | 62.5% | ||
| Population aged 25+ without a high school diploma | 31.5% | 30.0% | 24.7% | 29.5% | ||
| Unemployment rate | 9.26% | 5.26% | 8.46% | 3.55% | 9.87% | |
| Indicator | 2000 | 2006 | 2010 | 2019 | 2021 | 2022 |
|---|---|---|---|---|---|---|
| Housing Stock | ||||||
| Homeownership rate | 21.8% | 25.9% | 27.6% | 23.6% | 24.8% | |
| Housing units | 48,387 | 47,382 | 48,372 | 48,614 | ||
| Rental vacancy rate | 2.7% | 1.3% | 1.3% | |||
| Serious housing code violations (per 1,000 privately owned rental units) | 19.5 | 19.7 | 36.8 | 46.4 | 56.7 | |
| Severe crowding rate (% of renter households) | 9.8% | 11.3% | 11.3% | |||
| Total housing code violations (per 1,000 privately owned rental units) | 130.4 | 112.2 | 128.1 | 226.8 | 238.5 | |
| Finance - Distress | ||||||
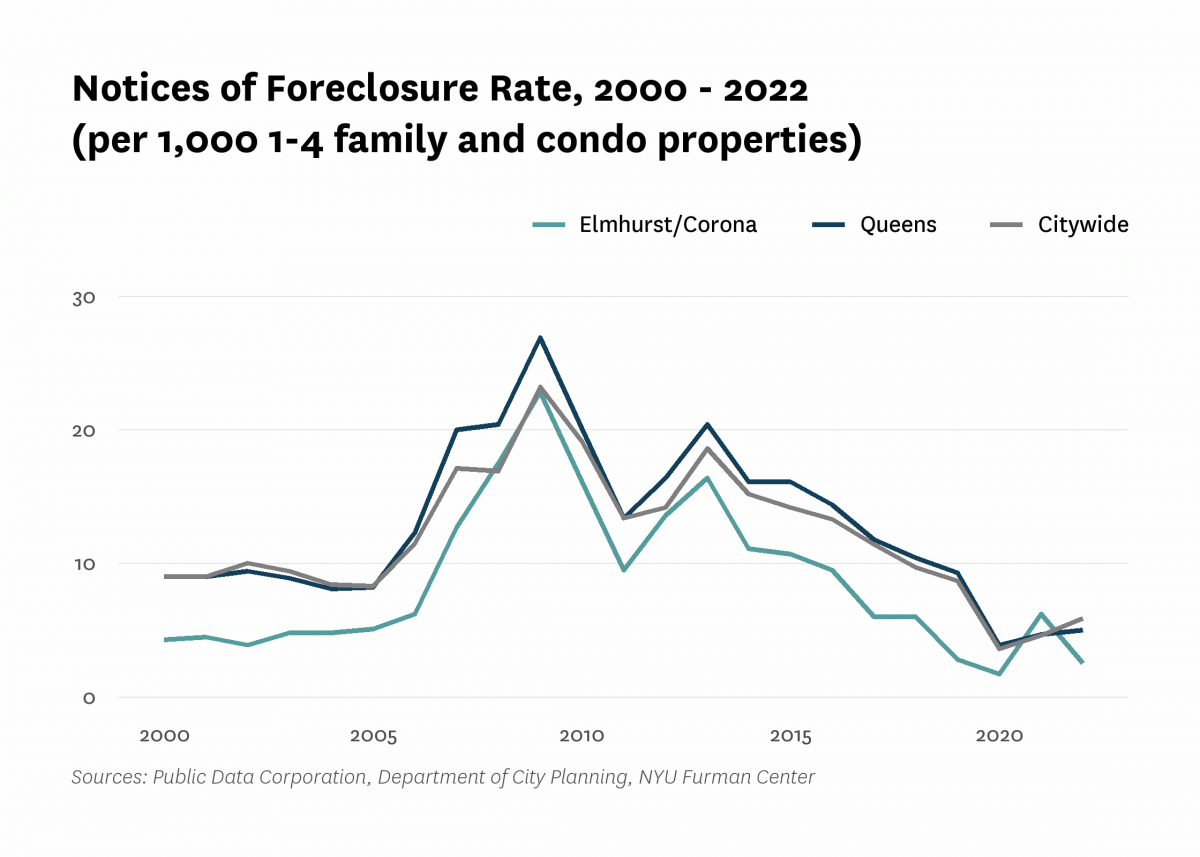
| Notices of foreclosure rate (per 1,000 1-4 family and condo properties) | 4.3 | 6.2 | 16.1 | 2.8 | 6.2 | 2.5 |
| Notices of foreclosure, all residential properties | 48 | 74 | 193 | 35 | 85 | 30 |
| Notices of foreclosure, initial, 1-4 family and condo properties | 33 | 65 | 147 | 13 | 59 | 17 |
| Notices of foreclosure, repeat, 1-4 family and condo properties | 11 | 4 | 37 | 20 | 16 | 13 |
| Pre-foreclosure notice rate (per 1,000 1-4 family and condo properties) | 26.3 | 13.0 | 24.6 | |||
| Pre-foreclosure notices, 1-4 family and condo properties | 311 | 159 | 300 | |||
| Properties entering REO, 1-4 family | 7 | 4 | 9 | |||
| Finance - Lending | ||||||
| FHA/VA-backed home purchase loans (% of home purchase loans) | 0.2% | 9.3% | 0.5% | 2.2% | ||
| Higher-cost home purchase loans (% of home purchase loans) | 22.5% | 1.9% | 2.6% | 7.5% | ||
| Higher-cost refinance loans (% of refinance loans) | 31.3% | 1.5% | 4.5% | 2.7% | ||
| Home purchase loan rate (per 1,000 properties) | 54.8 | 17.7 | 12.4 | 20.3 | ||
| Home purchase loans in LMI tracts (% of home purchase loans) | 69.1% | 27.1% | 74.4% | 74.6% | ||
| Home purchase loans to LMI borrowers (% of home purchase loans) | 9.8% | 63.0% | 13.6% | 26.6% | ||
| Refinance loan rate (per 1,000 properties) | 36.1 | 8.6 | 8.5 | 18.6 | ||
| Sales - Volume | ||||||
| Sales volume, 1 family building | 114 | 136 | 41 | 39 | 35 | 41 |
| Sales volume, 2-4 family building | 393 | 449 | 164 | 142 | 111 | 177 |
| Sales volume, 5+ family building | 30 | 40 | 12 | 14 | 15 | 16 |
| Sales volume, condominium | 59 | 146 | 117 | 70 | 59 | 133 |
| Sales volume, all property types | 596 | 771 | 334 | 265 | 220 | 367 |
| Sales - Median Prices | ||||||
| Median sales price per unit, 1 family building (2022$) | $399,360 | $784,140 | $676,000 | $914,270 | $901,870 | $870,000 |
| Median sales price per unit, 2-4 family building (2022$) | $216,670 | $428,600 | $336,390 | $485,010 | $495,150 | $493,330 |
| Median sales price per unit, 5+ family building (2022$) | $127,010 | $197,850 | $178,760 | $257,930 | $227,360 | $190,830 |
| Median sales price per unit, condominium (2022$) | $220,450 | $382,930 | $374,070 | $534,390 | $503,990 | $580,620 |
| Sales - Housing Price Index | ||||||
| Index of housing price appreciation, 1 family building | 100.0 | 234.2 | 189.6 | 329.0 | 396.7 | 421.2 |
| Index of housing price appreciation, 2-4 family building | 100.0 | 238.6 | 180.0 | 330.3 | 372.1 | 343.4 |
| Index of housing price appreciation, 5+ family building | 100.0 | 198.0 | 187.6 | 186.8 | 305.6 | 294.6 |
| Index of housing price appreciation, condominium | 100.0 | 259.4 | 241.7 | 423.9 | 433.4 | 439.1 |
| Index of housing price appreciation, all property types | 100.0 | 236.2 | 189.7 | 332.9 | 366.2 | 357.8 |
| Subsidized Housing | ||||||
| Total number of subsidized properties (properties) | 20 | |||||
| HUD Financing or Insurance (properties) | 2 | |||||
| HUD Financing or Insurance (units) | 151 | |||||
| HUD Project-based Rental Assistance Program (properties) | 5 | |||||
| HUD Project-based Rental Assistance Program (units) | 513 | |||||
| Low Income Housing Tax Credit (properties) | 1 | |||||
| Low Income Housing Tax Credit (units) | 68 | |||||
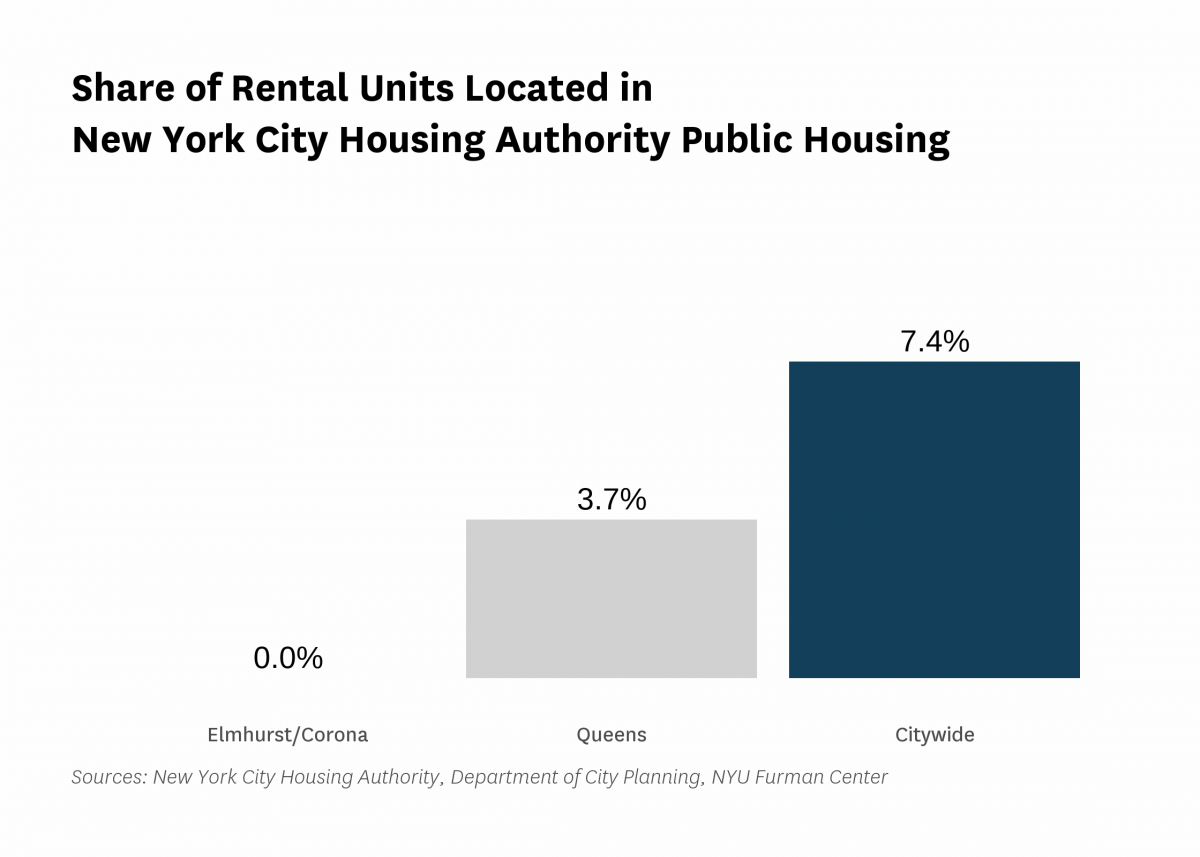
| Public Housing (properties) | 0 | |||||
| Public Housing (units) | 0 | |||||
| Mitchell-Lama (properties) | 0 | |||||
| Mitchell-Lama (units) | 0 | |||||
| 421-a Tax Exemption (properties) | 169 | |||||
| 421-a Tax Exemption (units) | 2,616 | |||||
| 420-c Tax Exemption (properties) | 1 | |||||
| 420-c Tax Exemption (units) | 68 | |||||
| NYC Housing Production Programs and Zoning Incentives or Requirements (properties) | 11 | |||||
| Eligible to expire from housing programs between 2023 and 2028 (properties) | 1 | |||||
| Eligible to expire from housing programs between 2023 and 2028 (units) | 6 | |||||
| Eligible to expire from housing programs between 2029 and 2038 (properties) | 0 | |||||
| Eligible to expire from housing programs between 2029 and 2038 (units) | 0 | |||||
| Eligible to expire from housing programs in 2039 and later (properties) | 6 | |||||
| Eligible to expire from housing programs in 2039 and later (units) | 575 | |||||
| Indicator | 2000 | 2006 | 2010 | 2019 | 2021 | 2022 |
|---|---|---|---|---|---|---|
| Density | ||||||
| Population density (1,000 persons per square mile) | 38.4 | 37.8 | 43.3 | 38.1 | ||
| Development | ||||||
| Units authorized by new residential building permits | 210 | 0 | 231 | 171 | 40 | 157 |
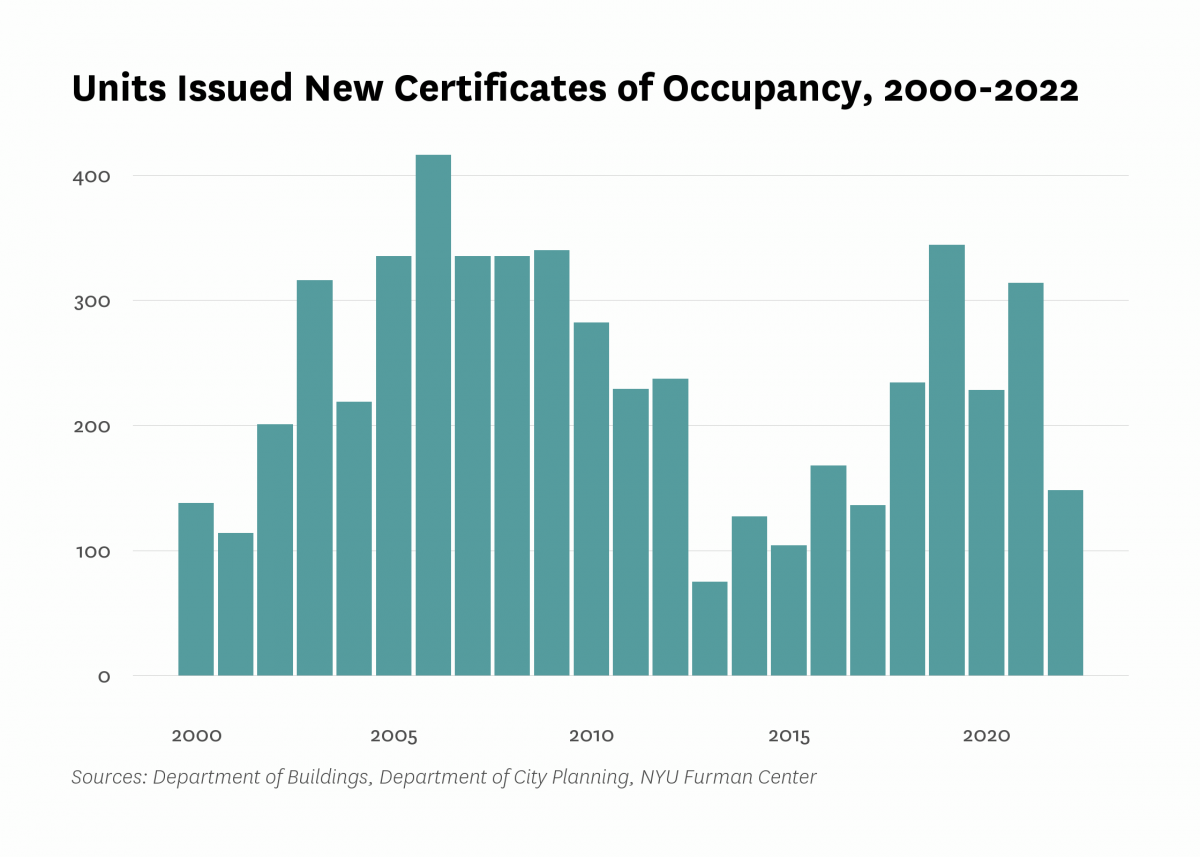
| Units issued new certificates of occupancy | 138 | 416 | 282 | 344 | 314 | 148 |
| Indicator | 2000 | 2006 | 2010 | 2019 | 2021 | 2022 |
|---|---|---|---|---|---|---|
| Commute | ||||||
| Car-free commute (% of commuters) | 70.7% | 75.4% | 74.7% | 79.9% | 78.7% | |
| Mean travel time to work (minutes) | 41.7 | 43.3 | 42.0 | 44.1 | 39.8 | |
| Crime and Incarceration | ||||||
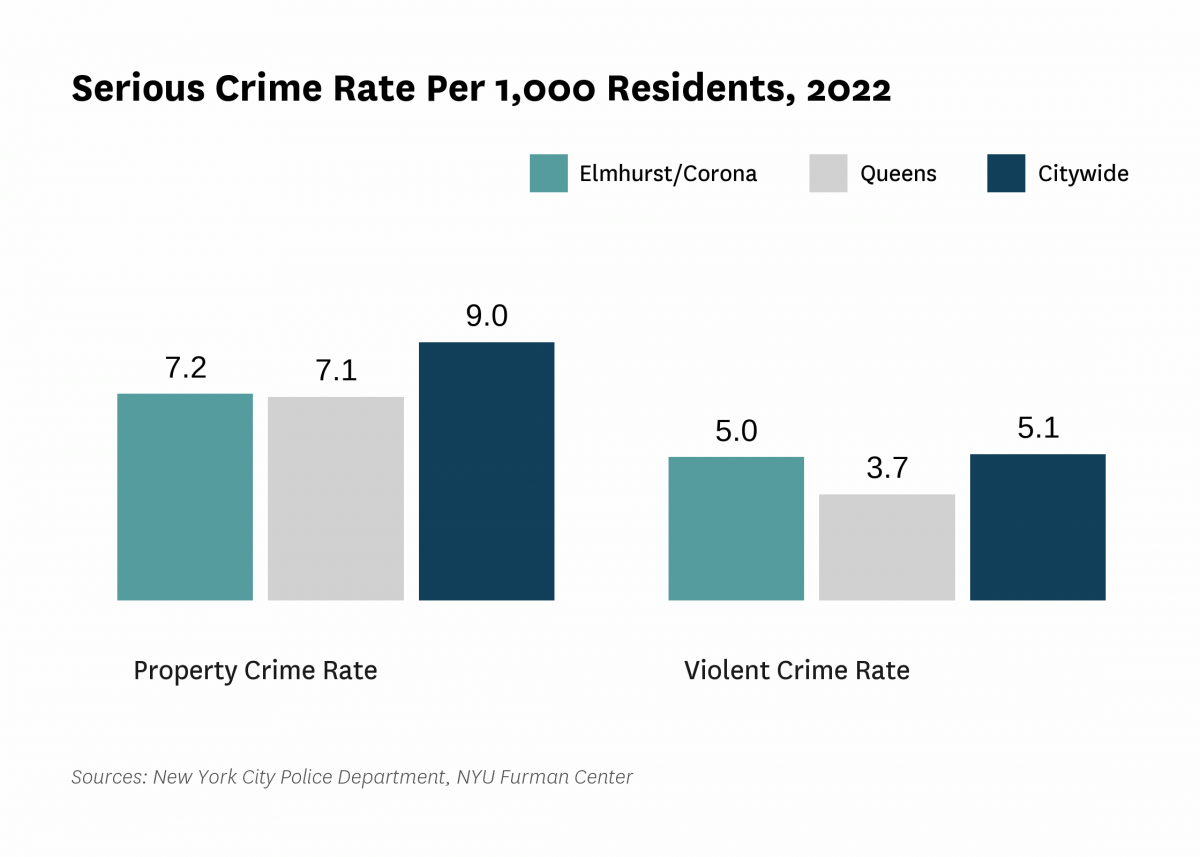
| Serious crime rate (per 1,000 residents) | 11.5 | 9.0 | 7.5 | 11.3 | 12.2 | |
| Serious crime rate, property (per 1,000 residents) | 8.0 | 5.6 | 4.3 | 7.7 | 7.2 | |
| Serious crime rate, violent (per 1,000 residents) | 3.6 | 3.4 | 3.3 | 3.6 | 5.0 | |
| Schools | ||||||
| Students performing at grade level in English language arts, 4th grade | 44.3% | 34.2% | ||||
| Students performing at grade level in math, 4th grade | 46.3% | 30.5% | ||||
| Indicator | 2000 | 2006 | 2010 | 2019 | 2021 | 2022 |
|---|---|---|---|---|---|---|
| Median Rent | ||||||
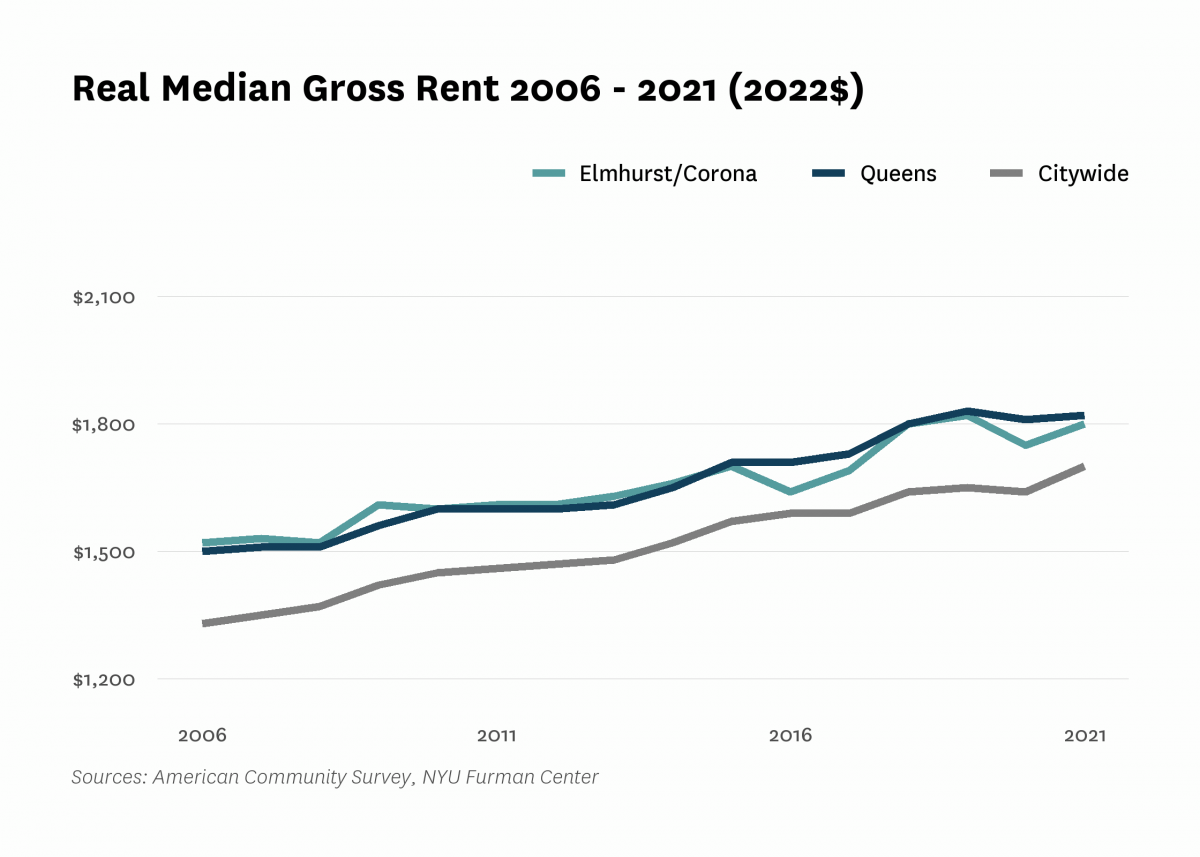
| Median rent, 2- and 3-bedrooms (2022$) | $1,730 | $1,870 | $2,040 | |||
| Median rent, all (2022$) | $1,290 | $1,520 | $1,600 | $1,820 | $1,800 | |
| Median rent, recent movers (2022$) | $1,690 | $1,860 | $1,950 | |||
| Median rent, studios and 1-bedrooms (2022$) | $1,400 | $1,440 | $1,610 | |||
| Change in collected rent (2019-2020) | 2.2% | |||||
| Affordability | ||||||
| Rental units affordable at 30% AMI (% of recently available units) | 2.2% | 3.2% | 6.3% | |||
| Rental units affordable at 80% AMI (% of recently available units) | 56.6% | 61.1% | 63.0% | |||
| Rental units affordable at 120% AMI (% of recently available units) | 98.4% | 99.3% | 100.0% | |||
| Rent Burden | ||||||
| Moderately rent-burdened households | 29.2% | 24.3% | 26.1% | 23.7% | ||
| Moderately rent-burdened households, low income | 36.4% | 34.6% | 32.7% | |||
| Moderately rent-burdened households, moderate income | 10.1% | 10.5% | 9.4% | |||
| Severely rent-burdened households | 22.8% | 33.2% | 33.3% | 31.6% | ||
| Severely rent-burdened households, low income | 47.3% | 43.4% | 44.6% | |||
| Severely rent-burdened households, moderate income | 0.3% | 0.2% | 0.7% | |||
| Rental Subsidy | ||||||
| Housing choice vouchers (% of occupied, privately owned rental units) | 2.1% | 1.6% | ||||
| Public housing (% of rental units) | 0.0% | |||||
Data Notes: See CoreData User Guide for more information about indicator definitions and methods.
Indicators: The rental vacancy rate, severe crowding rate, and the severely rent-burdened households indicators use five-year American Community Survey (ACS) estimates. Data under the 2010 heading comes from the 2006 – 2010 ACS, data under the 2019 heading comes from the 2015 – 2019 ACS and data under the 2021 heading comes from 2017 – 2021 ACS .
All content © 2005 – 2024 Furman Center for Real Estate and Urban Policy | Top of page | Contact Us