| Indicator | 2000 | 2006 | 2010 | 2019 | 2021 | 2022 |
|---|---|---|---|---|---|---|
| Population | ||||||
| Born in New York State | 40.0% | 41.4% | 41.2% | 38.2% | ||
| Disabled population | 7.0% | 7.9% | 12.8% | |||
| Foreign-born population | 47.6% | 54.0% | 53.1% | 54.6% | 54.5% | |
| Population | 116,138 | 103,687 | 103,112 | 115,277 | 120,401 | |
| Population aged 65+ | 20.7% | 26.1% | 22.4% | 25.5% | 28.3% | |
| Households | ||||||
| Households with children under 18 years old | 29.3% | 21.8% | 24.2% | 25.0% | 22.2% | |
| Single-person households | 40.7% | 37.1% | 31.4% | 32.2% | ||
| Race and Ethnicity | ||||||
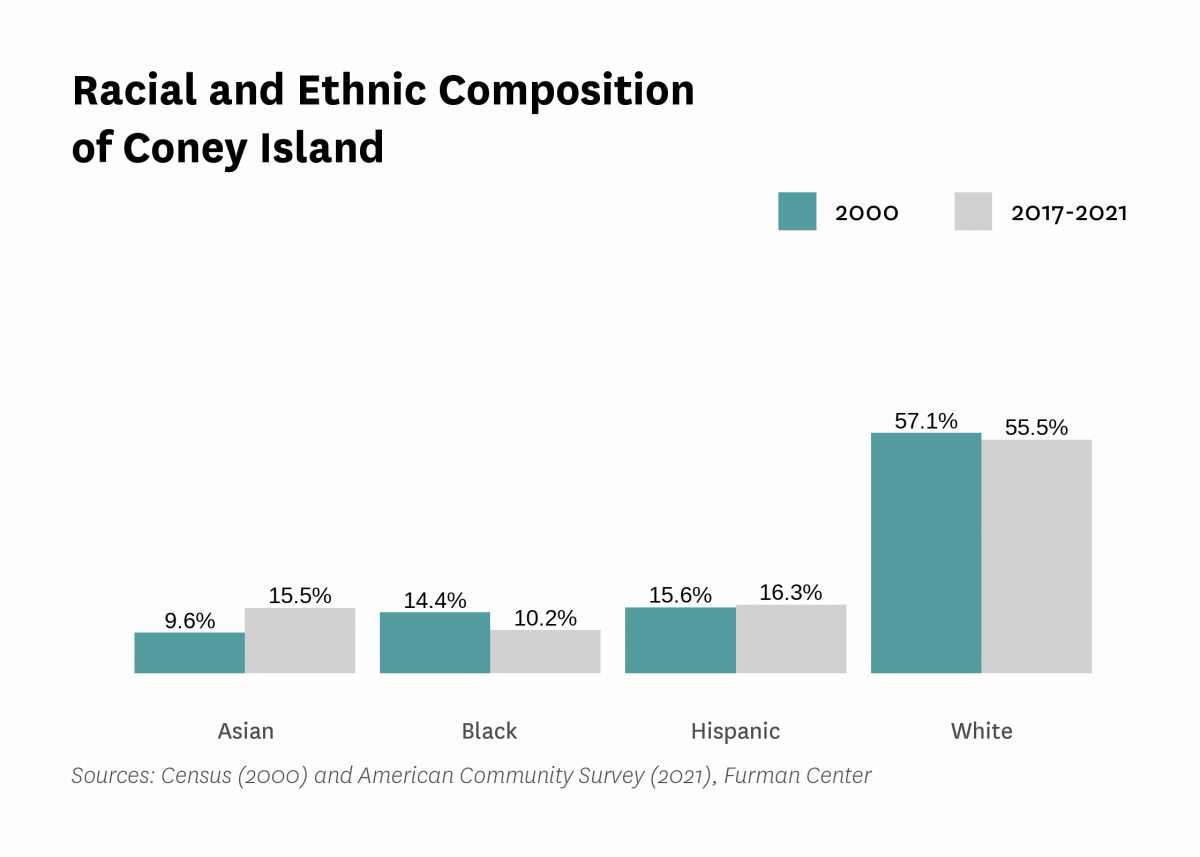
| Percent Asian | 9.6% | 10.1% | 14.6% | 16.4% | 15.5% | |
| Percent Black | 14.4% | 11.6% | 12.2% | 11.0% | 10.2% | |
| Percent Hispanic | 15.6% | 14.5% | 12.5% | 14.7% | 16.3% | |
| Percent white | 57.1% | 63.4% | 59.3% | 53.5% | 55.5% | |
| Racial diversity index | 0.62 | 0.55 | 0.60 | 0.65 | 0.63 | |
| Income and Poverty | ||||||
| Income diversity ratio | 8.5 | 5.6 | 7.8 | 7.1 | ||
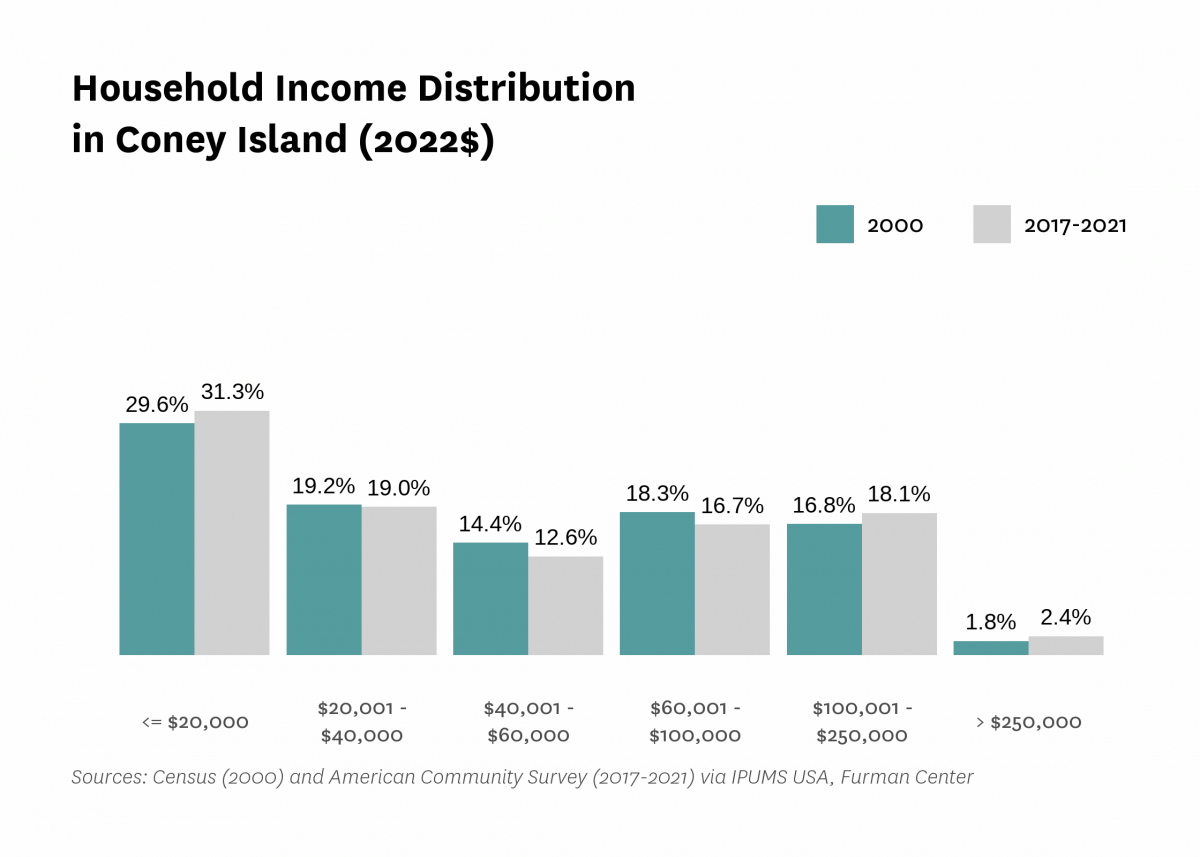
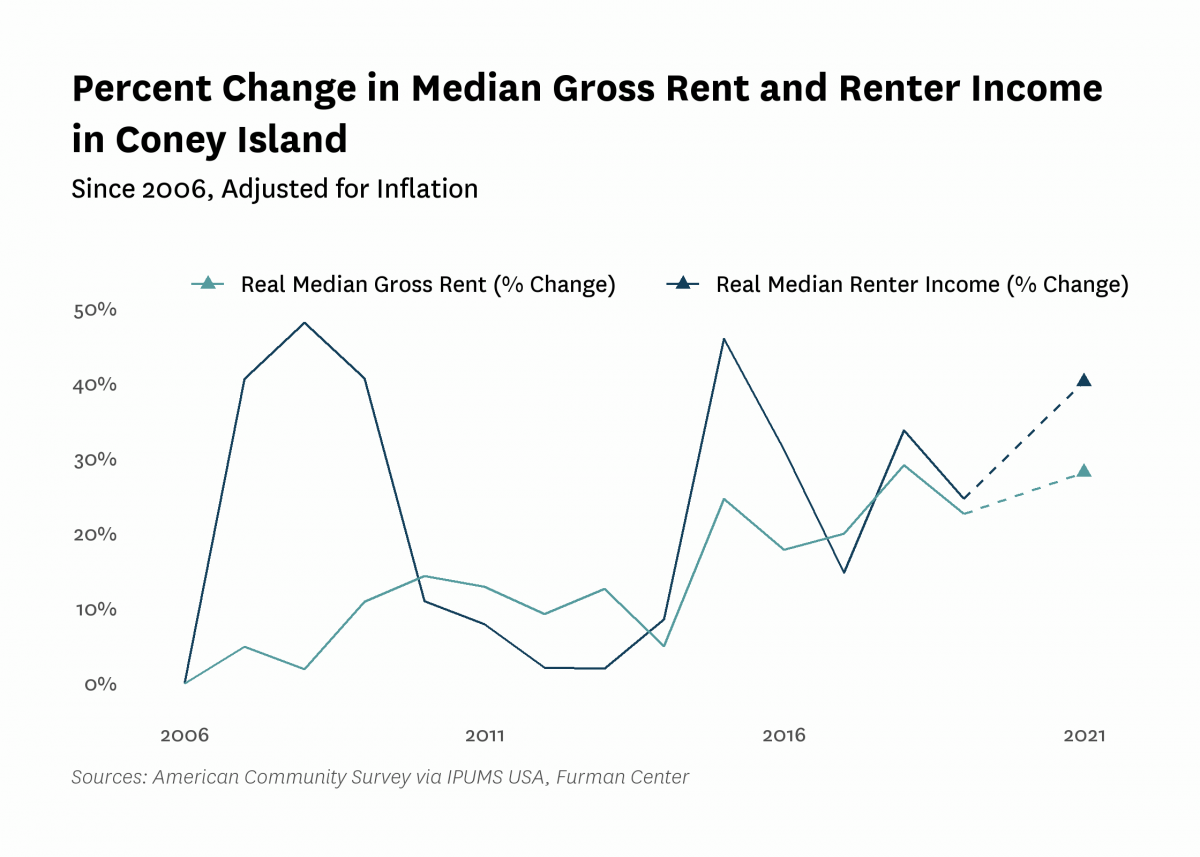
| Median household income (2022$) | $42,930 | $39,320 | $37,490 | $45,390 | $44,080 | |
| Median household income, homeowners (2022$) | $85,400 | $65,830 | $88,660 | $79,750 | ||
| Median household income, renters (2022$) | $24,310 | $26,990 | $30,290 | $34,090 | ||
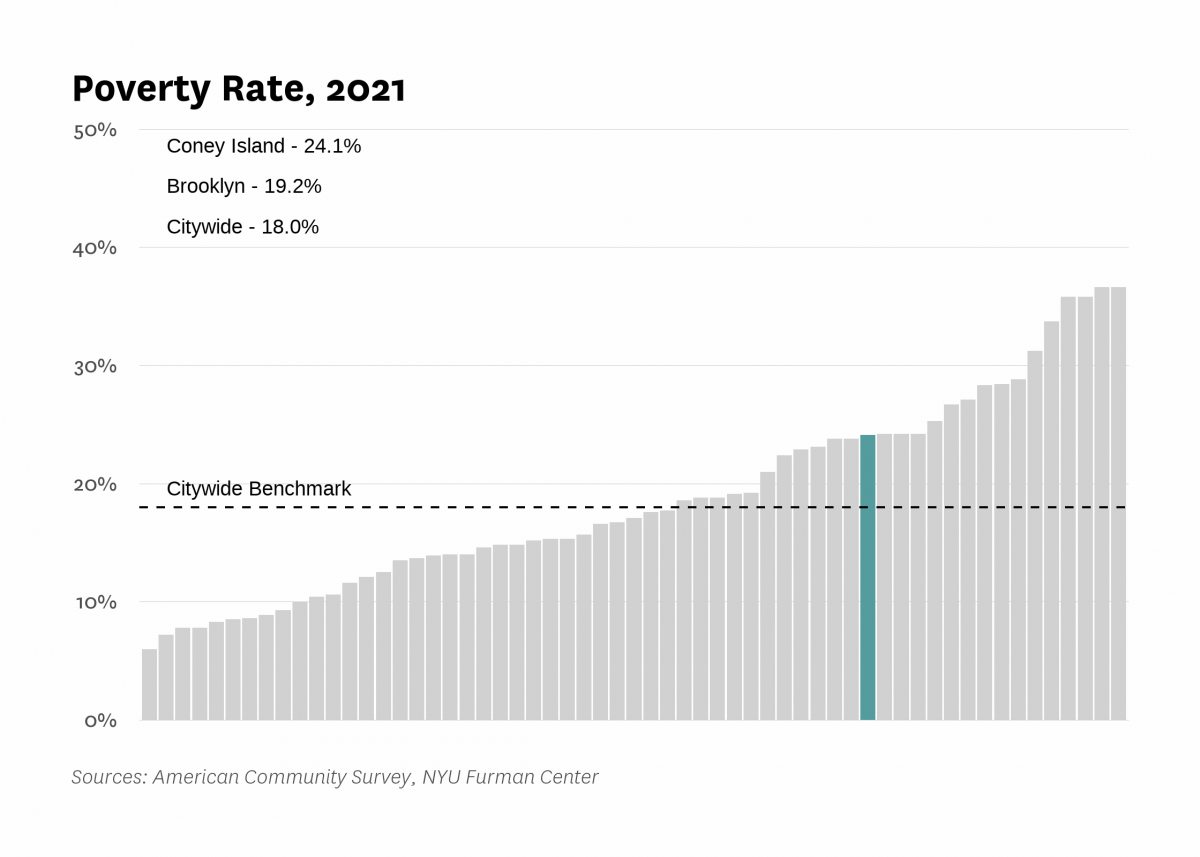
| Poverty rate | 28.5% | 22.0% | 28.0% | 25.6% | 24.1% | |
| Poverty rate, population aged 65+ | 36.9% | 25.3% | 34.8% | 28.5% | ||
| Poverty rate, population under 18 years old | 26.6% | 39.4% | 30.2% | 32.6% | ||
| Labor Market | ||||||
| Labor force participation rate | 45.9% | 50.0% | 50.8% | 50.9% | ||
| Population aged 25+ without a high school diploma | 17.1% | 17.7% | 18.6% | 16.5% | ||
| Unemployment rate | 10.40% | 4.93% | 14.39% | 4.41% | 10.59% | |
| Indicator | 2000 | 2006 | 2010 | 2019 | 2021 | 2022 |
|---|---|---|---|---|---|---|
| Housing Stock | ||||||
| Homeownership rate | 23.3% | 28.5% | 30.2% | 24.9% | 32.5% | |
| Housing units | 45,661 | 46,724 | 50,586 | 53,107 | ||
| Rental vacancy rate | 3.0% | 1.6% | 1.7% | |||
| Serious housing code violations (per 1,000 privately owned rental units) | 25.9 | 31.9 | 58.9 | 61.9 | 69.9 | |
| Severe crowding rate (% of renter households) | 3.0% | 5.5% | 6.6% | |||
| Total housing code violations (per 1,000 privately owned rental units) | 182.5 | 165.9 | 235.0 | 296.5 | 270.2 | |
| Finance - Distress | ||||||
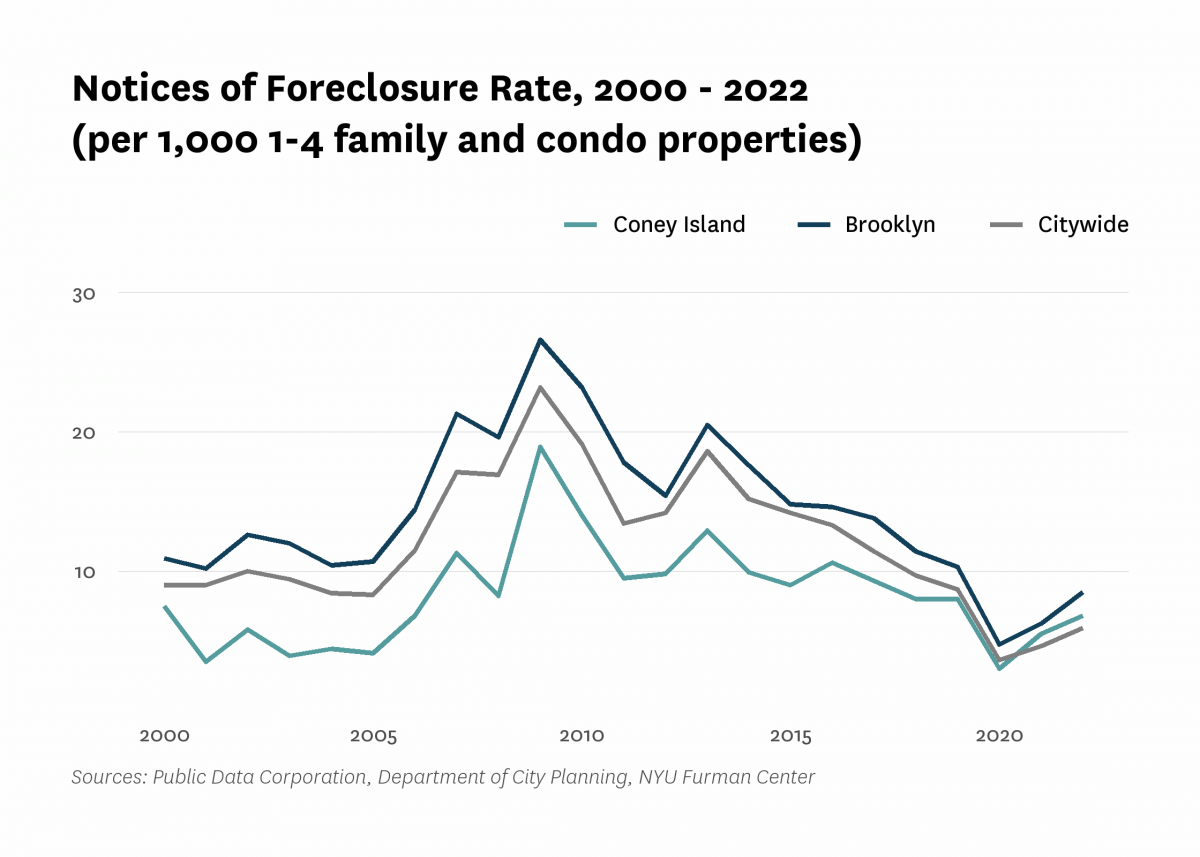
| Notices of foreclosure rate (per 1,000 1-4 family and condo properties) | 7.5 | 6.8 | 14.0 | 8.0 | 5.5 | 6.8 |
| Notices of foreclosure, all residential properties | 49 | 49 | 126 | 65 | 54 | 54 |
| Notices of foreclosure, initial, 1-4 family and condo properties | 32 | 42 | 70 | 21 | 21 | 21 |
| Notices of foreclosure, repeat, 1-4 family and condo properties | 13 | 6 | 34 | 42 | 22 | 33 |
| Pre-foreclosure notice rate (per 1,000 1-4 family and condo properties) | 22.7 | 11.6 | 22.9 | |||
| Pre-foreclosure notices, 1-4 family and condo properties | 179 | 91 | 181 | |||
| Properties entering REO, 1-4 family | 9 | 2 | 3 | |||
| Finance - Lending | ||||||
| FHA/VA-backed home purchase loans (% of home purchase loans) | 0.0% | 2.5% | 1.3% | 1.7% | ||
| Higher-cost home purchase loans (% of home purchase loans) | 17.9% | 0.7% | 3.1% | 3.6% | ||
| Higher-cost refinance loans (% of refinance loans) | 29.4% | 1.0% | 1.9% | 1.2% | ||
| Home purchase loan rate (per 1,000 properties) | 22.1 | 12.7 | 14.1 | 18.6 | ||
| Home purchase loans in LMI tracts (% of home purchase loans) | 60.7% | 19.4% | 24.2% | 27.4% | ||
| Home purchase loans to LMI borrowers (% of home purchase loans) | 7.1% | 42.3% | 16.0% | 19.7% | ||
| Refinance loan rate (per 1,000 properties) | 15.2 | 8.8 | 7.0 | 22.0 | ||
| Sales - Volume | ||||||
| Sales volume, 1 family building | 98 | 67 | 25 | 31 | 23 | 54 |
| Sales volume, 2-4 family building | 148 | 136 | 44 | 42 | 50 | 76 |
| Sales volume, 5+ family building | 11 | 27 | 5 | 1 | 7 | 15 |
| Sales volume, condominium | 32 | 179 | 93 | 89 | 106 | 88 |
| Sales volume, all property types | 289 | 409 | 167 | 163 | 186 | 233 |
| Sales - Median Prices | ||||||
| Median sales price per unit, 1 family building (2022$) | $275,330 | $583,180 | $508,610 | $644,450 | $636,620 | $616,500 |
| Median sales price per unit, 2-4 family building (2022$) | $178,440 | $385,390 | $335,820 | $445,980 | $492,050 | $450,000 |
| Median sales price per unit, 5+ family building (2022$) | $69,860 | $166,290 | $138,300 | $167,240 | $182,500 | $250,000 |
| Median sales price per unit, condominium (2022$) | $229,420 | $765,530 | $642,520 | $613,230 | $636,610 | $687,500 |
| Sales - Housing Price Index | ||||||
| Index of housing price appreciation, 1 family building | 100.0 | 256.4 | 249.2 | 342.4 | 408.0 | 403.4 |
| Index of housing price appreciation, 2-4 family building | 100.0 | 268.5 | 216.9 | 342.3 | 316.5 | 349.1 |
| Index of housing price appreciation, 5+ family building | 100.0 | 262.9 | 312.5 | 3,245.4 | 390.3 | 500.8 |
| Index of housing price appreciation, condominium | 100.0 | 277.2 | 228.6 | 316.4 | 327.3 | 335.7 |
| Index of housing price appreciation, all property types | 100.0 | 261.3 | 222.0 | 314.5 | 316.2 | 349.9 |
| Subsidized Housing | ||||||
| Total number of subsidized properties (properties) | 95 | |||||
| HUD Financing or Insurance (properties) | 4 | |||||
| HUD Financing or Insurance (units) | 454 | |||||
| HUD Project-based Rental Assistance Program (properties) | 11 | |||||
| HUD Project-based Rental Assistance Program (units) | 871 | |||||
| Low Income Housing Tax Credit (properties) | 13 | |||||
| Low Income Housing Tax Credit (units) | 3,565 | |||||
| Public Housing (properties) | 15 | |||||
| Public Housing (units) | 6,140 | |||||
| Mitchell-Lama (properties) | 14 | |||||
| Mitchell-Lama (units) | 6,191 | |||||
| 421-a Tax Exemption (properties) | 90 | |||||
| 421-a Tax Exemption (units) | 1,992 | |||||
| 420-c Tax Exemption (properties) | 8 | |||||
| 420-c Tax Exemption (units) | 1,629 | |||||
| NYC Housing Production Programs and Zoning Incentives or Requirements (properties) | 24 | |||||
| Eligible to expire from housing programs between 2023 and 2028 (properties) | 4 | |||||
| Eligible to expire from housing programs between 2023 and 2028 (units) | 495 | |||||
| Eligible to expire from housing programs between 2029 and 2038 (properties) | 6 | |||||
| Eligible to expire from housing programs between 2029 and 2038 (units) | 1,494 | |||||
| Eligible to expire from housing programs in 2039 and later (properties) | 18 | |||||
| Eligible to expire from housing programs in 2039 and later (units) | 3,277 | |||||
| Indicator | 2000 | 2006 | 2010 | 2019 | 2021 | 2022 |
|---|---|---|---|---|---|---|
| Density | ||||||
| Population density (1,000 persons per square mile) | 30.2 | 30.0 | 33.5 | 35.0 | ||
| Development | ||||||
| Units authorized by new residential building permits | 250 | 0 | 63 | 489 | 874 | 304 |
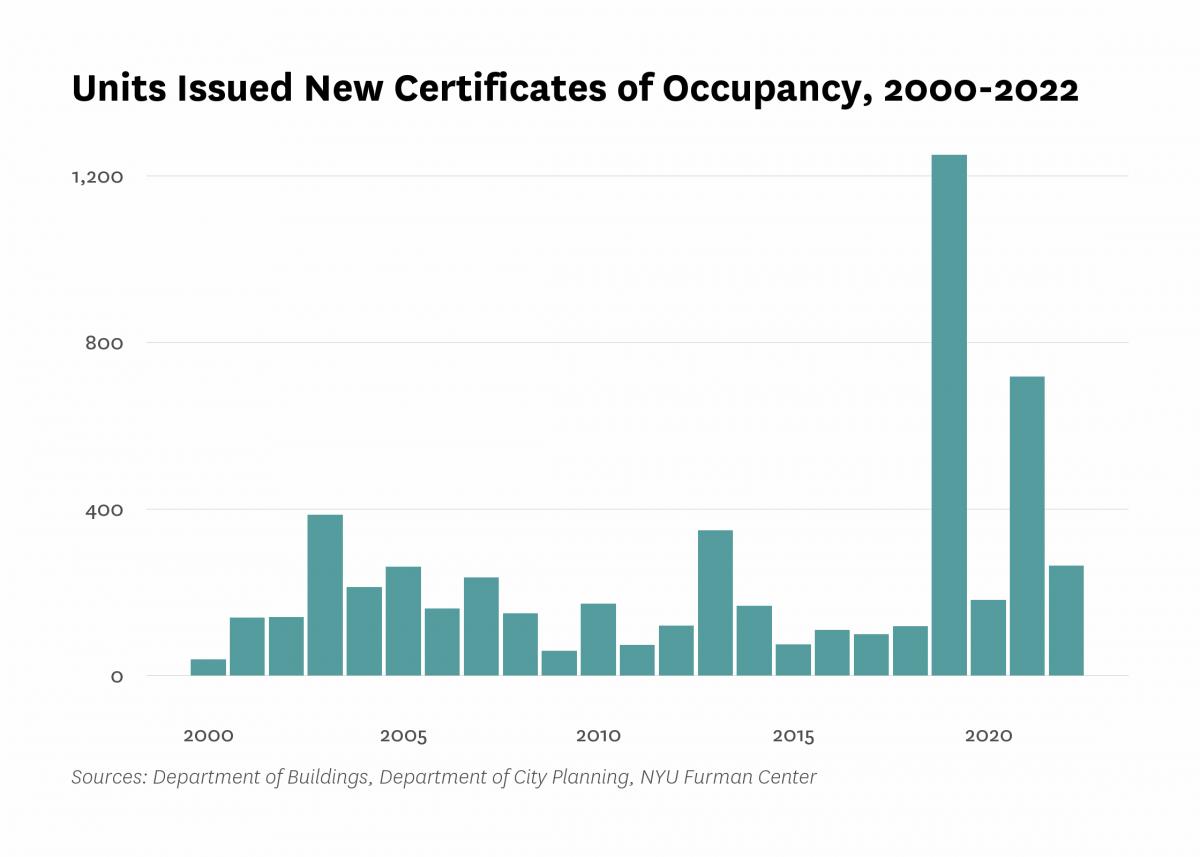
| Units issued new certificates of occupancy | 39 | 161 | 172 | 1,250 | 718 | 264 |
| Indicator | 2000 | 2006 | 2010 | 2019 | 2021 | 2022 |
|---|---|---|---|---|---|---|
| Commute | ||||||
| Car-free commute (% of commuters) | 64.1% | 71.4% | 67.0% | 70.7% | 64.1% | |
| Mean travel time to work (minutes) | 46.3 | 44.7 | 44.4 | 46.8 | 39.9 | |
| Crime and Incarceration | ||||||
| Serious crime rate (per 1,000 residents) | 14.7 | 12.6 | 9.0 | 10.7 | 12.6 | |
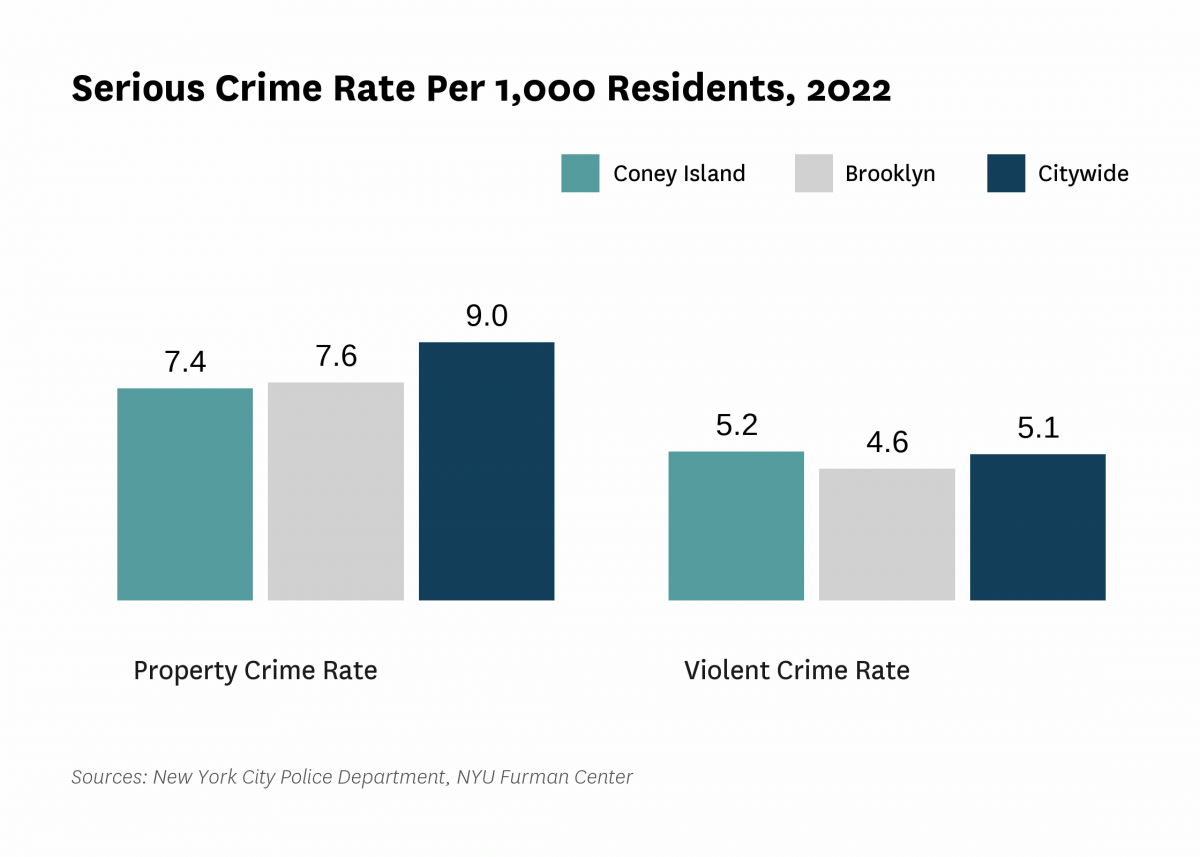
| Serious crime rate, property (per 1,000 residents) | 9.1 | 8.0 | 5.4 | 6.4 | 7.4 | |
| Serious crime rate, violent (per 1,000 residents) | 5.6 | 4.7 | 3.7 | 4.3 | 5.2 | |
| Schools | ||||||
| Students performing at grade level in English language arts, 4th grade | 50.5% | 44.1% | ||||
| Students performing at grade level in math, 4th grade | 53.6% | 52.0% | ||||
| Indicator | 2000 | 2006 | 2010 | 2019 | 2021 | 2022 |
|---|---|---|---|---|---|---|
| Median Rent | ||||||
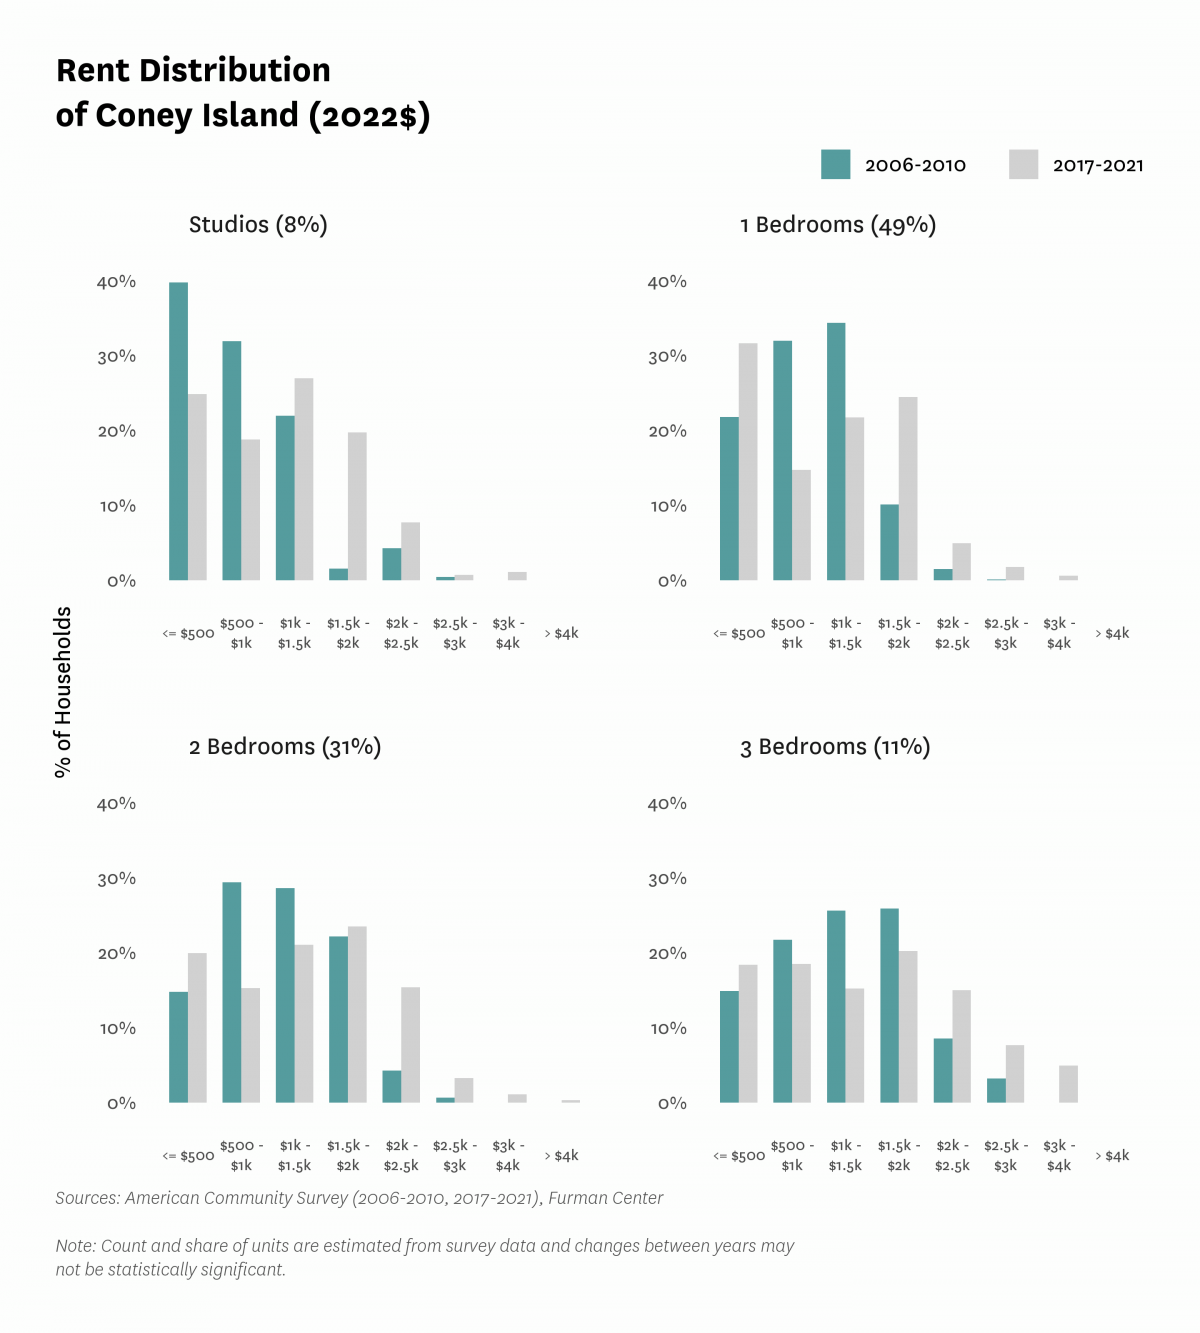
| Median rent, 2- and 3-bedrooms (2022$) | $1,110 | $1,340 | $1,410 | |||
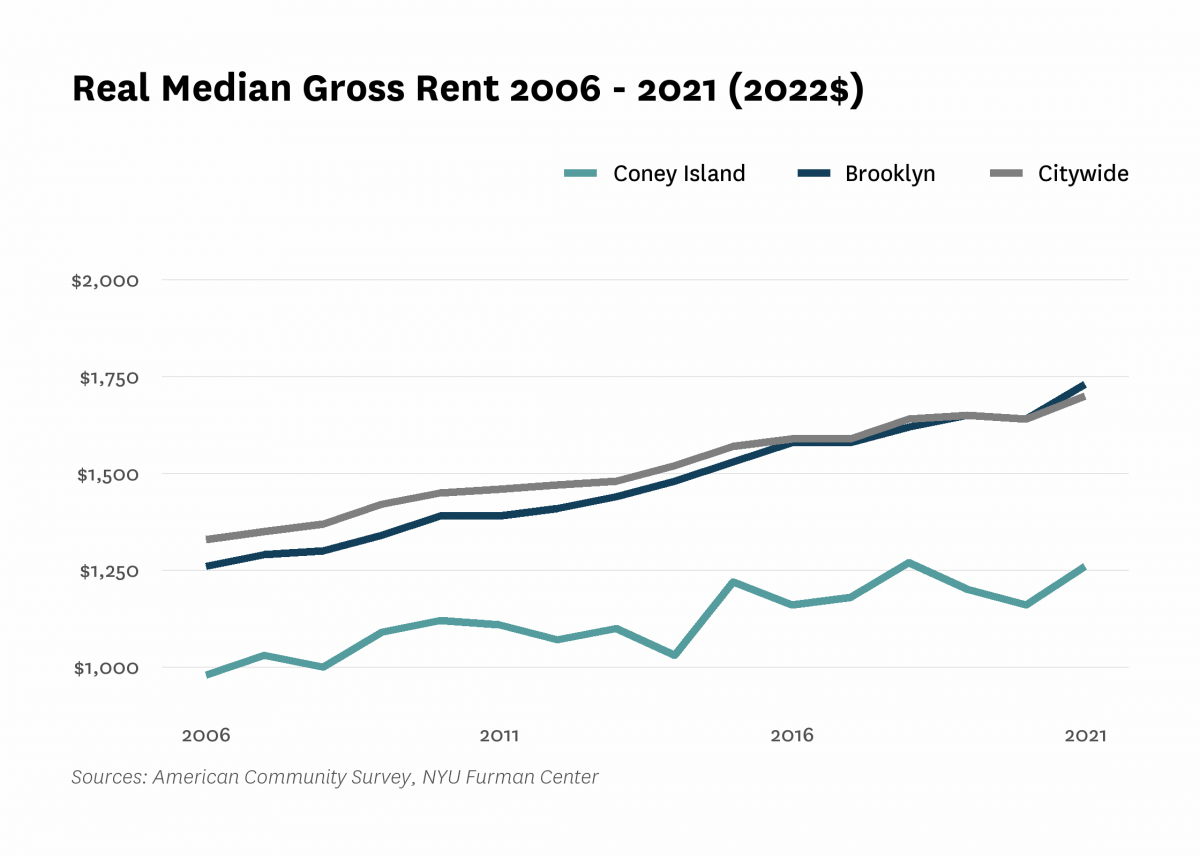
| Median rent, all (2022$) | $970 | $980 | $1,120 | $1,200 | $1,260 | |
| Median rent, recent movers (2022$) | $1,390 | $1,560 | $1,810 | |||
| Median rent, studios and 1-bedrooms (2022$) | $920 | $1,010 | $1,100 | |||
| Change in collected rent (2019-2020) | 1.8% | |||||
| Affordability | ||||||
| Rental units affordable at 30% AMI (% of recently available units) | 17.3% | |||||
| Rental units affordable at 80% AMI (% of recently available units) | 74.6% | |||||
| Rental units affordable at 120% AMI (% of recently available units) | 100.0% | |||||
| Rent Burden | ||||||
| Moderately rent-burdened households | 23.1% | 26.9% | 30.6% | 29.2% | ||
| Moderately rent-burdened households, low income | 31.5% | 34.3% | 34.2% | |||
| Moderately rent-burdened households, moderate income | 13.7% | 8.6% | 12.3% | |||
| Severely rent-burdened households | 29.6% | 27.0% | 30.3% | 31.2% | ||
| Severely rent-burdened households, low income | 34.5% | 37.0% | 38.1% | |||
| Severely rent-burdened households, moderate income | 0.0% | 0.0% | 0.0% | |||
| Rental Subsidy | ||||||
| Housing choice vouchers (% of occupied, privately owned rental units) | 14.1% | 16.7% | ||||
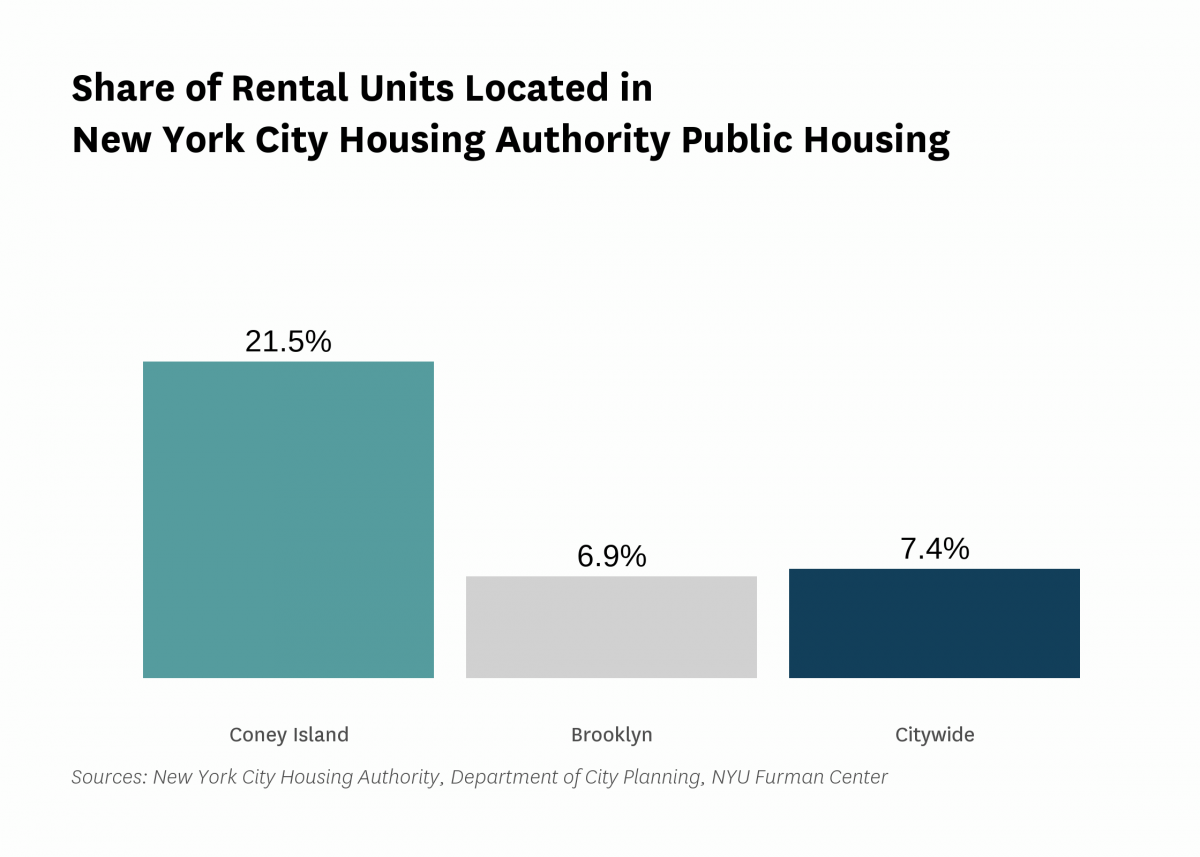
| Public housing (% of rental units) | 21.5% | |||||
Data Notes: See CoreData User Guide for more information about indicator definitions and methods.
Indicators: The rental vacancy rate, severe crowding rate, and the severely rent-burdened households indicators use five-year American Community Survey (ACS) estimates. Data under the 2010 heading comes from the 2006 – 2010 ACS, data under the 2019 heading comes from the 2015 – 2019 ACS and data under the 2021 heading comes from 2017 – 2021 ACS .
All content © 2005 – 2024 Furman Center for Real Estate and Urban Policy | Top of page | Contact Us