| Indicator | 2000 | 2006 | 2010 | 2019 | 2021 | 2022 |
|---|---|---|---|---|---|---|
| Population | ||||||
| Born in New York State | 57.6% | 57.5% | 58.5% | 52.4% | ||
| Disabled population | 11.8% | 10.6% | 11.8% | |||
| Foreign-born population | 17.8% | 20.8% | 19.7% | 20.5% | 23.4% | |
| Population | 109,091 | 118,143 | 126,558 | 136,351 | 128,792 | |
| Population aged 65+ | 11.3% | 10.3% | 10.5% | 11.9% | 13.6% | |
| Households | ||||||
| Households with children under 18 years old | 34.0% | 32.5% | 27.8% | 22.8% | 23.4% | |
| Single-person households | 46.9% | 41.5% | 42.7% | 45.7% | ||
| Race and Ethnicity | ||||||
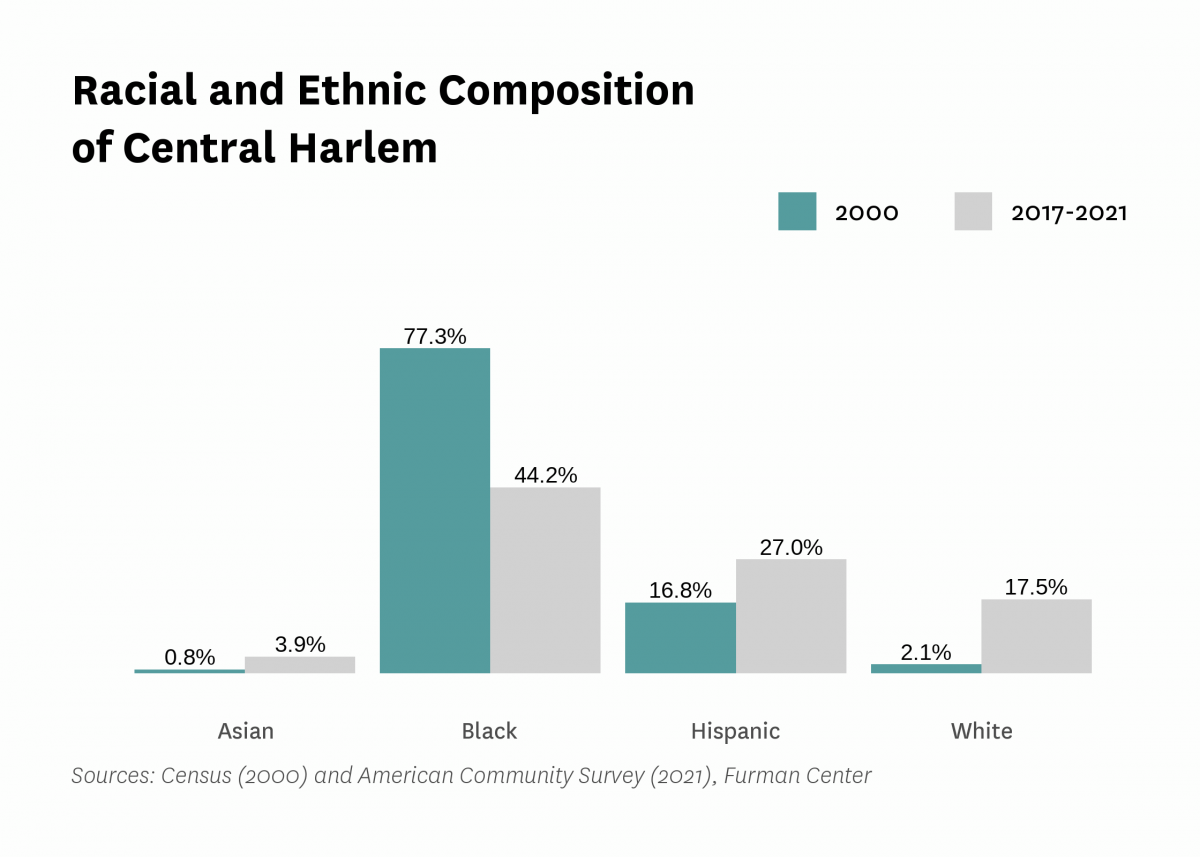
| Percent Asian | 0.8% | 2.3% | 3.5% | 3.6% | 3.9% | |
| Percent Black | 77.3% | 69.5% | 58.6% | 54.3% | 44.2% | |
| Percent Hispanic | 16.8% | 18.4% | 23.6% | 23.6% | 27.0% | |
| Percent white | 2.1% | 6.8% | 11.8% | 15.5% | 17.5% | |
| Racial diversity index | 0.37 | 0.48 | 0.59 | 0.62 | 0.70 | |
| Income and Poverty | ||||||
| Income diversity ratio | 7.5 | 7.5 | 8.9 | 8.3 | ||
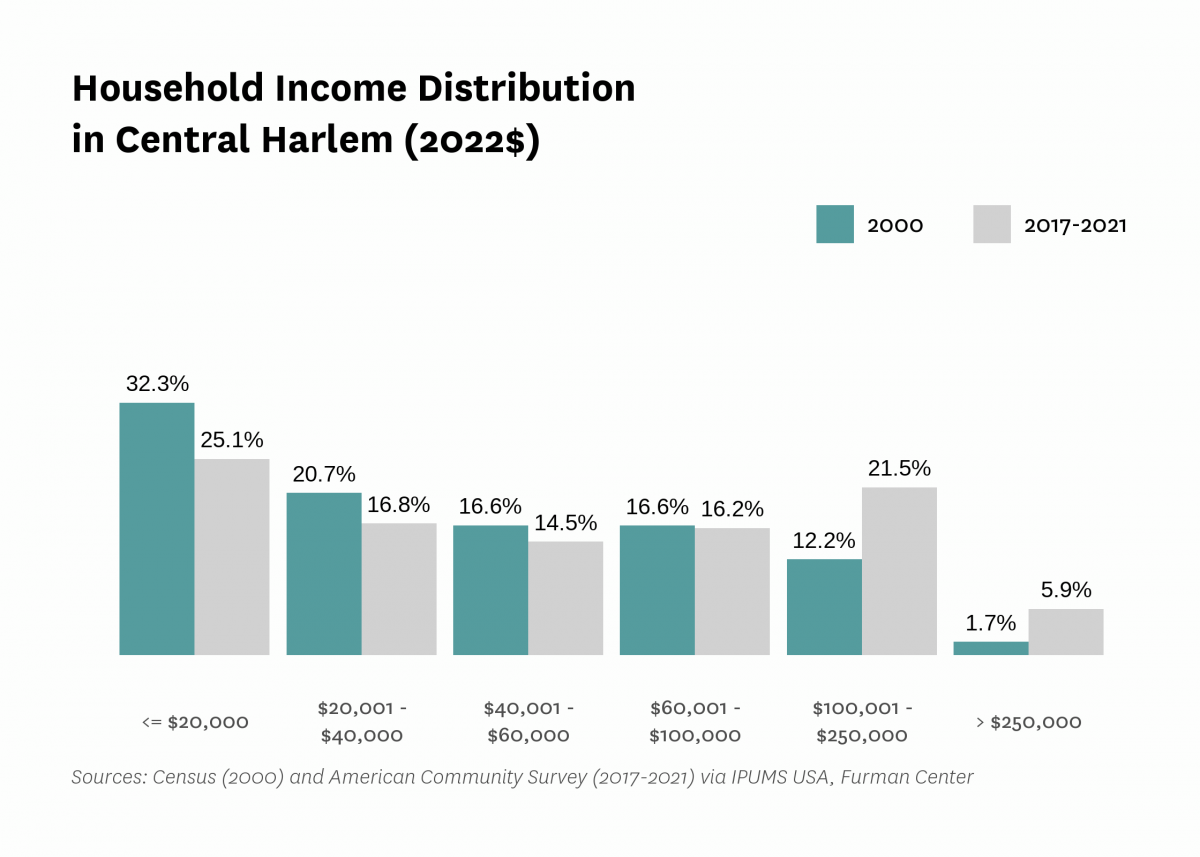
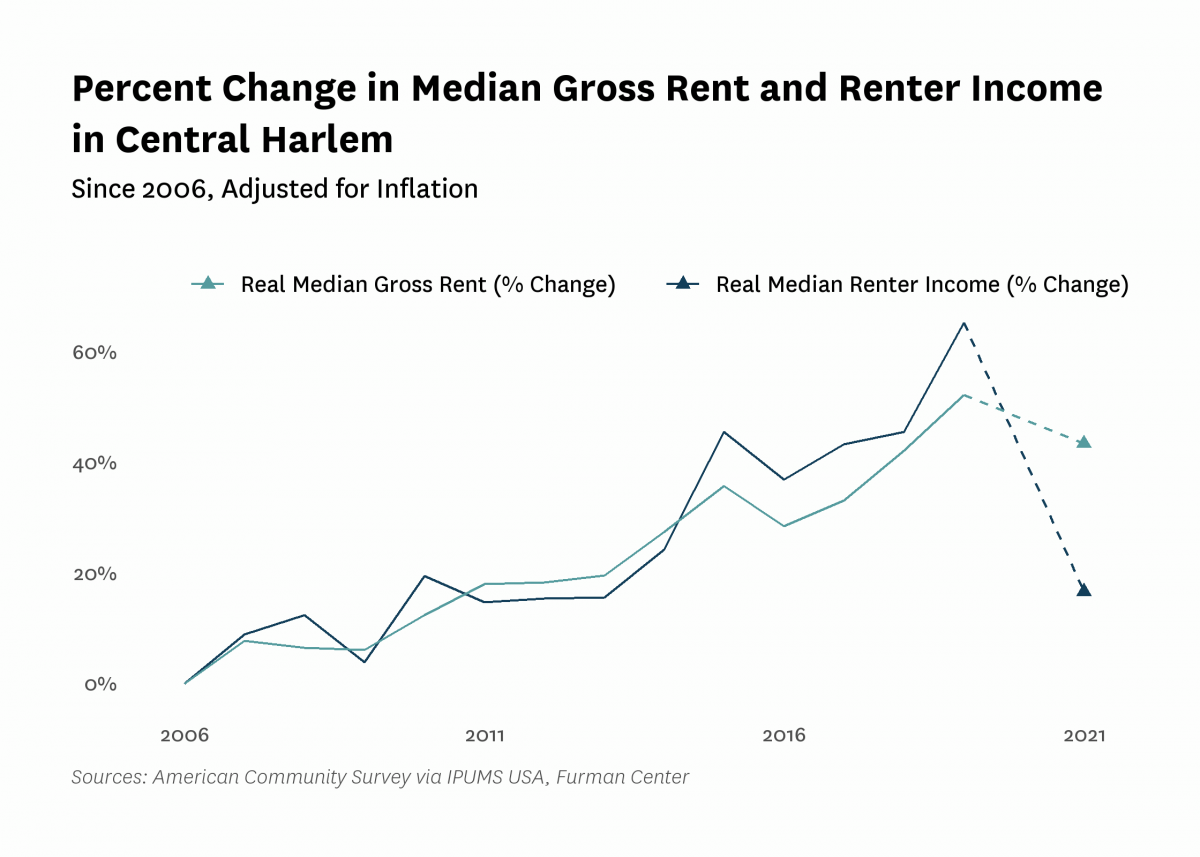
| Median household income (2022$) | $37,500 | $37,950 | $45,500 | $61,250 | $47,990 | |
| Median household income, homeowners (2022$) | $126,630 | $143,050 | $145,620 | $135,680 | ||
| Median household income, renters (2022$) | $33,870 | $40,470 | $55,990 | $39,520 | ||
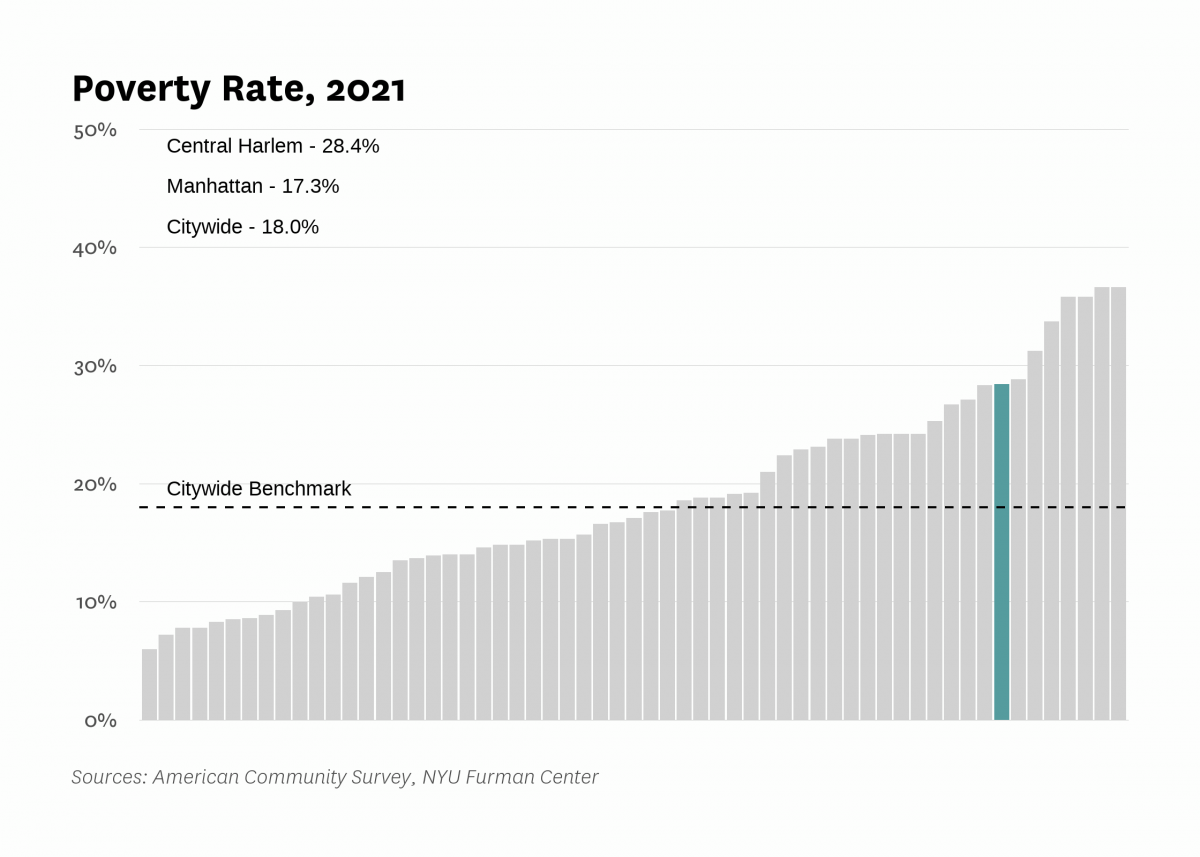
| Poverty rate | 36.4% | 28.7% | 28.1% | 20.1% | 28.4% | |
| Poverty rate, population aged 65+ | 34.0% | 27.5% | 25.2% | 36.8% | ||
| Poverty rate, population under 18 years old | 33.7% | 35.8% | 26.4% | 35.5% | ||
| Labor Market | ||||||
| Labor force participation rate | 60.7% | 56.8% | 69.0% | 64.5% | ||
| Population aged 25+ without a high school diploma | 26.3% | 21.1% | 13.9% | 16.0% | ||
| Unemployment rate | 18.61% | 13.41% | 15.88% | 8.69% | 15.90% | |
| Indicator | 2000 | 2006 | 2010 | 2019 | 2021 | 2022 |
|---|---|---|---|---|---|---|
| Housing Stock | ||||||
| Homeownership rate | 6.6% | 12.2% | 13.4% | 14.0% | 15.5% | |
| Housing units | 57,994 | 61,313 | 63,719 | 64,827 | ||
| Rental vacancy rate | 4.7% | 4.6% | 5.1% | |||
| Serious housing code violations (per 1,000 privately owned rental units) | 52.5 | 50.5 | 122.9 | 143.1 | 175.7 | |
| Severe crowding rate (% of renter households) | 3.0% | 2.4% | 2.8% | |||
| Total housing code violations (per 1,000 privately owned rental units) | 285.0 | 243.6 | 439.7 | 556.3 | 588.2 | |
| Finance - Distress | ||||||
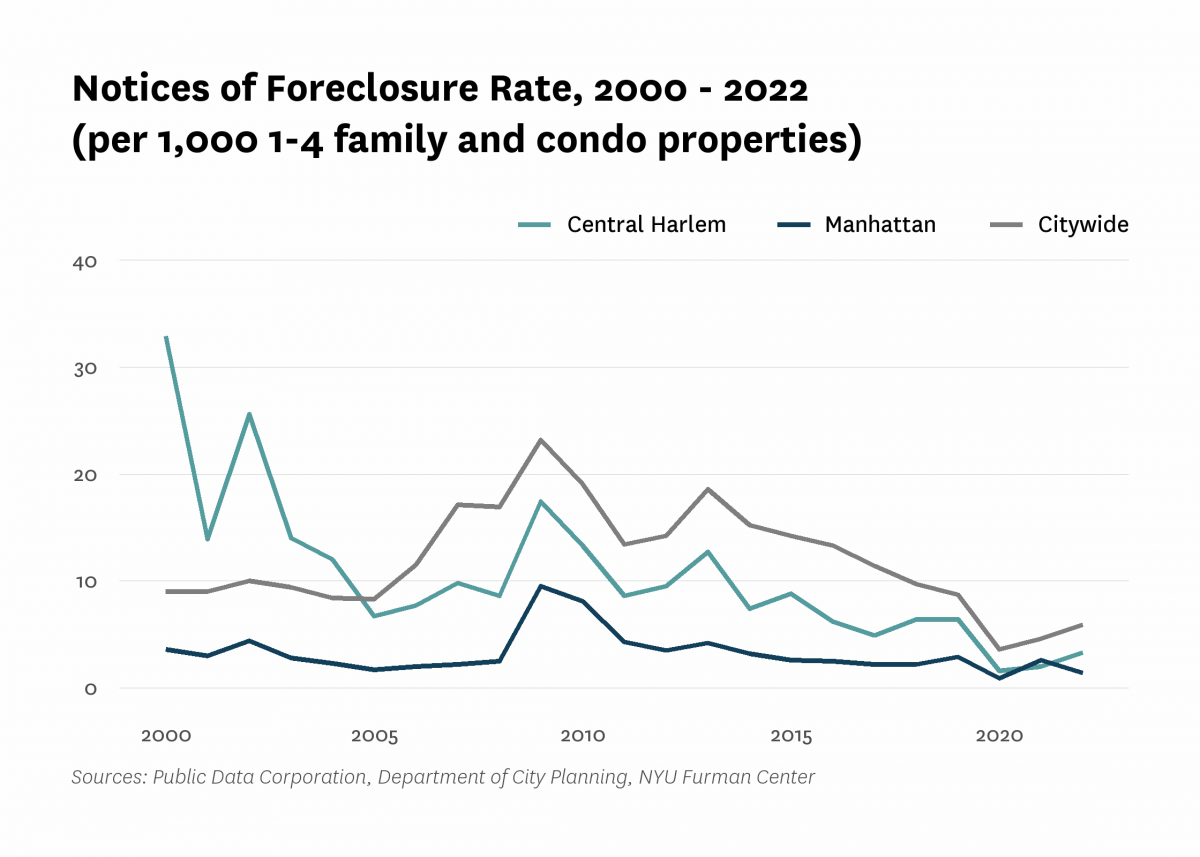
| Notices of foreclosure rate (per 1,000 1-4 family and condo properties) | 32.9 | 7.7 | 13.3 | 6.4 | 2.0 | 3.3 |
| Notices of foreclosure, all residential properties | 137 | 42 | 106 | 50 | 21 | 32 |
| Notices of foreclosure, initial, 1-4 family and condo properties | 40 | 21 | 57 | 17 | 5 | 11 |
| Notices of foreclosure, repeat, 1-4 family and condo properties | 8 | 3 | 7 | 21 | 8 | 11 |
| Pre-foreclosure notice rate (per 1,000 1-4 family and condo properties) | 36.9 | 14.4 | 30.9 | |||
| Pre-foreclosure notices, 1-4 family and condo properties | 219 | 95 | 204 | |||
| Properties entering REO, 1-4 family | 2 | 0 | 0 | |||
| Finance - Lending | ||||||
| FHA/VA-backed home purchase loans (% of home purchase loans) | 0.0% | 14.7% | 0.4% | 0.3% | ||
| Higher-cost home purchase loans (% of home purchase loans) | 6.5% | 1.3% | 0.0% | 1.2% | ||
| Higher-cost refinance loans (% of refinance loans) | 29.8% | 2.8% | 2.2% | 0.0% | ||
| Home purchase loan rate (per 1,000 properties) | 37.8 | 42.9 | 19.9 | 28.1 | ||
| Home purchase loans in LMI tracts (% of home purchase loans) | 92.0% | 6.6% | 33.1% | 42.8% | ||
| Home purchase loans to LMI borrowers (% of home purchase loans) | 5.1% | 98.5% | 4.7% | 5.3% | ||
| Refinance loan rate (per 1,000 properties) | 28.2 | 9.8 | 11.4 | 37.9 | ||
| Sales - Volume | ||||||
| Sales volume, 1 family building | 3 | 10 | 3 | 3 | 3 | 5 |
| Sales volume, 2-4 family building | 51 | 55 | 29 | 21 | 28 | 27 |
| Sales volume, 5+ family building | 47 | 78 | 44 | 29 | 30 | 36 |
| Sales volume, condominium | 20 | 191 | 341 | 194 | 301 | 406 |
| Sales volume, all property types | 121 | 334 | 417 | 247 | 362 | 474 |
| Sales - Median Prices | ||||||
| Median sales price per unit, 1 family building (2022$) | $552,310 | $1,394,720 | $2,060,190 | $2,486,350 | $3,023,920 | $2,257,500 |
| Median sales price per unit, 2-4 family building (2022$) | $228,830 | $443,610 | $395,220 | $933,780 | $901,870 | $833,330 |
| Median sales price per unit, 5+ family building (2022$) | $54,840 | $161,370 | $127,470 | $275,730 | $168,440 | $169,510 |
| Median sales price per unit, condominium (2022$) | $285,300 | $765,530 | $773,560 | $1,039,700 | $982,510 | $946,790 |
| Sales - Housing Price Index | ||||||
| Index of housing price appreciation, 1 family building | 100.0 | 858.8 | 1,986.9 | 1,924.1 | 1,209.1 | |
| Index of housing price appreciation, 2-4 family building | 100.0 | 334.2 | 212.2 | 605.9 | 583.9 | 636.6 |
| Index of housing price appreciation, 5+ family building | 100.0 | 353.7 | 261.0 | 643.7 | 662.3 | 507.8 |
| Index of housing price appreciation, condominium | 100.0 | 263.8 | 279.3 | 487.8 | 462.0 | 496.2 |
| Index of housing price appreciation, all property types | 100.0 | 317.1 | 303.2 | 565.6 | 544.3 | 555.4 |
| Subsidized Housing | ||||||
| Total number of subsidized properties (properties) | 1,355 | |||||
| HUD Financing or Insurance (properties) | 25 | |||||
| HUD Financing or Insurance (units) | 1,779 | |||||
| HUD Project-based Rental Assistance Program (properties) | 67 | |||||
| HUD Project-based Rental Assistance Program (units) | 3,796 | |||||
| Low Income Housing Tax Credit (properties) | 391 | |||||
| Low Income Housing Tax Credit (units) | 10,330 | |||||
| Public Housing (properties) | 54 | |||||
| Public Housing (units) | 7,529 | |||||
| Mitchell-Lama (properties) | 6 | |||||
| Mitchell-Lama (units) | 2,449 | |||||
| 421-a Tax Exemption (properties) | 108 | |||||
| 421-a Tax Exemption (units) | 5,392 | |||||
| 420-c Tax Exemption (properties) | 226 | |||||
| 420-c Tax Exemption (units) | 5,139 | |||||
| NYC Housing Production Programs and Zoning Incentives or Requirements (properties) | 520 | |||||
| Eligible to expire from housing programs between 2023 and 2028 (properties) | 72 | |||||
| Eligible to expire from housing programs between 2023 and 2028 (units) | 1,518 | |||||
| Eligible to expire from housing programs between 2029 and 2038 (properties) | 164 | |||||
| Eligible to expire from housing programs between 2029 and 2038 (units) | 5,841 | |||||
| Eligible to expire from housing programs in 2039 and later (properties) | 202 | |||||
| Eligible to expire from housing programs in 2039 and later (units) | 7,588 | |||||
| Indicator | 2000 | 2006 | 2010 | 2019 | 2021 | 2022 |
|---|---|---|---|---|---|---|
| Density | ||||||
| Population density (1,000 persons per square mile) | 82.6 | 88.5 | 95.4 | 90.1 | ||
| Development | ||||||
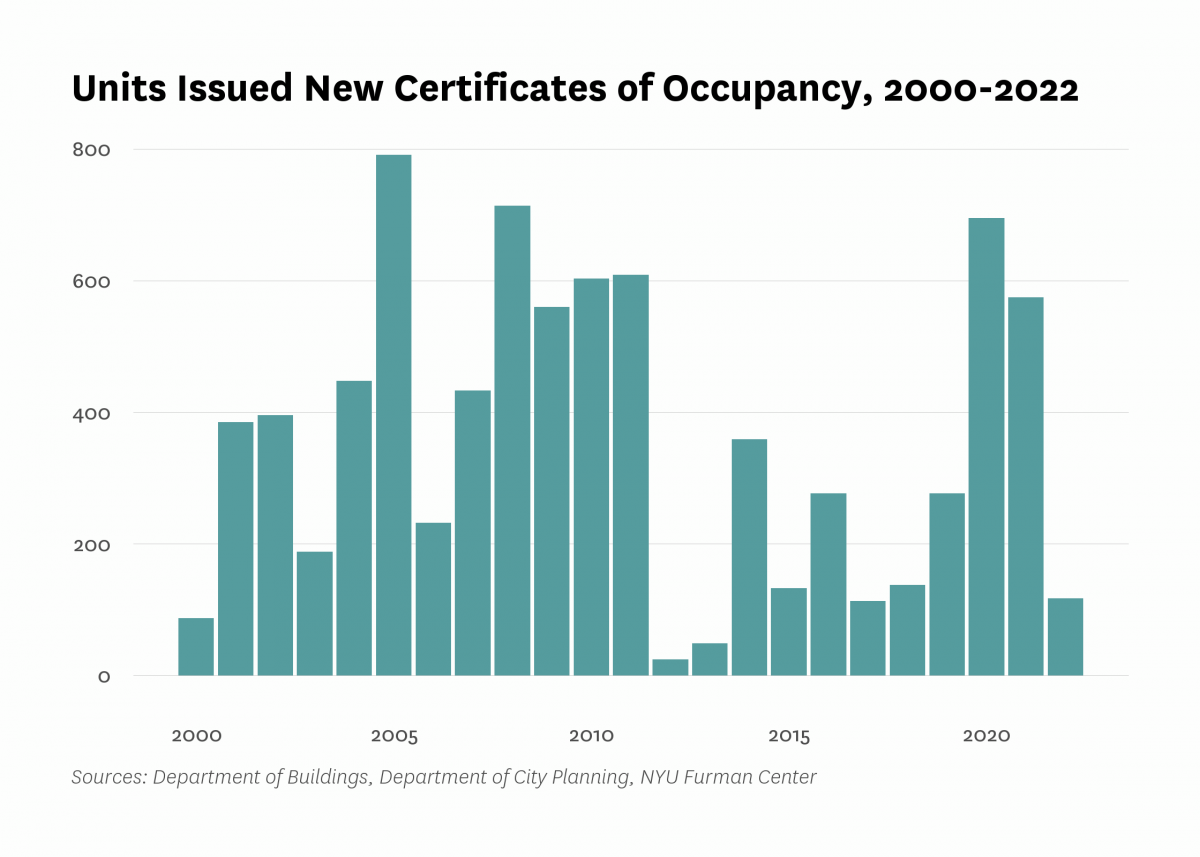
| Units authorized by new residential building permits | 261 | 0 | 77 | 495 | 252 | 542 |
| Units issued new certificates of occupancy | 87 | 232 | 603 | 277 | 575 | 117 |
| Indicator | 2000 | 2006 | 2010 | 2019 | 2021 | 2022 |
|---|---|---|---|---|---|---|
| Commute | ||||||
| Car-free commute (% of commuters) | 81.7% | 83.8% | 85.0% | 88.0% | 85.7% | |
| Mean travel time to work (minutes) | 37.3 | 35.5 | 34.7 | 36.1 | 38.1 | |
| Crime and Incarceration | ||||||
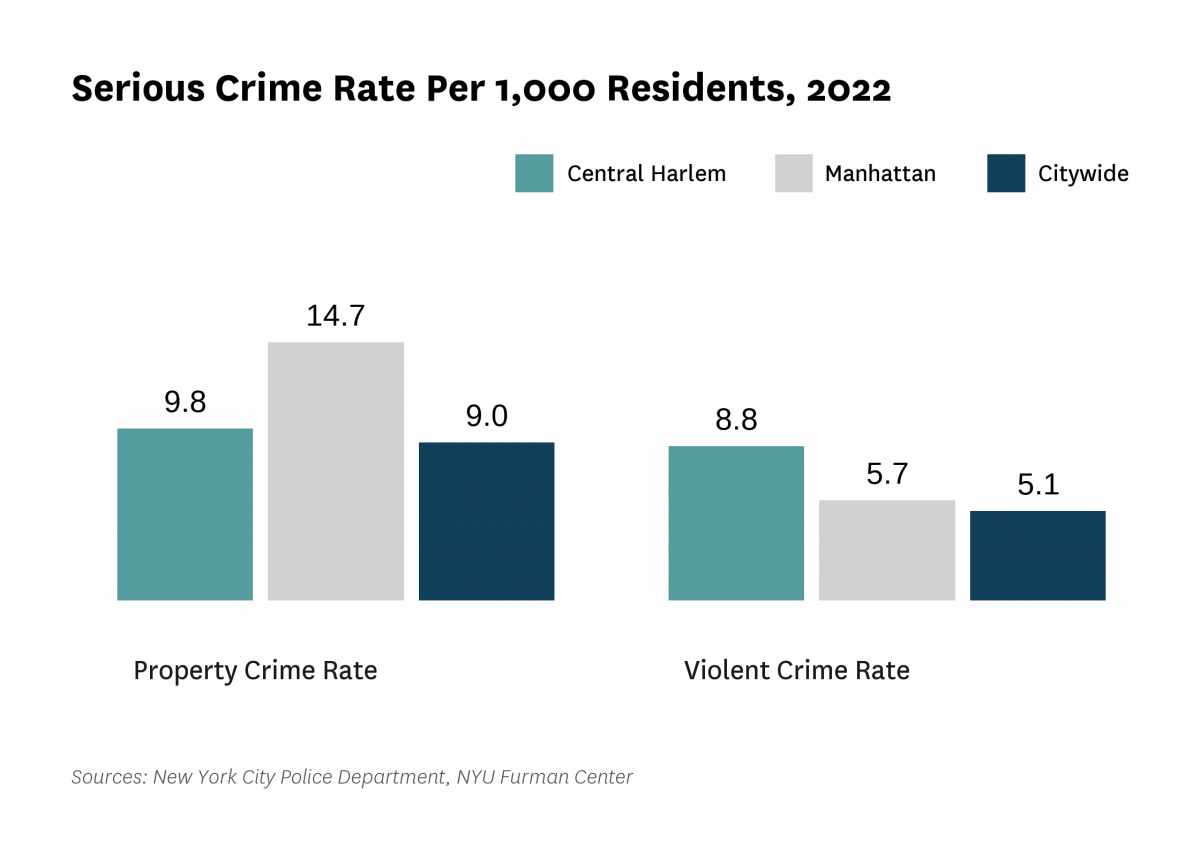
| Serious crime rate (per 1,000 residents) | 22.7 | 17.2 | 16.8 | 17.7 | 18.6 | |
| Serious crime rate, property (per 1,000 residents) | 11.1 | 7.9 | 7.9 | 8.9 | 9.8 | |
| Serious crime rate, violent (per 1,000 residents) | 11.6 | 9.3 | 8.9 | 8.8 | 8.8 | |
| Schools | ||||||
| Students performing at grade level in English language arts, 4th grade | 28.6% | 18.4% | ||||
| Students performing at grade level in math, 4th grade | 22.8% | 15.8% | ||||
| Indicator | 2000 | 2006 | 2010 | 2019 | 2021 | 2022 |
|---|---|---|---|---|---|---|
| Median Rent | ||||||
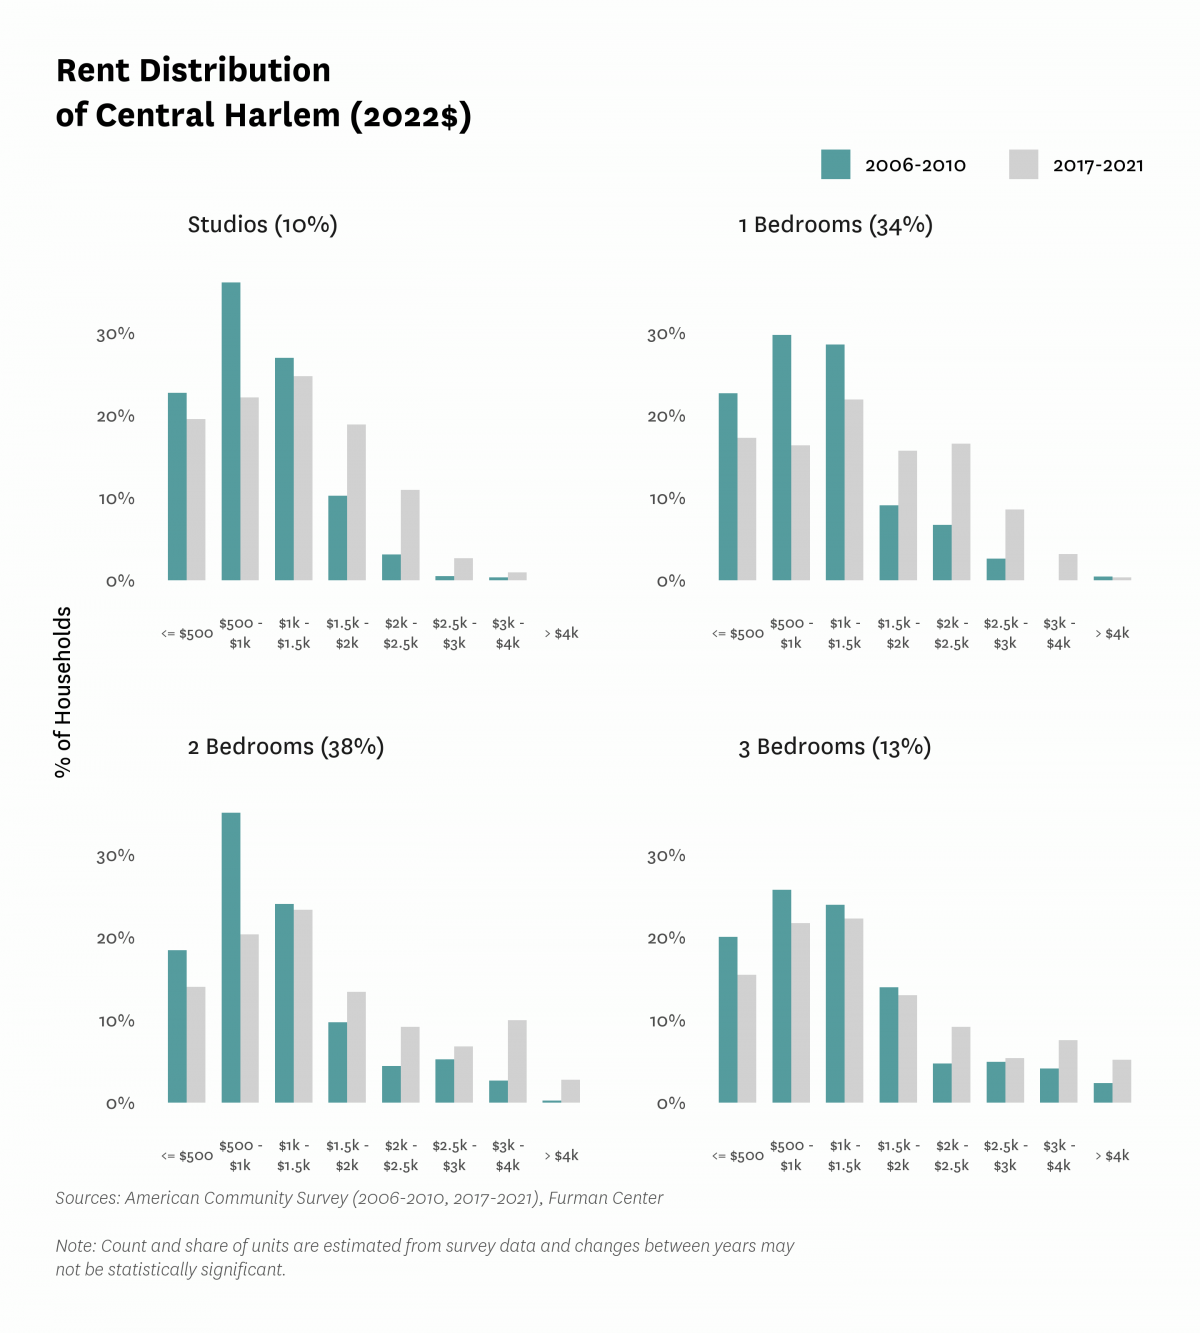
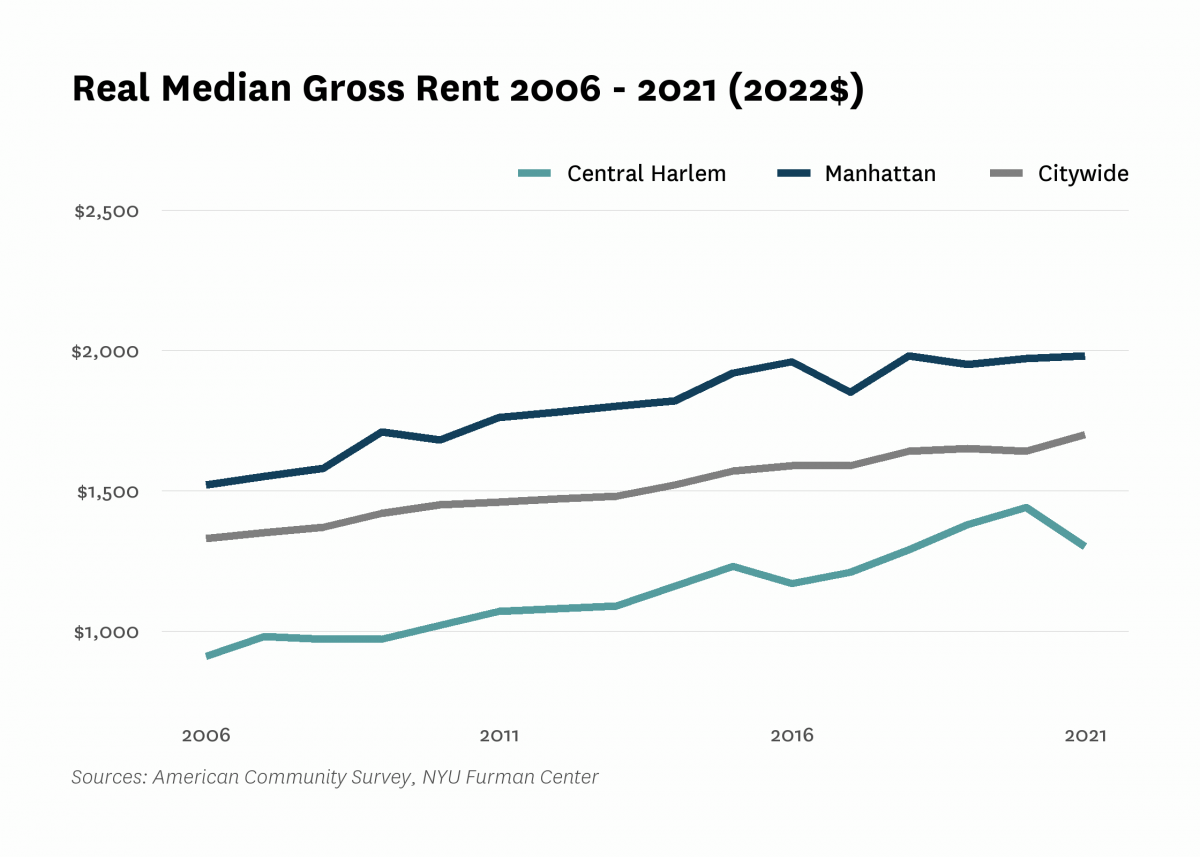
| Median rent, 2- and 3-bedrooms (2022$) | $990 | $1,220 | $1,300 | |||
| Median rent, all (2022$) | $830 | $910 | $1,020 | $1,380 | $1,300 | |
| Median rent, recent movers (2022$) | $1,260 | $2,050 | $2,140 | |||
| Median rent, studios and 1-bedrooms (2022$) | $950 | $1,150 | $1,290 | |||
| Change in collected rent (2019-2020) | 1.4% | |||||
| Affordability | ||||||
| Rental units affordable at 30% AMI (% of recently available units) | 19.3% | 18.5% | 10.8% | |||
| Rental units affordable at 80% AMI (% of recently available units) | 59.2% | 41.0% | 42.3% | |||
| Rental units affordable at 120% AMI (% of recently available units) | 86.9% | 87.5% | 86.3% | |||
| Rent Burden | ||||||
| Moderately rent-burdened households | 24.8% | 26.4% | 18.9% | 25.0% | ||
| Moderately rent-burdened households, low income | 29.4% | 31.5% | 30.2% | |||
| Moderately rent-burdened households, moderate income | 15.6% | 23.2% | 17.3% | |||
| Severely rent-burdened households | 24.1% | 24.1% | 23.7% | 25.1% | ||
| Severely rent-burdened households, low income | 34.0% | 33.7% | 36.5% | |||
| Severely rent-burdened households, moderate income | 4.5% | 1.1% | 1.9% | |||
| Rental Subsidy | ||||||
| Housing choice vouchers (% of occupied, privately owned rental units) | 7.6% | 7.1% | ||||
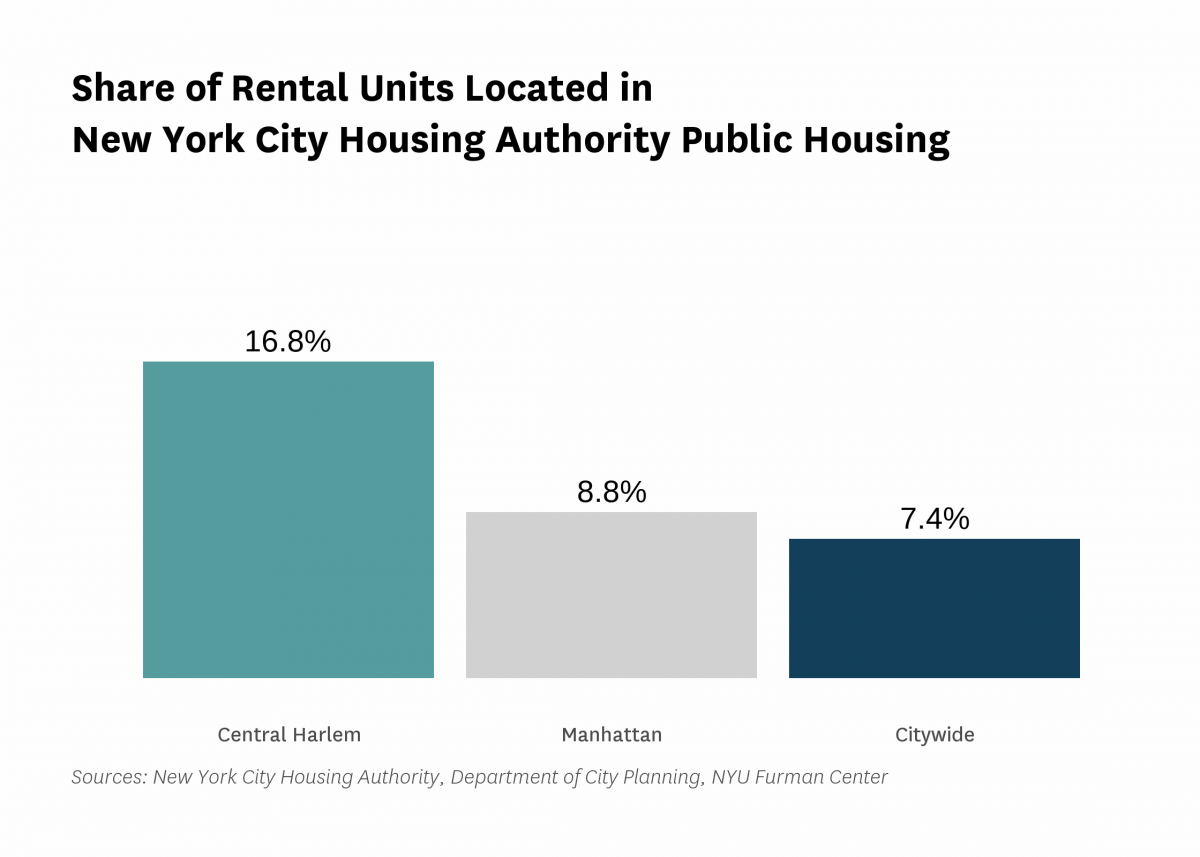
| Public housing (% of rental units) | 16.8% | |||||
Data Notes: See CoreData User Guide for more information about indicator definitions and methods.
Indicators: The rental vacancy rate, severe crowding rate, and the severely rent-burdened households indicators use five-year American Community Survey (ACS) estimates. Data under the 2010 heading comes from the 2006 – 2010 ACS, data under the 2019 heading comes from the 2015 – 2019 ACS and data under the 2021 heading comes from 2017 – 2021 ACS .
All content © 2005 – 2024 Furman Center for Real Estate and Urban Policy | Top of page | Contact Us