| Indicator | 2000 | 2006 | 2010 | 2019 | 2021 | 2022 |
|---|---|---|---|---|---|---|
| Population | ||||||
| Born in New York State | 44.3% | 43.8% | 40.4% | 42.7% | ||
| Disabled population | 6.5% | 7.9% | 6.7% | |||
| Foreign-born population | 48.7% | 50.2% | 49.4% | 52.0% | 51.0% | |
| Population | 143,120 | 138,679 | 135,589 | 143,756 | 143,841 | |
| Population aged 65+ | 9.4% | 8.9% | 8.6% | 12.5% | 14.9% | |
| Households | ||||||
| Households with children under 18 years old | 43.1% | 41.3% | 37.9% | 32.7% | 30.9% | |
| Single-person households | 20.2% | 21.9% | 18.1% | 21.8% | ||
| Race and Ethnicity | ||||||
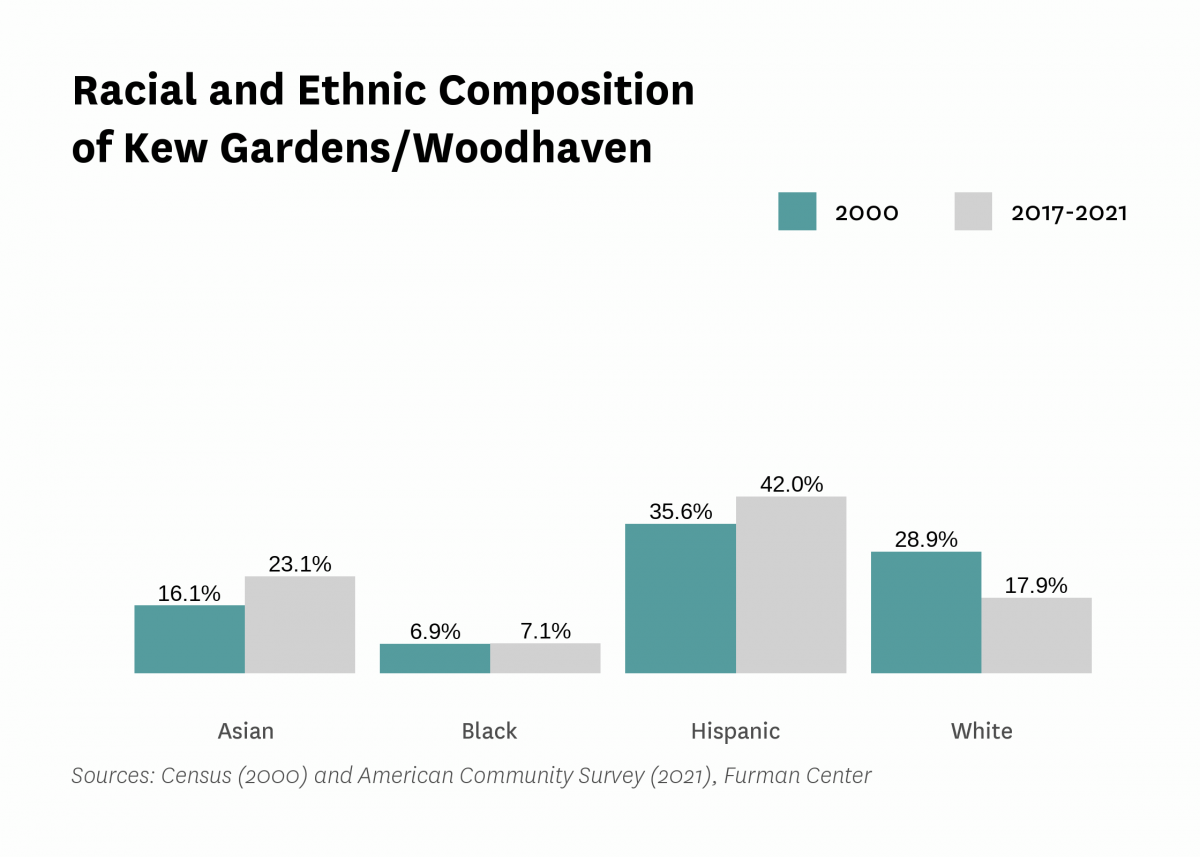
| Percent Asian | 16.1% | 20.0% | 22.8% | 27.6% | 23.1% | |
| Percent Black | 6.9% | 9.1% | 9.4% | 7.0% | 7.1% | |
| Percent Hispanic | 35.6% | 38.3% | 41.1% | 39.4% | 42.0% | |
| Percent white | 28.9% | 25.8% | 18.6% | 16.8% | 17.9% | |
| Racial diversity index | 0.76 | 0.74 | 0.74 | 0.74 | 0.73 | |
| Income and Poverty | ||||||
| Income diversity ratio | 4.5 | 4.3 | 4.7 | 4.7 | ||
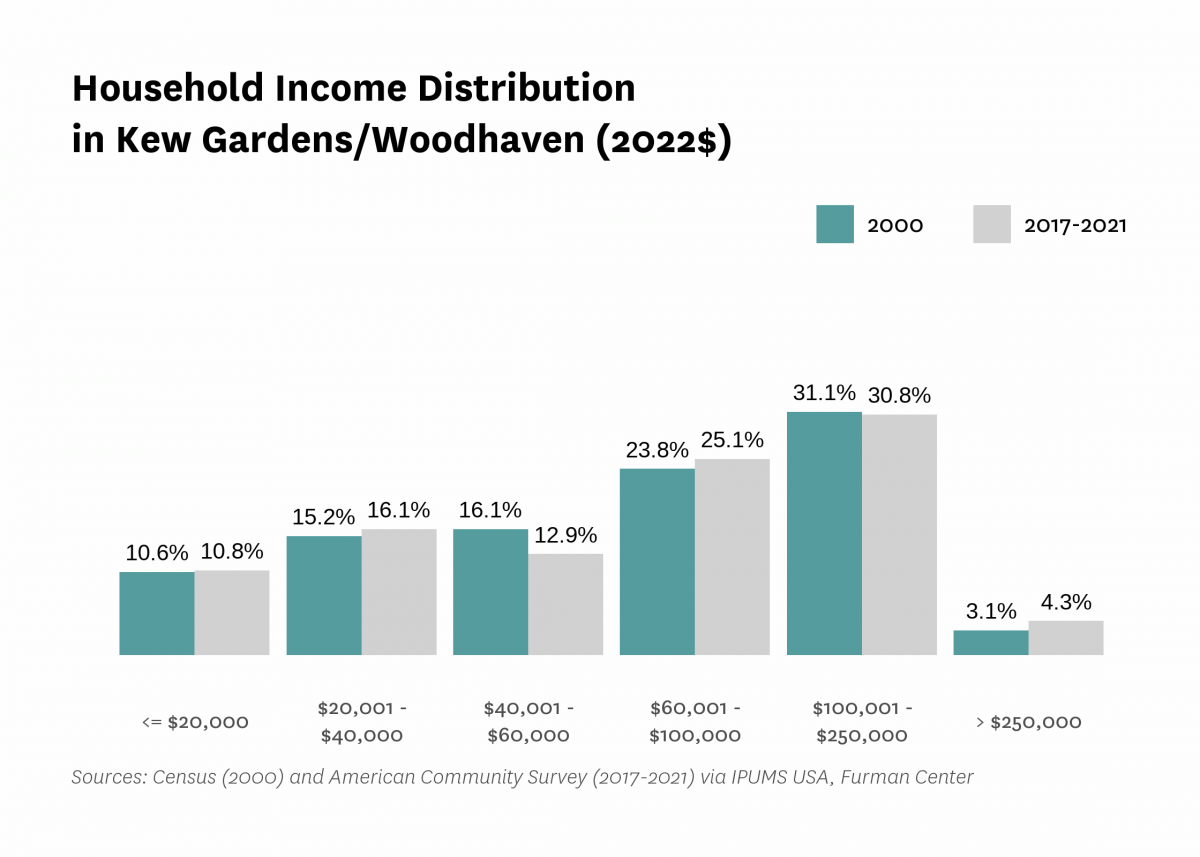
| Median household income (2022$) | $75,610 | $74,090 | $73,590 | $85,830 | $79,800 | |
| Median household income, homeowners (2022$) | $102,250 | $98,700 | $105,000 | $100,560 | ||
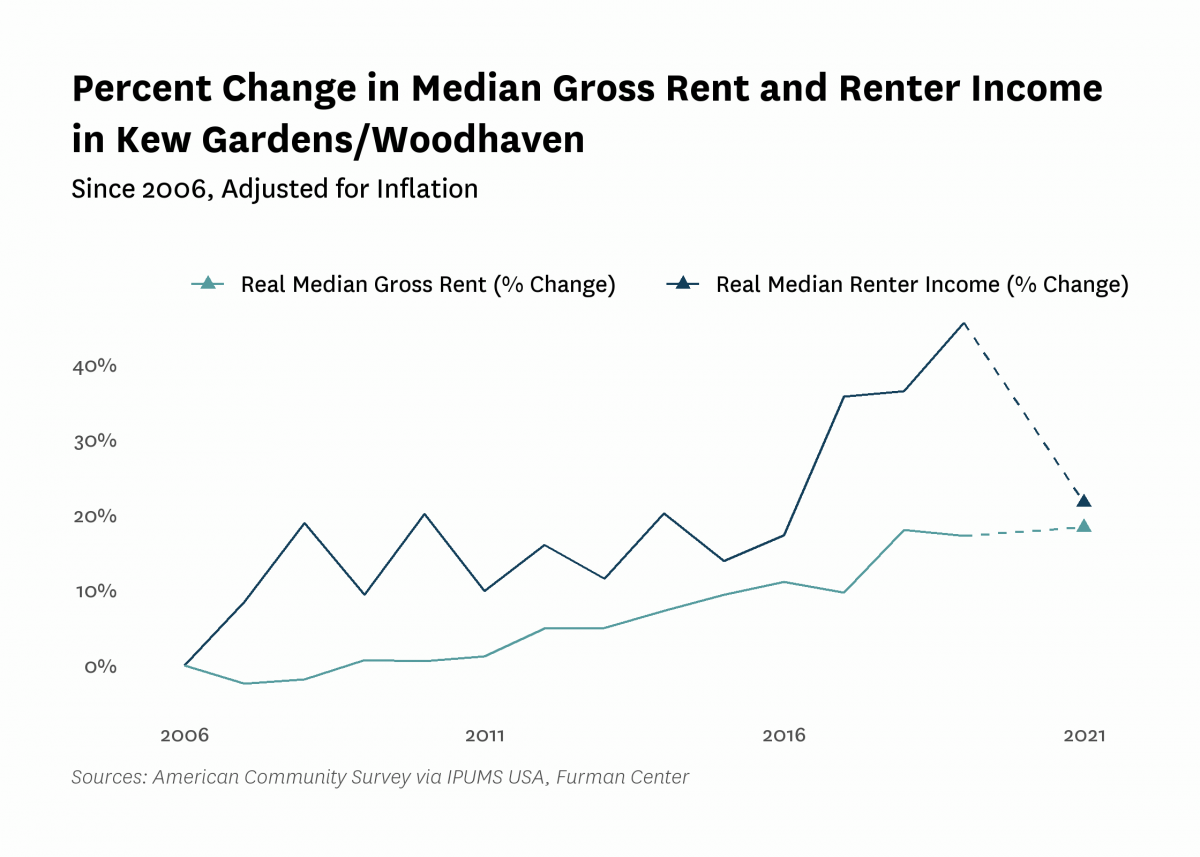
| Median household income, renters (2022$) | $49,890 | $59,970 | $72,650 | $60,720 | ||
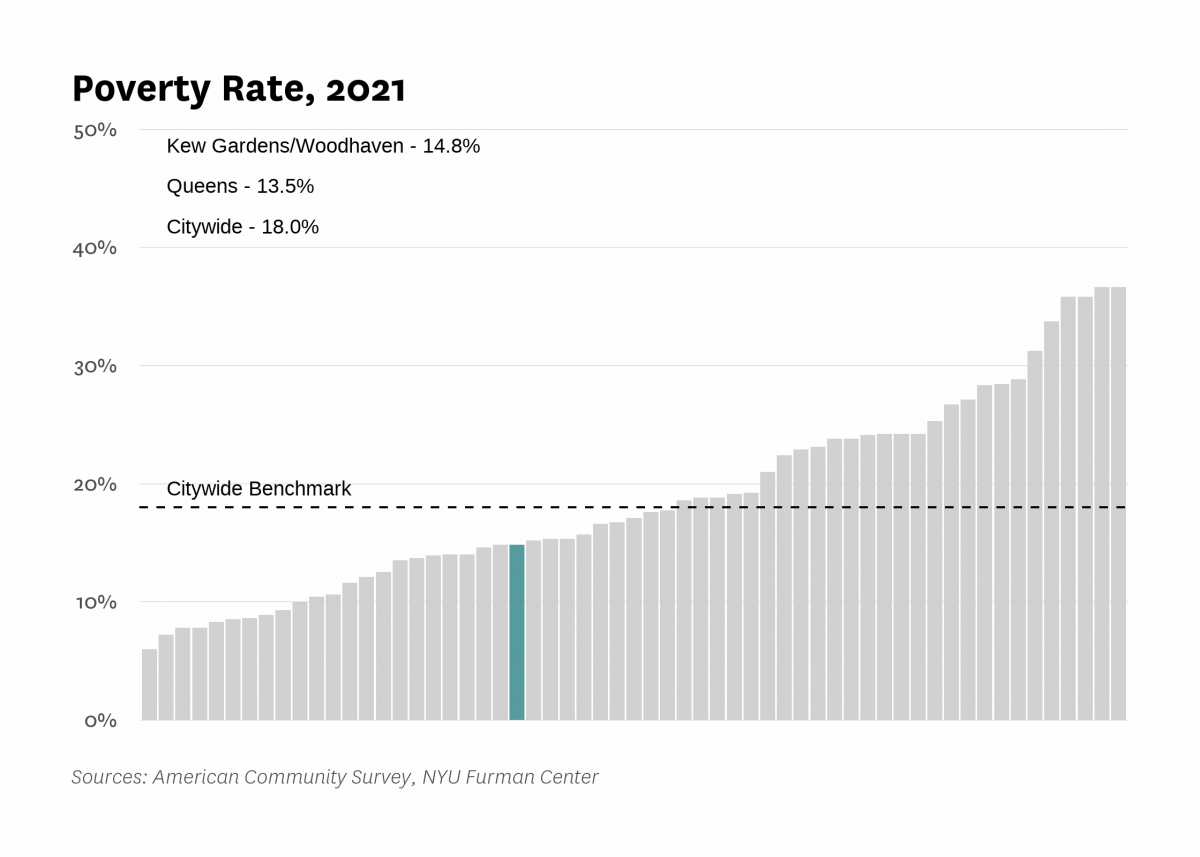
| Poverty rate | 14.7% | 14.2% | 13.1% | 10.1% | 14.8% | |
| Poverty rate, population aged 65+ | 13.1% | 8.5% | 10.3% | 10.9% | ||
| Poverty rate, population under 18 years old | 20.6% | 19.7% | 11.5% | 20.7% | ||
| Labor Market | ||||||
| Labor force participation rate | 66.2% | 68.4% | 64.2% | 62.7% | ||
| Population aged 25+ without a high school diploma | 21.4% | 18.6% | 19.8% | 22.8% | ||
| Unemployment rate | 8.23% | 7.59% | 13.27% | 5.20% | 11.13% | |
| Indicator | 2000 | 2006 | 2010 | 2019 | 2021 | 2022 |
|---|---|---|---|---|---|---|
| Housing Stock | ||||||
| Homeownership rate | 41.6% | 46.7% | 43.3% | 48.2% | 49.8% | |
| Housing units | 47,135 | 48,066 | 46,788 | 47,285 | ||
| Rental vacancy rate | 4.3% | 2.7% | 3.0% | |||
| Serious housing code violations (per 1,000 privately owned rental units) | 21.5 | 32.6 | 41.3 | 44.3 | 68.8 | |
| Severe crowding rate (% of renter households) | 2.7% | 4.1% | 4.2% | |||
| Total housing code violations (per 1,000 privately owned rental units) | 129.2 | 147.9 | 172.2 | 206.3 | 268.5 | |
| Finance - Distress | ||||||
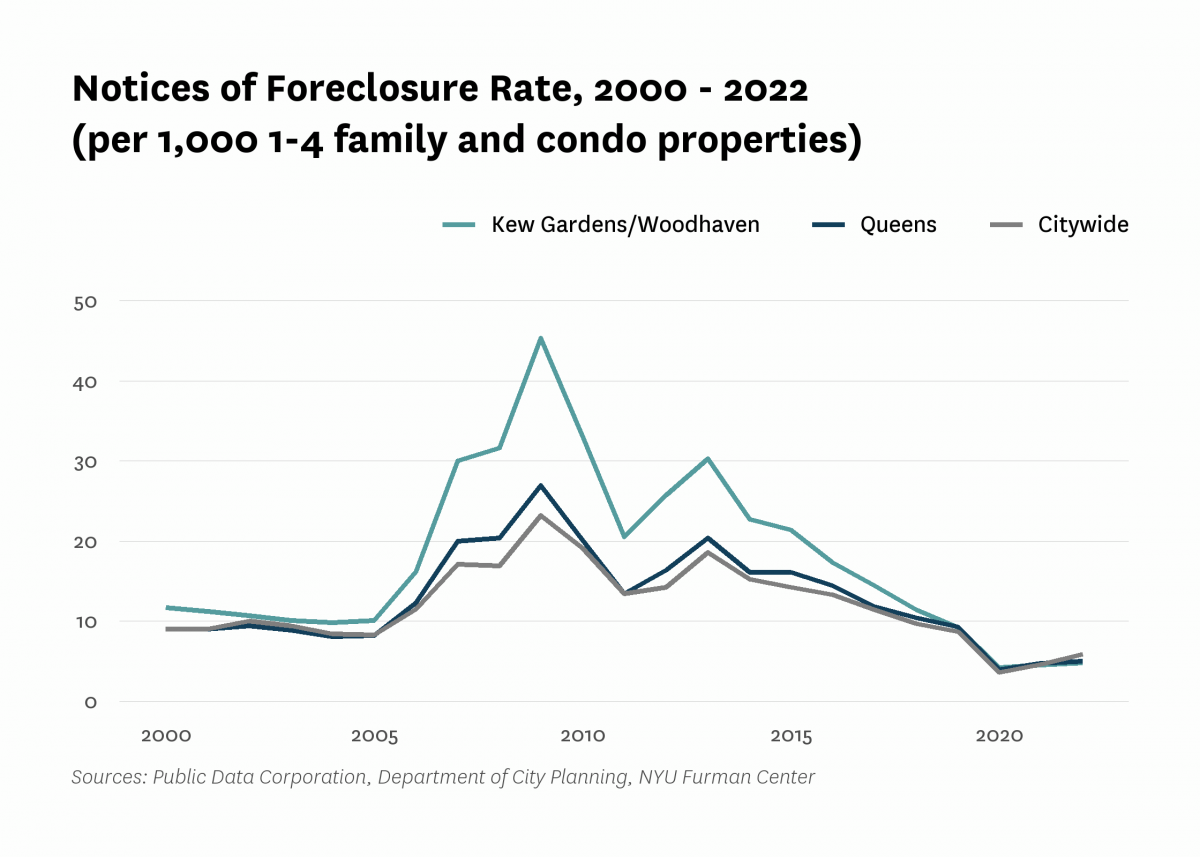
| Notices of foreclosure rate (per 1,000 1-4 family and condo properties) | 11.7 | 16.2 | 33.1 | 9.2 | 4.5 | 4.8 |
| Notices of foreclosure, all residential properties | 207 | 294 | 628 | 174 | 87 | 95 |
| Notices of foreclosure, initial, 1-4 family and condo properties | 169 | 250 | 479 | 72 | 19 | 38 |
| Notices of foreclosure, repeat, 1-4 family and condo properties | 36 | 39 | 121 | 95 | 63 | 50 |
| Pre-foreclosure notice rate (per 1,000 1-4 family and condo properties) | 53.6 | 25.8 | 52.5 | |||
| Pre-foreclosure notices, 1-4 family and condo properties | 978 | 471 | 959 | |||
| Properties entering REO, 1-4 family | 43 | 12 | 65 | |||
| Finance - Lending | ||||||
| FHA/VA-backed home purchase loans (% of home purchase loans) | 0.5% | 40.3% | 15.6% | 14.6% | ||
| Higher-cost home purchase loans (% of home purchase loans) | 37.3% | 1.0% | 9.1% | 5.9% | ||
| Higher-cost refinance loans (% of refinance loans) | 32.6% | 1.5% | 5.2% | 0.7% | ||
| Home purchase loan rate (per 1,000 properties) | 65.6 | 22.9 | 23.5 | 27.6 | ||
| Home purchase loans in LMI tracts (% of home purchase loans) | 17.5% | 18.9% | 14.9% | 12.3% | ||
| Home purchase loans to LMI borrowers (% of home purchase loans) | 4.0% | 13.1% | 10.5% | 14.9% | ||
| Refinance loan rate (per 1,000 properties) | 70.6 | 17.8 | 18.4 | 44.1 | ||
| Sales - Volume | ||||||
| Sales volume, 1 family building | 458 | 559 | 187 | 177 | 202 | 229 |
| Sales volume, 2-4 family building | 601 | 825 | 355 | 227 | 242 | 353 |
| Sales volume, 5+ family building | 13 | 22 | 3 | 12 | 9 | 9 |
| Sales volume, condominium | 12 | 84 | 28 | 27 | 30 | 42 |
| Sales volume, all property types | 1,084 | 1,490 | 573 | 443 | 483 | 633 |
| Sales - Median Prices | ||||||
| Median sales price per unit, 1 family building (2022$) | $333,080 | $646,420 | $431,350 | $657,820 | $677,460 | $672,000 |
| Median sales price per unit, 2-4 family building (2022$) | $208,180 | $411,740 | $241,430 | $404,170 | $428,040 | $410,000 |
| Median sales price per unit, 5+ family building (2022$) | $101,960 | $185,490 | $119,100 | $181,260 | $182,500 | $167,860 |
| Median sales price per unit, condominium (2022$) | $172,320 | $554,380 | $416,360 | $444,870 | $453,590 | $482,000 |
| Sales - Housing Price Index | ||||||
| Index of housing price appreciation, 1 family building | 100.0 | 226.3 | 155.8 | 288.3 | 307.3 | 321.3 |
| Index of housing price appreciation, 2-4 family building | 100.0 | 237.3 | 155.0 | 310.0 | 330.9 | 335.7 |
| Index of housing price appreciation, 5+ family building | 100.0 | 250.5 | 162.5 | 303.5 | 460.3 | 297.9 |
| Index of housing price appreciation, condominium | 100.0 | 265.3 | 230.9 | 372.7 | 352.0 | 352.5 |
| Index of housing price appreciation, all property types | 100.0 | 232.5 | 156.3 | 300.9 | 318.2 | 327.5 |
| Subsidized Housing | ||||||
| Total number of subsidized properties (properties) | 10 | |||||
| HUD Financing or Insurance (properties) | 2 | |||||
| HUD Financing or Insurance (units) | 65 | |||||
| HUD Project-based Rental Assistance Program (properties) | 0 | |||||
| HUD Project-based Rental Assistance Program (units) | 0 | |||||
| Low Income Housing Tax Credit (properties) | 2 | |||||
| Low Income Housing Tax Credit (units) | 143 | |||||
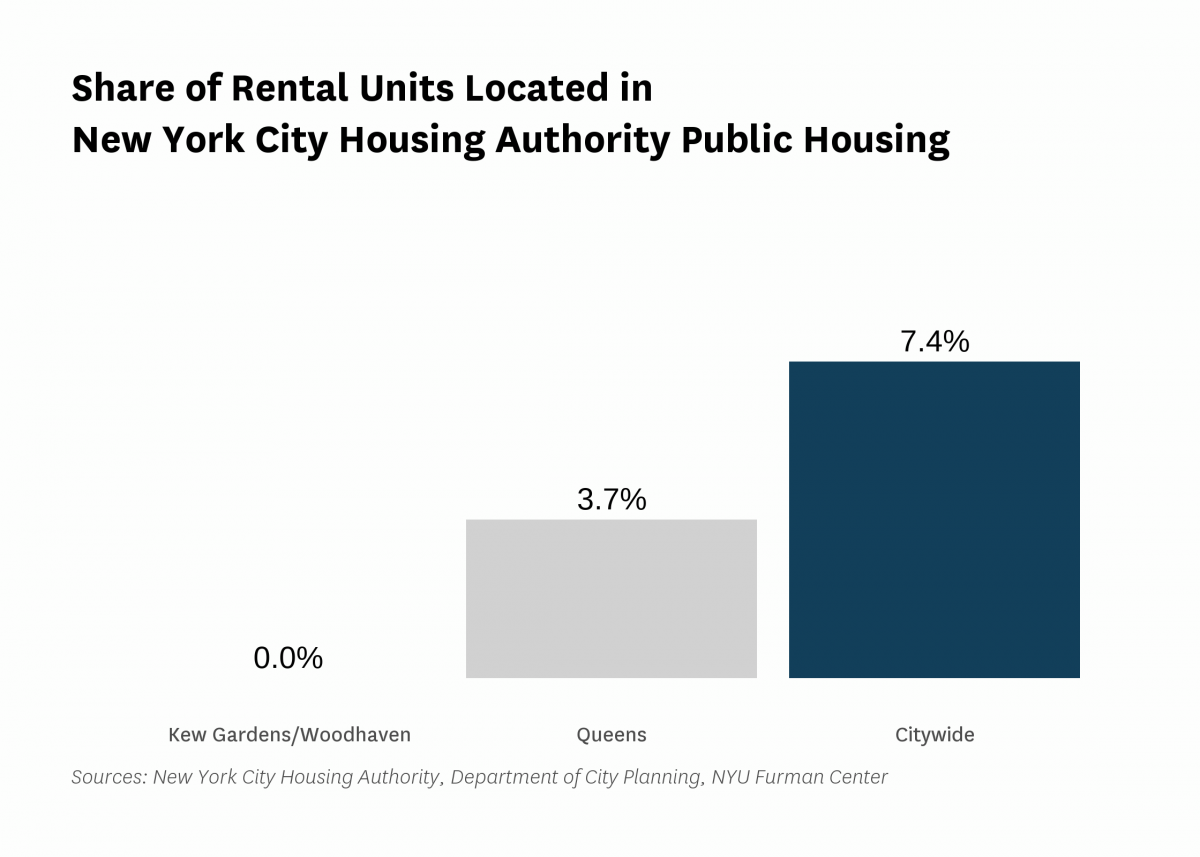
| Public Housing (properties) | 0 | |||||
| Public Housing (units) | 0 | |||||
| Mitchell-Lama (properties) | 0 | |||||
| Mitchell-Lama (units) | 0 | |||||
| 421-a Tax Exemption (properties) | 16 | |||||
| 421-a Tax Exemption (units) | 365 | |||||
| 420-c Tax Exemption (properties) | 2 | |||||
| 420-c Tax Exemption (units) | 182 | |||||
| NYC Housing Production Programs and Zoning Incentives or Requirements (properties) | 4 | |||||
| Eligible to expire from housing programs between 2023 and 2028 (properties) | 0 | |||||
| Eligible to expire from housing programs between 2023 and 2028 (units) | 0 | |||||
| Eligible to expire from housing programs between 2029 and 2038 (properties) | 1 | |||||
| Eligible to expire from housing programs between 2029 and 2038 (units) | 26 | |||||
| Eligible to expire from housing programs in 2039 and later (properties) | 3 | |||||
| Eligible to expire from housing programs in 2039 and later (units) | 182 | |||||
| Indicator | 2000 | 2006 | 2010 | 2019 | 2021 | 2022 |
|---|---|---|---|---|---|---|
| Density | ||||||
| Population density (1,000 persons per square mile) | 29.2 | 28.6 | 30.3 | 30.3 | ||
| Development | ||||||
| Units authorized by new residential building permits | 64 | 0 | 5 | 48 | 142 | 125 |
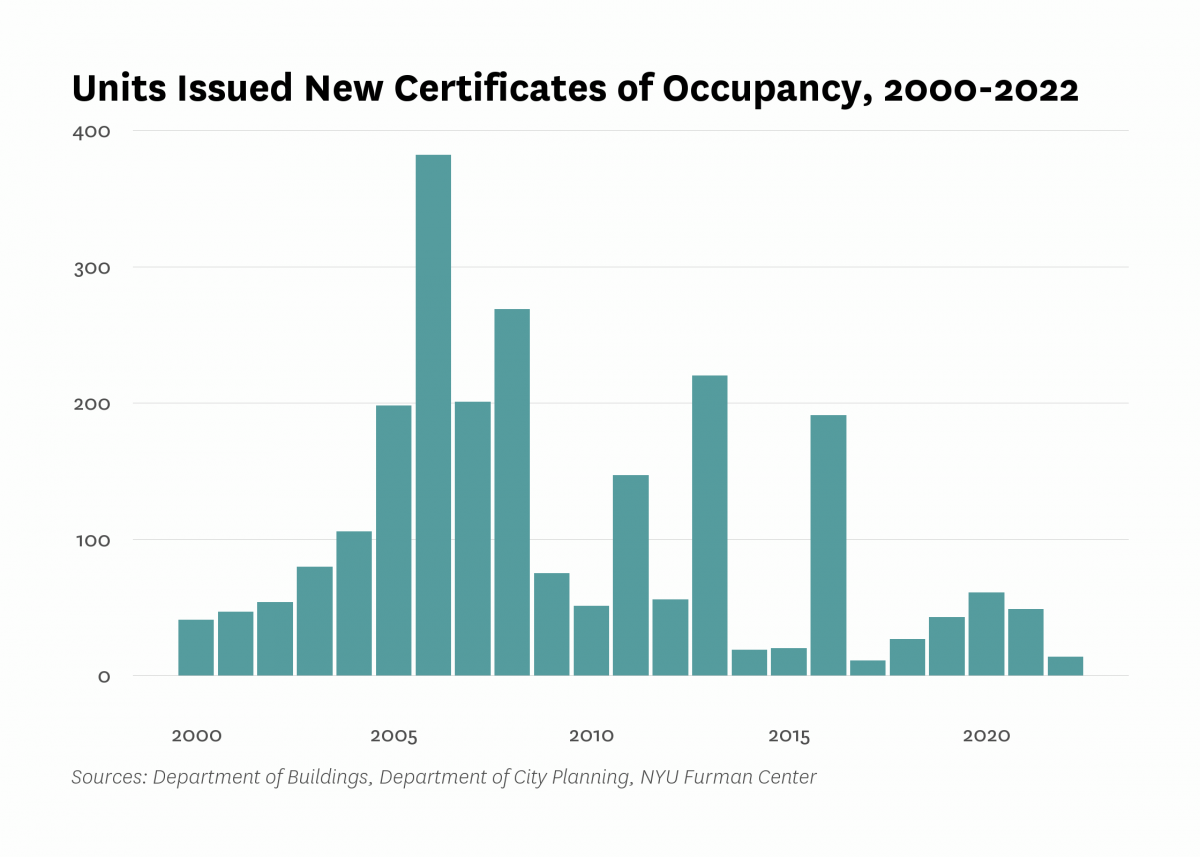
| Units issued new certificates of occupancy | 41 | 382 | 51 | 43 | 49 | 14 |
| Indicator | 2000 | 2006 | 2010 | 2019 | 2021 | 2022 |
|---|---|---|---|---|---|---|
| Commute | ||||||
| Car-free commute (% of commuters) | 55.9% | 62.3% | 60.6% | 59.6% | 54.9% | |
| Mean travel time to work (minutes) | 44.4 | 42.7 | 44.4 | 46.6 | 42.0 | |
| Crime and Incarceration | ||||||
| Serious crime rate (per 1,000 residents) | 12.1 | 10.5 | 4.7 | 6.8 | 8.9 | |
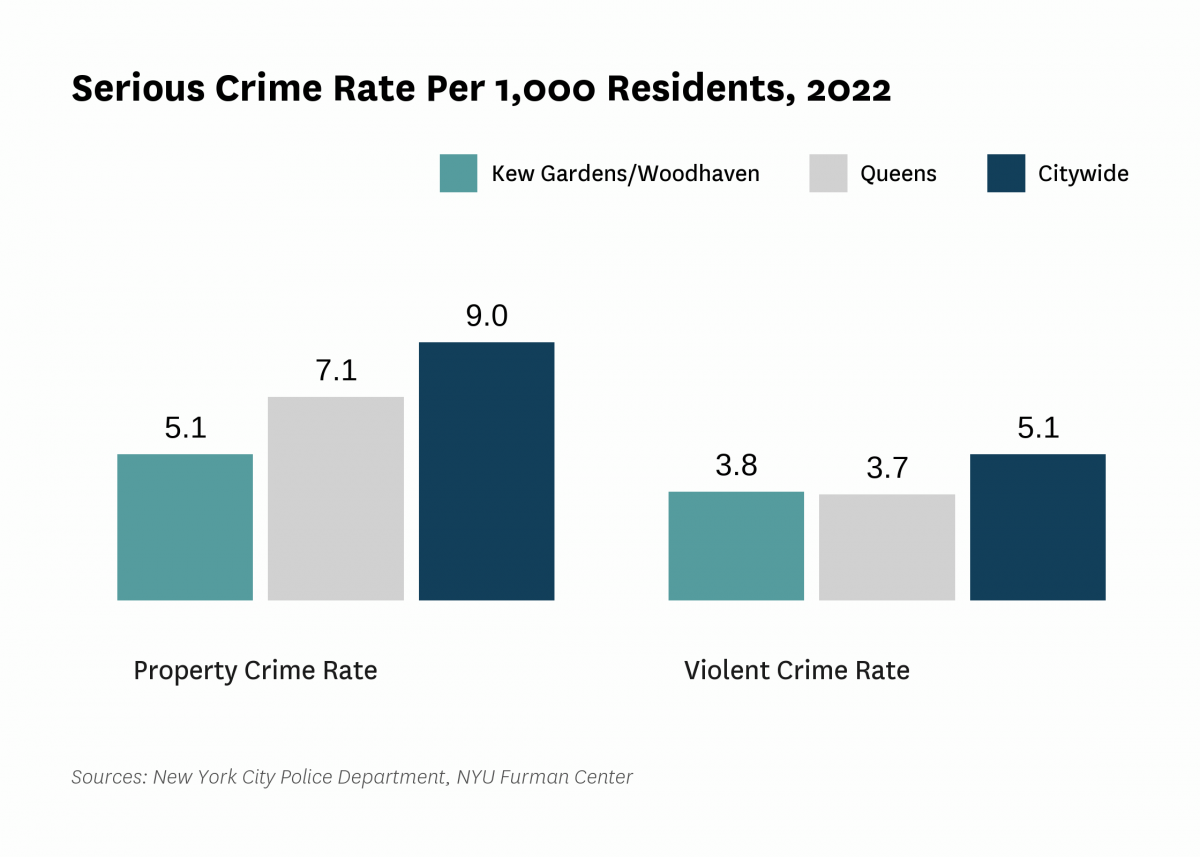
| Serious crime rate, property (per 1,000 residents) | 8.3 | 6.9 | 2.6 | 4.3 | 5.1 | |
| Serious crime rate, violent (per 1,000 residents) | 3.8 | 3.6 | 2.1 | 2.5 | 3.8 | |
| Schools | ||||||
| Students performing at grade level in English language arts, 4th grade | 55.5% | 42.7% | ||||
| Students performing at grade level in math, 4th grade | 56.5% | 43.8% | ||||
| Indicator | 2000 | 2006 | 2010 | 2019 | 2021 | 2022 |
|---|---|---|---|---|---|---|
| Median Rent | ||||||
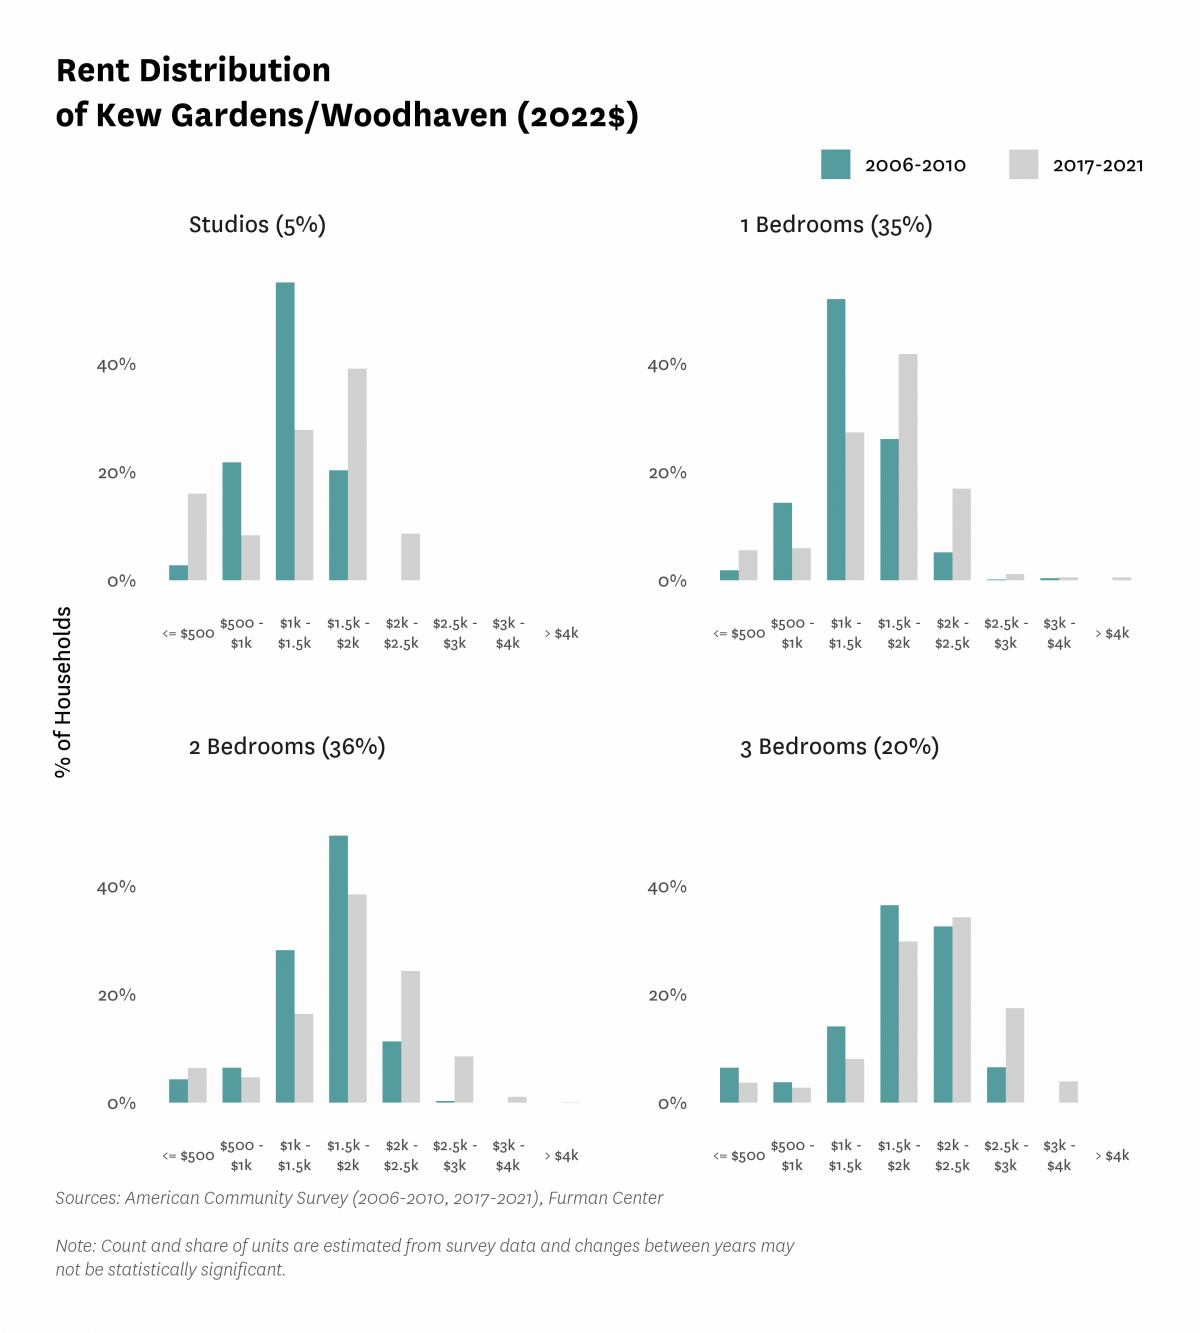
| Median rent, 2- and 3-bedrooms (2022$) | $1,710 | $1,810 | $1,930 | |||
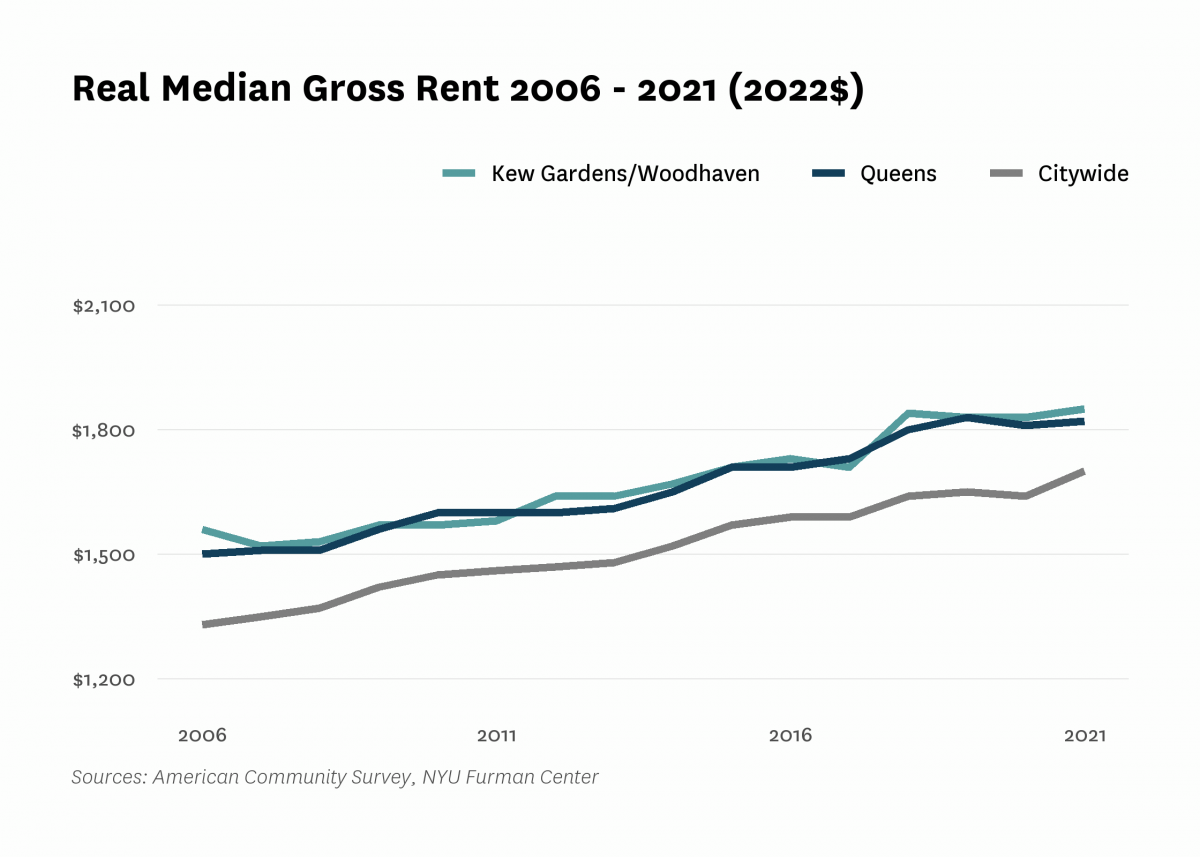
| Median rent, all (2022$) | $1,350 | $1,560 | $1,570 | $1,830 | $1,850 | |
| Median rent, recent movers (2022$) | $1,670 | $1,900 | $2,120 | |||
| Median rent, studios and 1-bedrooms (2022$) | $1,340 | $1,520 | $1,640 | |||
| Change in collected rent (2019-2020) | 2.0% | |||||
| Affordability | ||||||
| Rental units affordable at 30% AMI (% of recently available units) | 3.6% | 2.4% | 2.7% | |||
| Rental units affordable at 80% AMI (% of recently available units) | 64.7% | 65.7% | 57.8% | |||
| Rental units affordable at 120% AMI (% of recently available units) | 100.0% | 99.6% | 98.2% | |||
| Rent Burden | ||||||
| Moderately rent-burdened households | 20.6% | 27.1% | 25.6% | 23.6% | ||
| Moderately rent-burdened households, low income | 37.0% | 34.9% | 36.9% | |||
| Moderately rent-burdened households, moderate income | 7.6% | 8.3% | 9.1% | |||
| Severely rent-burdened households | 25.7% | 29.7% | 30.2% | 28.5% | ||
| Severely rent-burdened households, low income | 47.6% | 48.0% | 43.1% | |||
| Severely rent-burdened households, moderate income | 0.7% | 0.0% | 0.0% | |||
| Rental Subsidy | ||||||
| Housing choice vouchers (% of occupied, privately owned rental units) | 4.7% | 3.6% | ||||
| Public housing (% of rental units) | 0.0% | |||||

Data Notes: See CoreData User Guide for more information about indicator definitions and methods.
Indicators: The rental vacancy rate, severe crowding rate, and the severely rent-burdened households indicators use five-year American Community Survey (ACS) estimates. Data under the 2010 heading comes from the 2006 – 2010 ACS, data under the 2019 heading comes from the 2015 – 2019 ACS and data under the 2021 heading comes from 2017 – 2021 ACS .
All content © 2005 – 2024 Furman Center for Real Estate and Urban Policy | Top of page | Contact Us