State of the City 2021
During 2021, New York City’s renters continued to experience the impacts of the global pandemic and subsequent economic shutdown. With various eviction moratoria in place at the beginning of the year, overall eviction filing rates remained well below pre-pandemic averages. This was the case throughout 2021, although rates did slowly rise and then plateau through the end of the year. The number of housing code violations rose to the highest count since 2007, but this is more likely due to City inspectors catching up from activity that would have happened in 2020. This year’s Census is limited and does not offer reliable insights into most trends that would normally be available at this time.* The pre-pandemic context is that New York City experienced a long period in which the median rent grew more than the median renter income, although the gap had begun to diminish between 2014 and 2019.
*In 2020, the Census Bureau limited the release of the ACS 1-year data to experimental estimates rather than the standard data products. Due to these restrictions, we do not report on the 2020 ACS 1-year data in the figures below which rely on ACS 1-year data, but instead maintain our figures from the previous year.
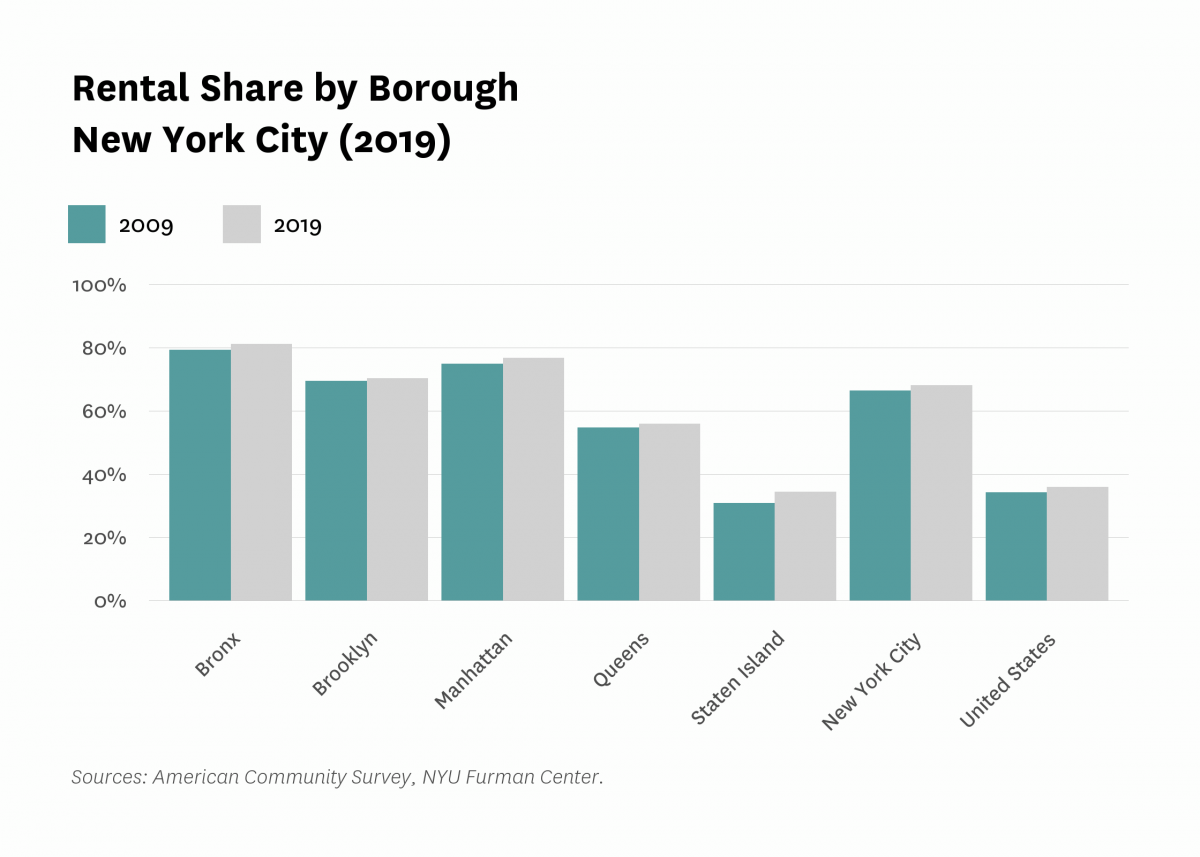
Comparing 2009 and 2019, the citywide share of households in rental housing increased at a similar level to the national trend.
The share of New York City households that live in rental units increased by 1.7 percentage points across all five boroughs between 2009 and 2019 (from 66.4% to 68.1%, respectively). This increase is consistent with a national increase of 1.8 percentage points (34.1% to 35.9%, respectively). The rental share increased in both the borough with the highest share of renters, the Bronx, where rental share increased from 79.3 percent in 2009 to 81.1 percent in 2019, as well as in the borough with the lowest share of renters, Staten Island, which saw the largest percentage point increase – from 30.8 percent to 34.3 percent. In 2019, 70.2 percent of Brooklyn households occupied rental units, compared to 76.7 percent in Manhattan, and 55.9 percent in Queens.
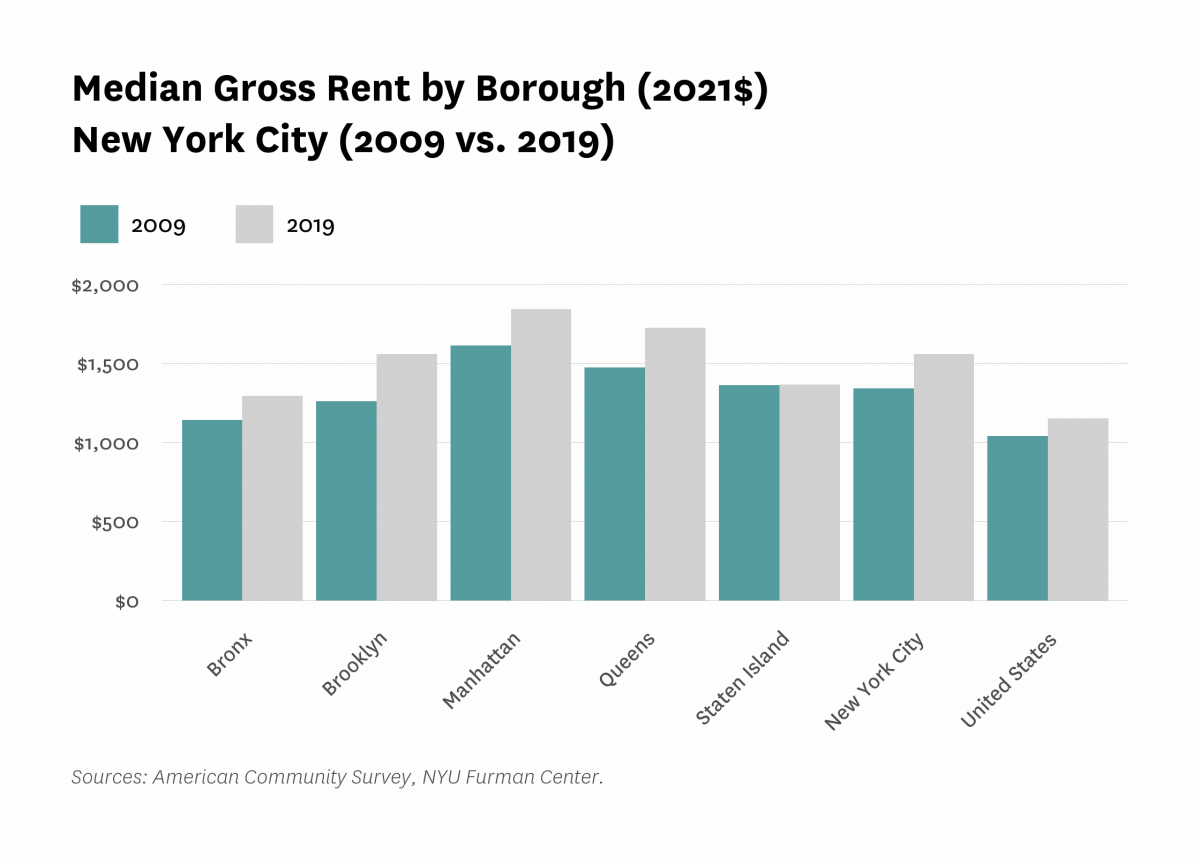
The increase in median gross rent between 2009 and 2019 was larger in New York City than the national median increase, with the largest increase in Brooklyn.
“Gross rent” is calculated as the legal rent charged on a lease prior to any concessions, plus estimated electricity and heating costs. Renters in New York City experienced median gross rent increases between 2009 and 2019 of 16.3 percent, outpacing the increase in the national median of 11.0 percent. The largest increase was in Brooklyn, where median gross rents increased by 23.7 percent ($298 per month, in 2021$) to a 2019 median monthly gross rent of $1,558. Staten Island, on the other hand, saw a minimal increase of 0.3 percent ($4 per month, in 2021$) to a 2019 median gross rent of $1,365. In 2019, median monthly gross rent was $1,294 in the Bronx, $1,842 in Manhattan, and $1,724 in Queens.
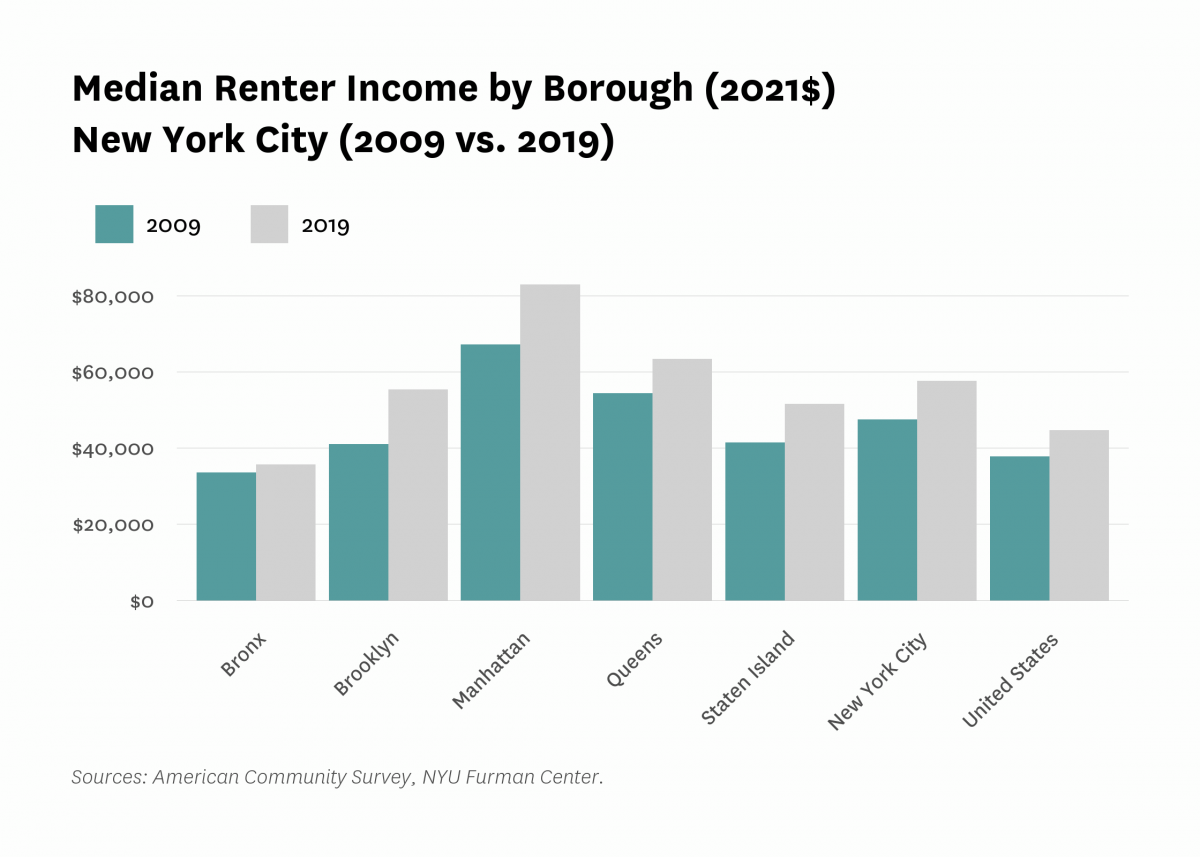
The median real renter household income increased across all boroughs between 2009 and 2019, with the largest increase in Manhattan and the smallest in the Bronx.
The median real income of New York City rental households (2021$) increased by 21.3 percent from 2009 to 2019, slightly higher than the 18.3 percent increase in the national median. However, increases were larger in some boroughs than others. In Manhattan, for example, the median real renter household income increased by 23.5 percent ($15,790 per year) to $82,955 in 2019, whereas Bronx renters saw an increase of 6.3 percent ($2,109 per year) to $35,630 over the same period. Median real renter household income rose to $55,400 in Brooklyn, $63,377 in Queens, and $51,494 in Staten Island in 2019. Nationally and locally, it is not possible to pinpoint a single reason that real renter income would be higher in 2019 than in 2009. For example, it could be that the composition of renters has shifted, with a larger share of higher income households more likely to rent than own. Alternatively, it could be the result of real household incomes increasing across all income levels, or some combination of these and other factors.
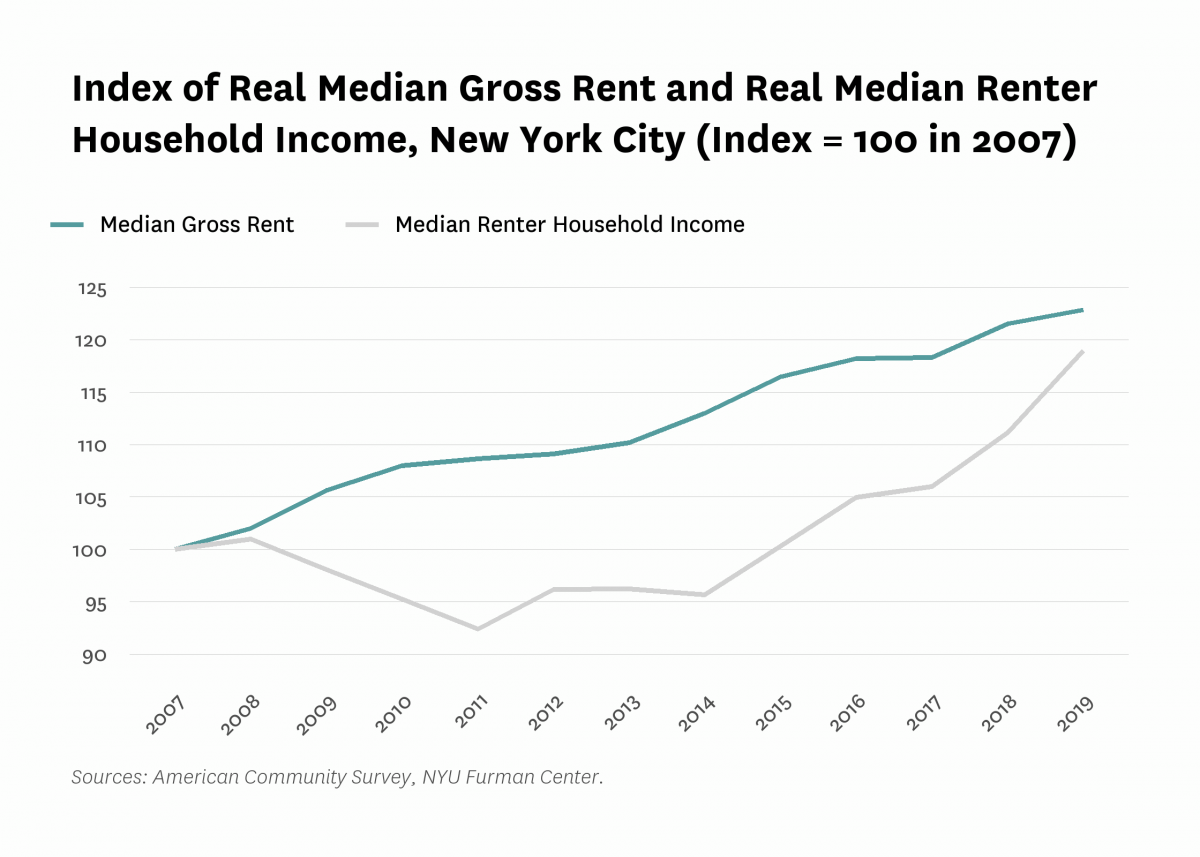
Median renter income grew faster than median gross rent in New York City between 2014 and 2019, narrowing the gap between income and housing expenses for renters.
Between 2014 and 2019, the real median renter household income increased from 96 percent to 119 percent of its 2007 level. Over the same period, real median gross rent increased from 113 percent to 123 percent of its 2007 level. The result is that, prior to 2020, the growth in median renter household income was closer to growth in median gross rent in 2019 when compared to just a few years prior, though it had not fully closed the gap in growth since 2007.
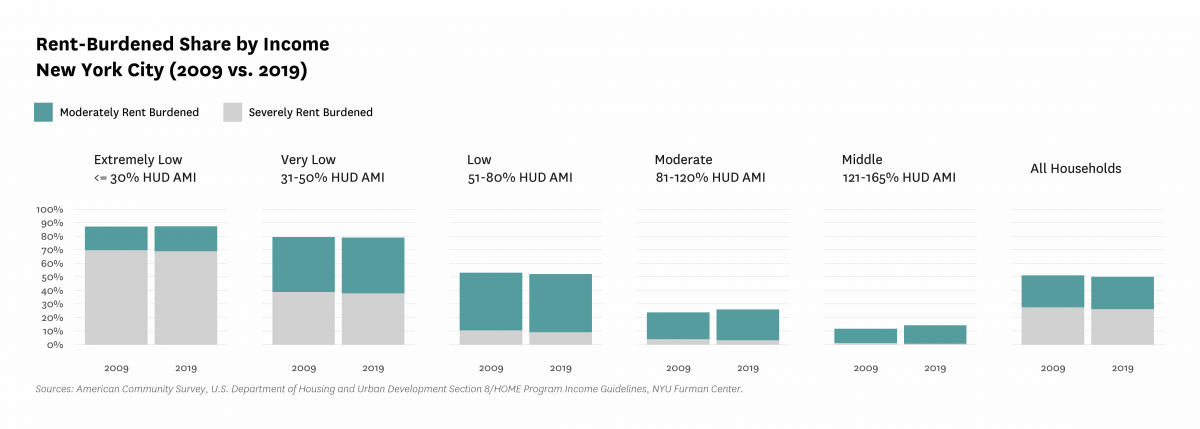
The share of New York City households that were rent burdened declined slightly between 2009 and 2019.
A household is considered “moderately rent burdened” if they spend thirty percent or more of their income on rent, and “severely rent burdened” if they spend fifty percent or more of their income on rent. Among all households in New York City, the overall rent-burdened share remained fairly consistent between 2009 and 2019, declining from 51.1 percent to 50.1 percent, respectively. The moderately rent burdened share increased by 0.5 percentage points (from 23.5 percent to 24.0 percent, respectively), but the severely rent burdened share declined 1.4 percentage points (from 27.6 percent to 26.2 percent, respectively) over the same period. The share of extremely low-income households that are severely rent burdened is persistently very high, dropping by only 0.7 percentage points from 69.7 percent to 69.0 percent. Low-income households experienced the largest decline in the severely rent burdened rate, which declined from 10.3 percent in 2009 to 9.0 percent in 2019. The largest increase in the share of an income level that was rent burdened was for middle-income households, which increased from 10.6 percent moderately rent burdened in 2009 to 13.8 percent moderately rent burdened in 2019.
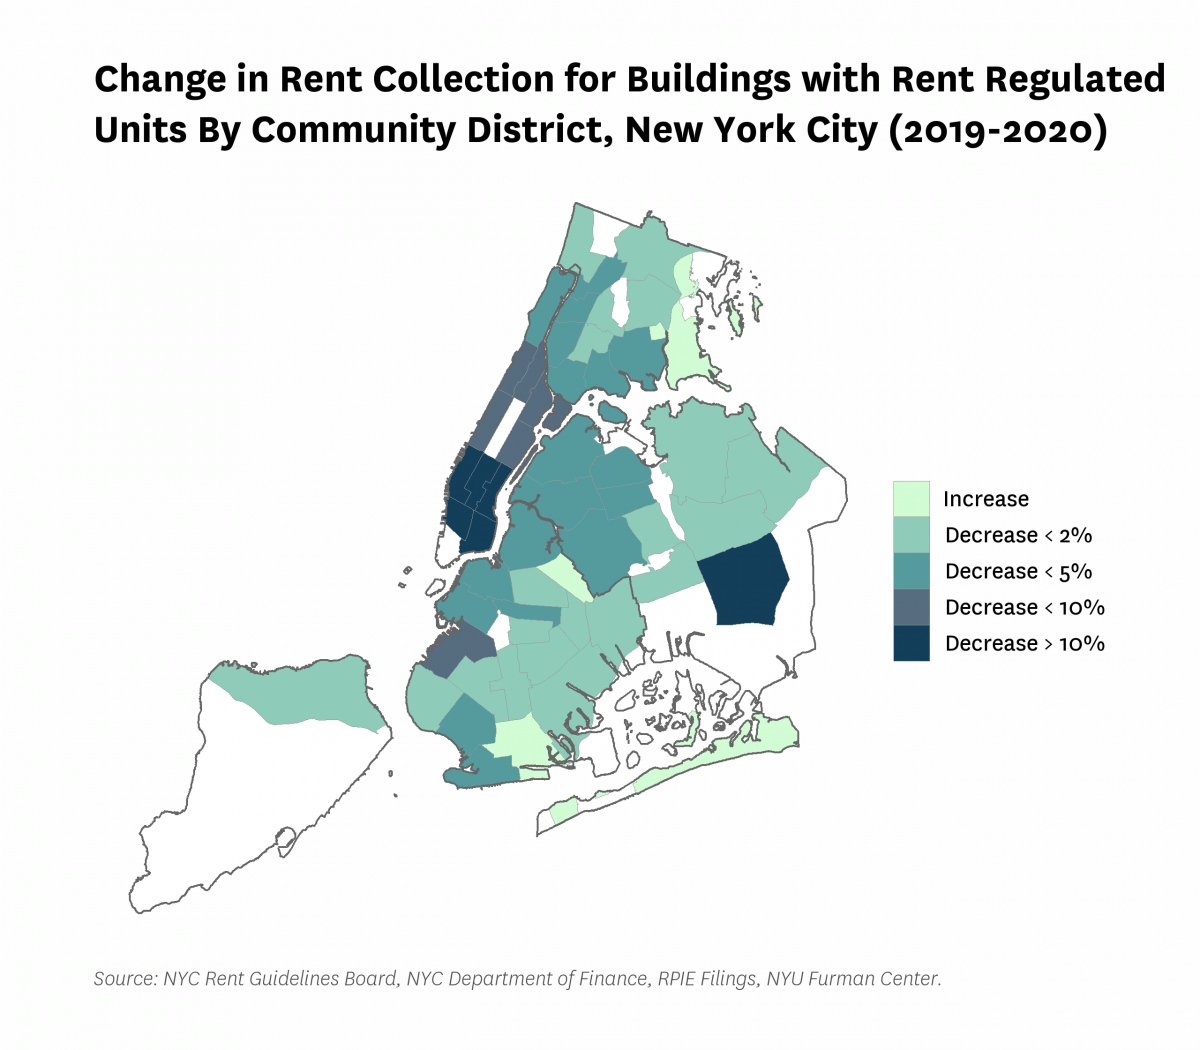
Between 2019 and 2020, collected rent in buildings with at least one rent regulated unit decreased across most neighborhoods in the city.
According to the 2022 Rent Guidelines Board Income and Expense Study, wealthy neighborhoods in Manhattan seemed to bear the worst of the brunt of declines in rent collections from buildings with at least one rent regulated unit. Collected rent may have fallen because of the greater share of co-existing market rate units, whose occupants were more likely to move than tenants in rent-regulated units, or due to increasing vacancies or declining rents. The largest decreases in rent (10.0% or more) occurred mainly in lower Manhattan (Greenwich Village, Lower East Side/Chinatown, Midtown, and Stuyvesant Town/Turtle Bay), as well as Jamaica, Queens. Over the same period, rent from rent regulated units only increased in four outer borough neighborhoods: Throgs Neck/Co-op City, Rockaway/Broad Channel, Sheepshead Bay, and Bushwick.
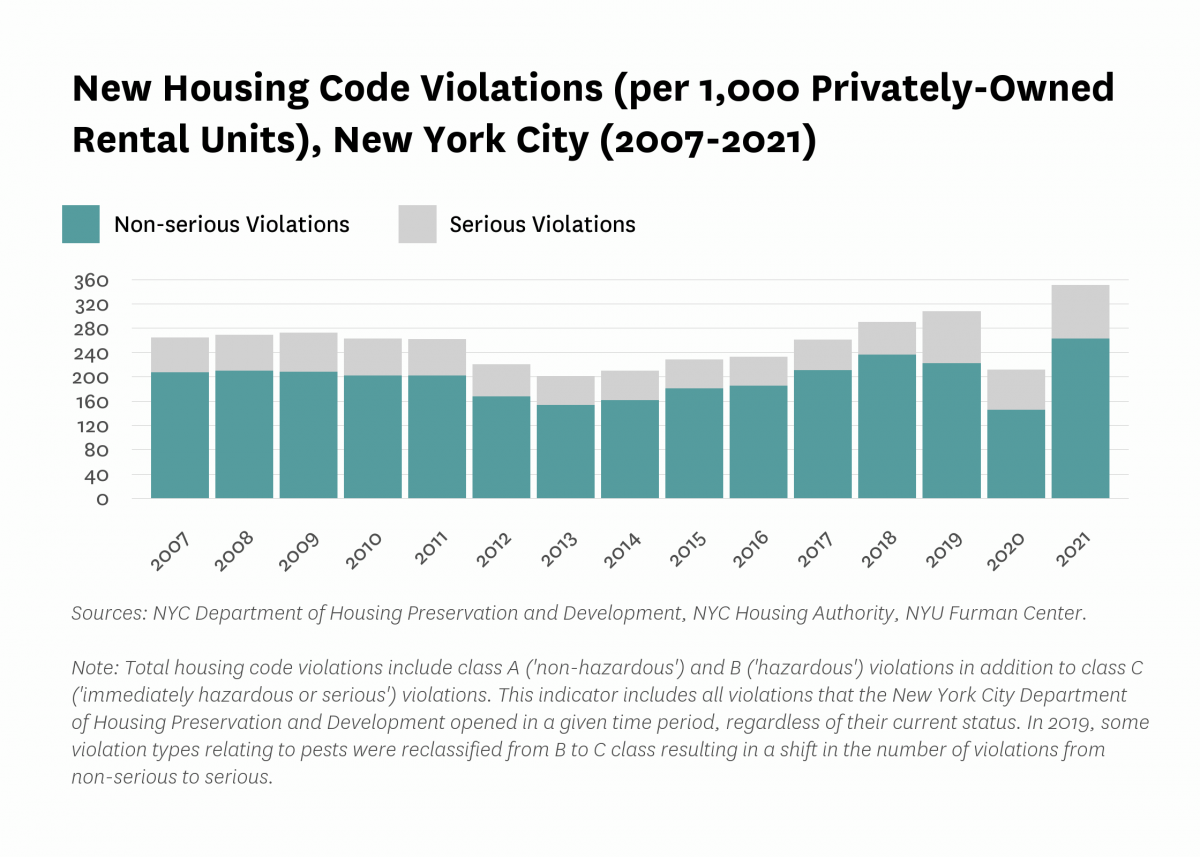
During 2021, the Department of Housing Preservation and Development issued the highest number of housing code violations since 2007.
The rate of new violations (per 1,000 privately-owned rental units) increased to 350.7 in 2021, 139.0 more than the preceding year, and the highest figure on record since 2007. The significant reduction in 2020 may be due at least in part to concerns about the transmission of COVID-19 during housing code inspections, which resulted in a dramatic decline in complaints during the pandemic. The rebound to a recent peak in 2021 may reflect that such concerns are disappearing. For this reason, it is impossible to discern whether this historically-high figure reflects increasing maintenance issues within the housing stock.
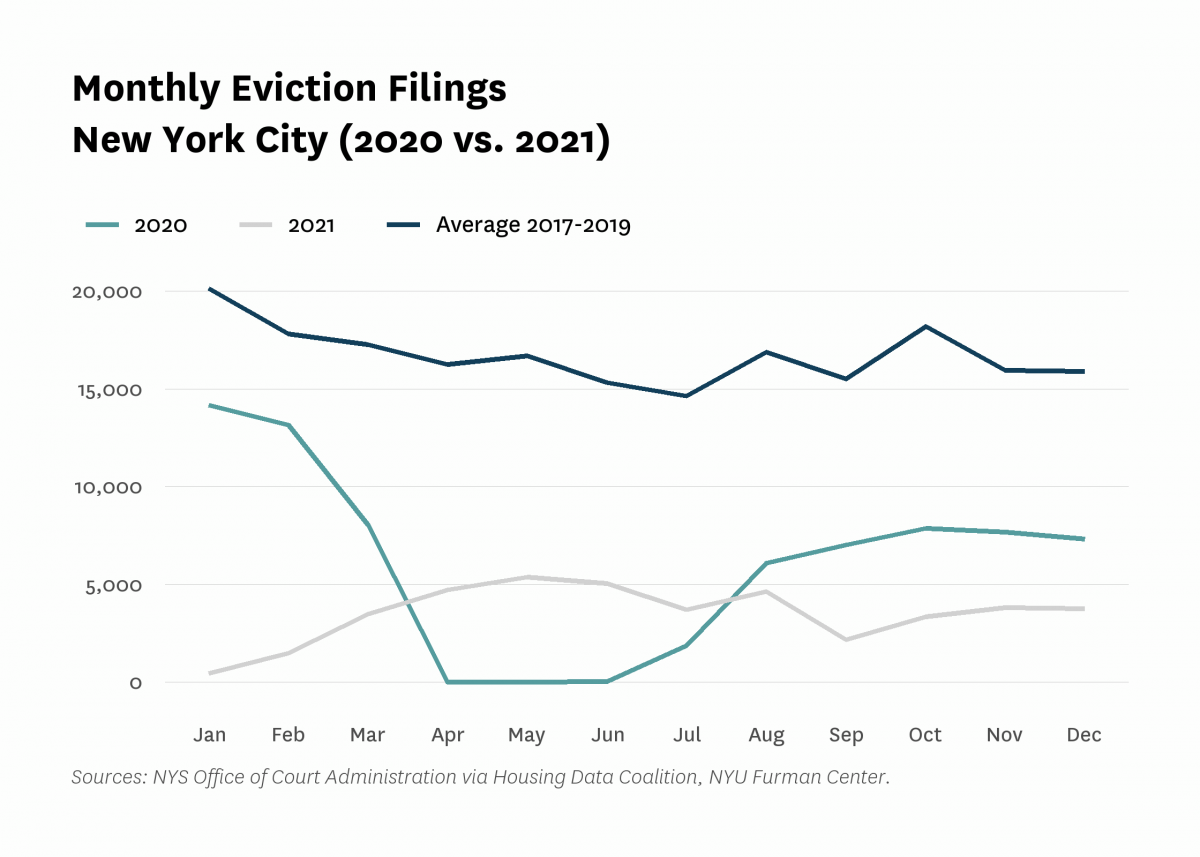
Monthly eviction filings rose throughout 2021, but only to about a third of pre-pandemic levels.
After the onset of the COVID-19 pandemic and the Governor’s Executive Order 202.8 on March 20, 2020 enacting a moratorium on non-essential filings, eviction filings dropped to zero in April from 13,151 in February 2020. After rising slightly in the fall of 2020 with the lifting of some restrictions, the total number of eviction filings declined again to 451 in January 2021, the likely result of New York’s COVID-19 Emergency Eviction and Foreclosure Prevention Act. However, eviction filings started to increase during the spring of 2021 as protections were gradually loosened, rising to a 2021 peak of 5,375 in May. The 2021 levels were historically low, however, at less than a third of the average number of cases filed between May of 2017 and May of 2019 (16,698). For a detailed timeline of the various eviction moratoria affecting eviction in New York City, see our eviction tracker.
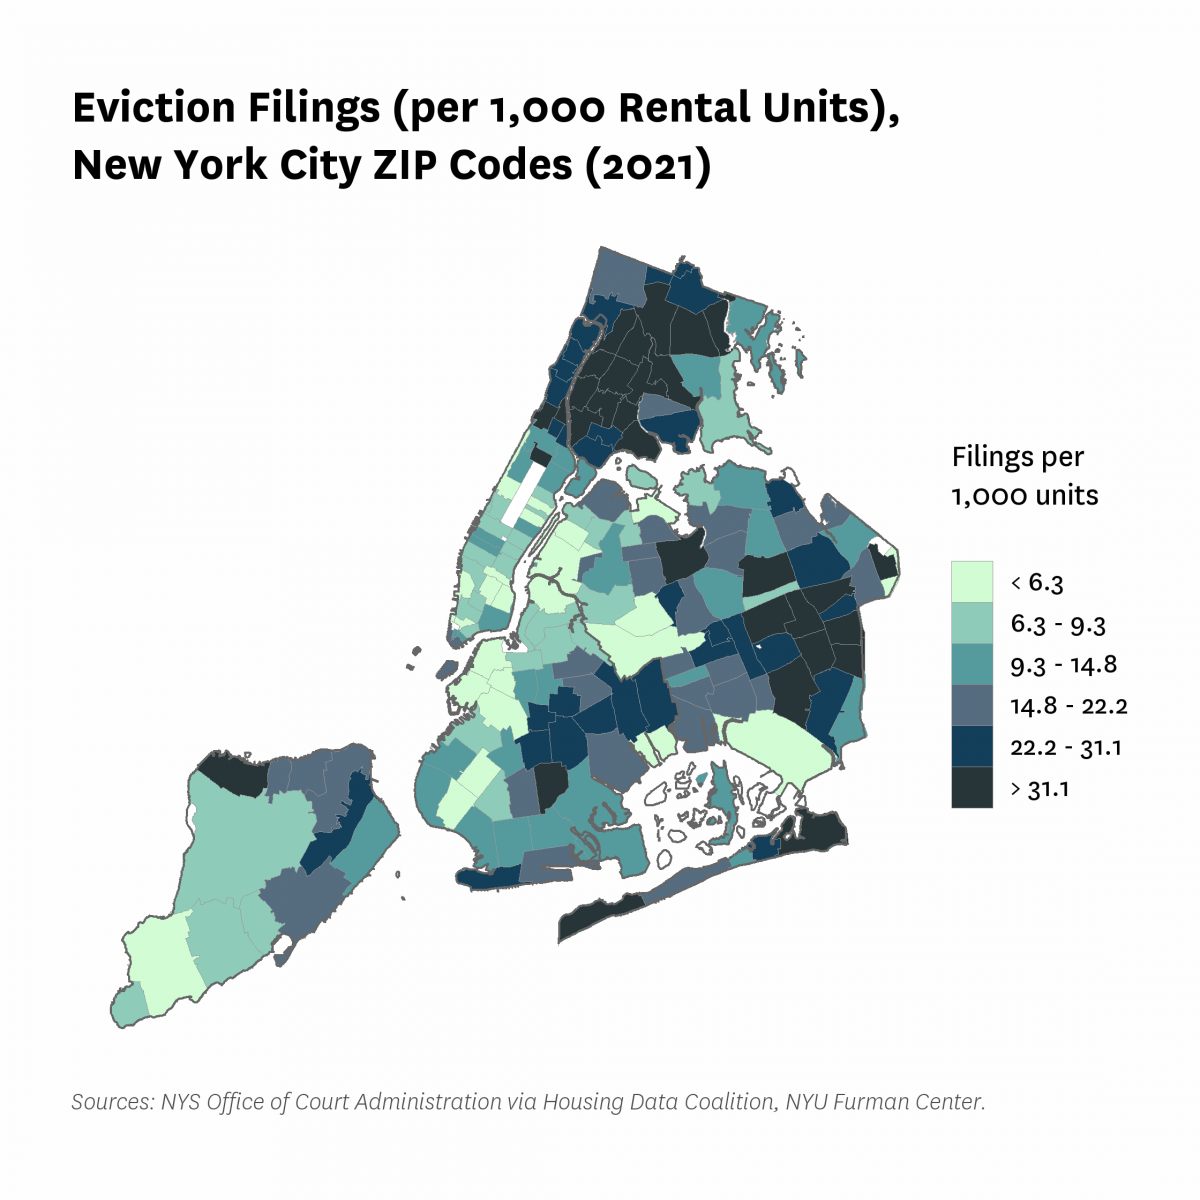
The Bronx, eastern Queens, and central Brooklyn experienced the highest rates of eviction filings in 2021.
2021 eviction filing rates ranged widely throughout New York City, from less than 6 filings per 1,000 units in some areas, to more than 40 filings per 1,000 rental units in many others. The areas with the highest rates of eviction filings per 1,000 rental units included the majority of the Bronx, Washington Heights, eastern Queens, the Rockaways, and much of central Brooklyn.
The areas least affected, with fewer than 6 eviction filings per 1,000 rental units, included areas with a historically low eviction filing rate, including Downtown Manhattan, Astoria, Woodside/Sunnyside, Downtown Brooklyn, Park Slope, and Ridgewood/Maspeth.
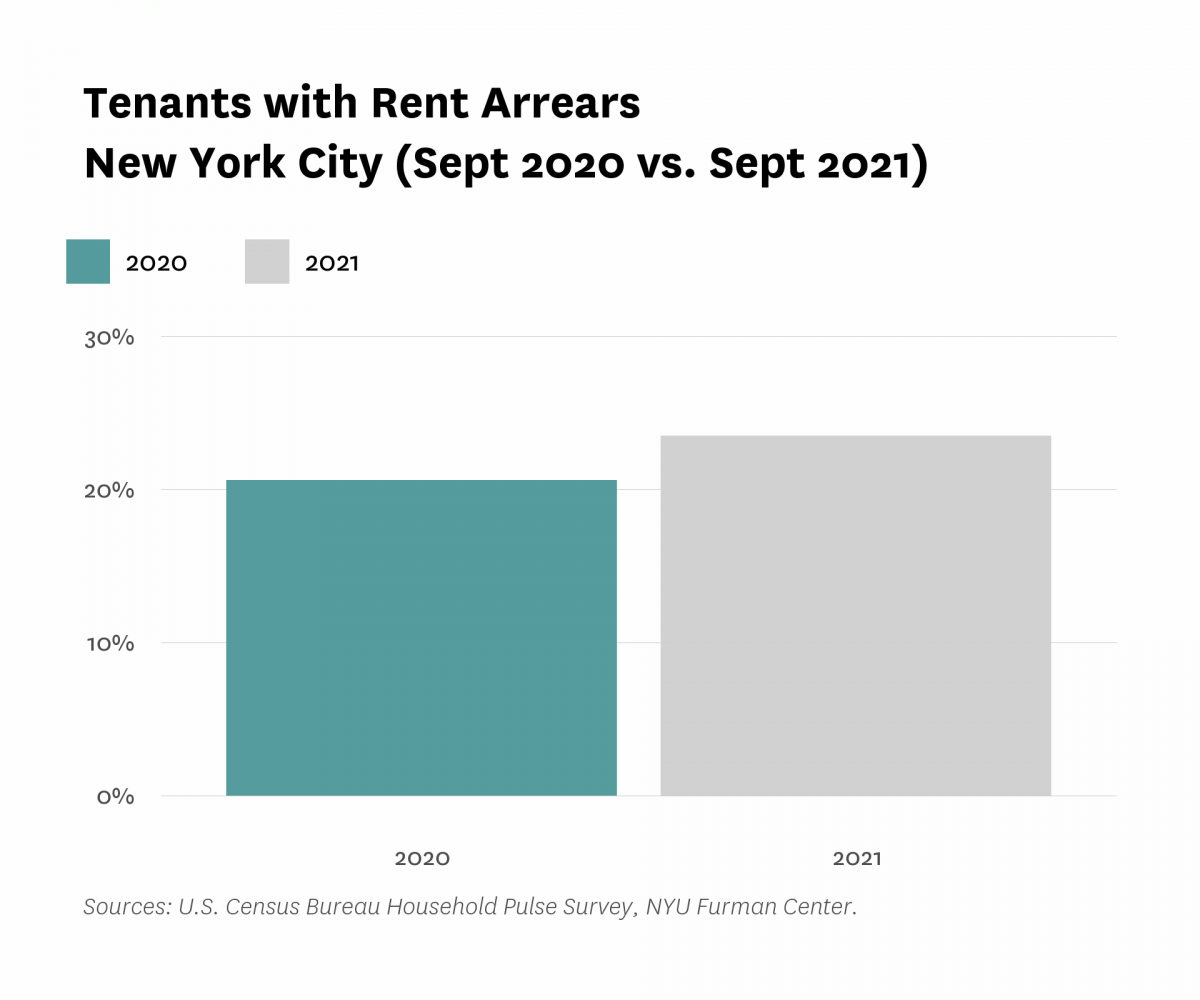
The percent of households with rental arrears appeared to increase between 2020 and 2021.
The share of households with rental arrears increased from 20.6 percent in 2020 to 23.5 percent in 2021, according to the U.S. Census Bureau’s Household Pulse Survey, although the difference between the years may not be statistically significant. About 20 percent of respondents in renter households did report arrears in the Pulse Survey. This is a new Census product that started during the pandemic, and for that reason, Pulse Survey data is not available prior to the onset of the pandemic and cannot offer a baseline comparison.
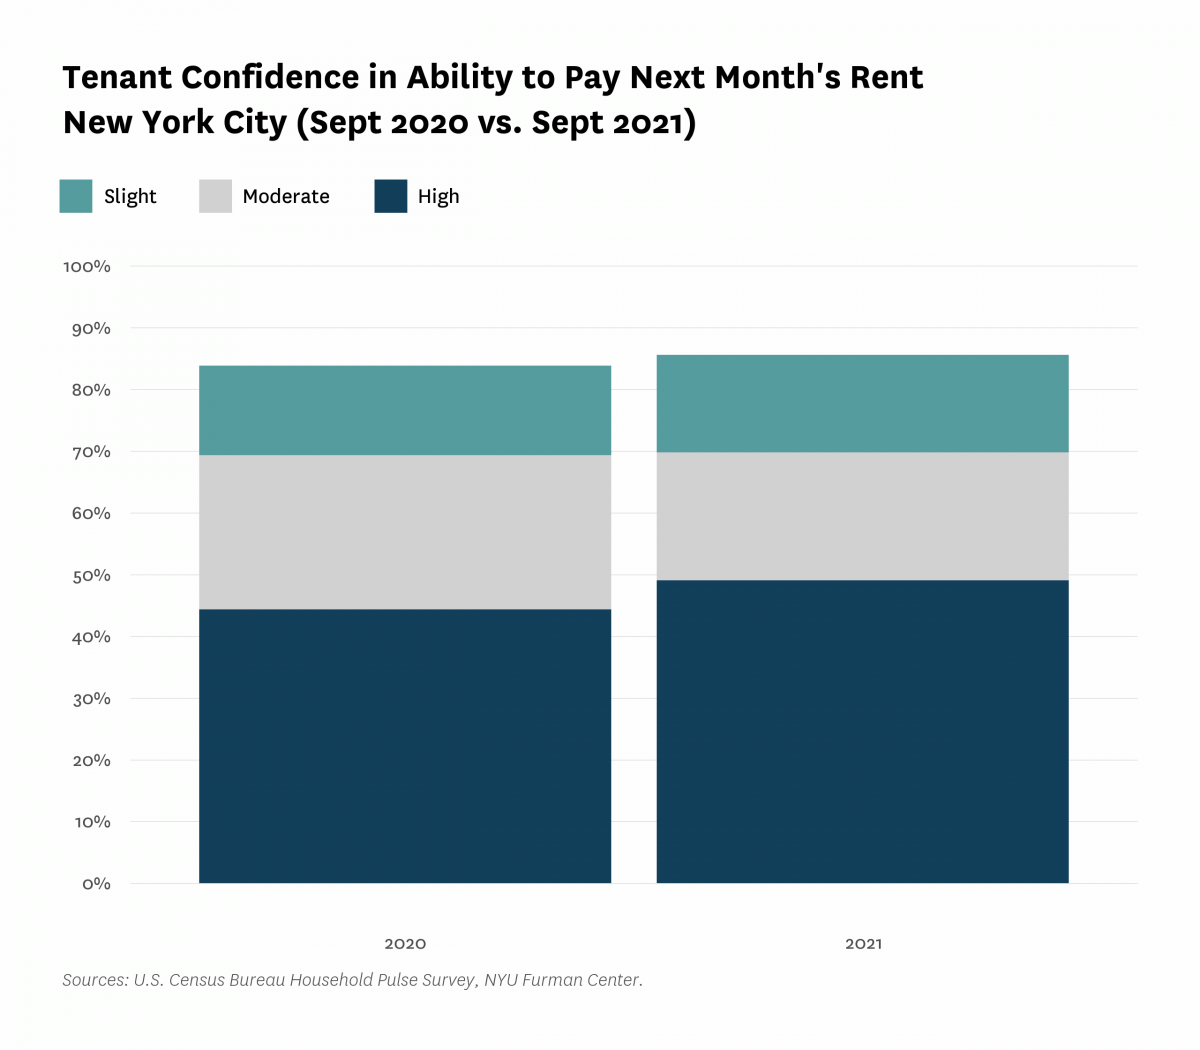
Tenants appeared to be slightly more confident in their ability to pay next month’s rent in September 2021 than in September 2020.
The share of tenants who chose to describe themselves as having either “slight,” “moderate,” or “high” confidence in their ability to pay next month’s rent (as opposed to “not confident”) increased from 83.8 percent in September 2020 to 85.5 percent in September 2021. While the “moderate” confidence share actually decreased from 25.0 percent to 20.7 percent, the “Slight” confidence share increased from 14.5 percent to 15.8 percent and the share of “High” confidence tenants increased from 44.3 percent to 49.0 percent. However, the difference between years may not be statistically significant.
All content © 2005 – 2024 Furman Center for Real Estate and Urban Policy | Top of page | Contact Us