State of the City 2021
The COVID-19 pandemic and economic shutdown left its mark on New York City’s homeownership trends of 2020 and 2021. The most recently available data show that homeownership purchase originations generally declined in 2020, with Black borrowers experiencing the largest decline in purchasing. The same year, a low-interest rate environment resulted in the largest annual increase in mortgage refinance originations seen in the last decade and a half, with white borrowers making up more than half of the refinancing activity. Finally, pre-foreclosure notices declined dramatically in 2020, and then continued to decline at a lower rate in 2021, likely due to the enactment and expiration of the foreclosure moratoria put in place during the pandemic.
In 2020, the Census Bureau limited the release of the ACS 1-year data to experimental estimates rather than the standard data products. Due to these restrictions, we do not report on the 2020 ACS 1-year data in the figures below, but instead repeat the figures using ACS data from last year (2019 being the most recent data). We have updated HMDA data which extends to 2020.
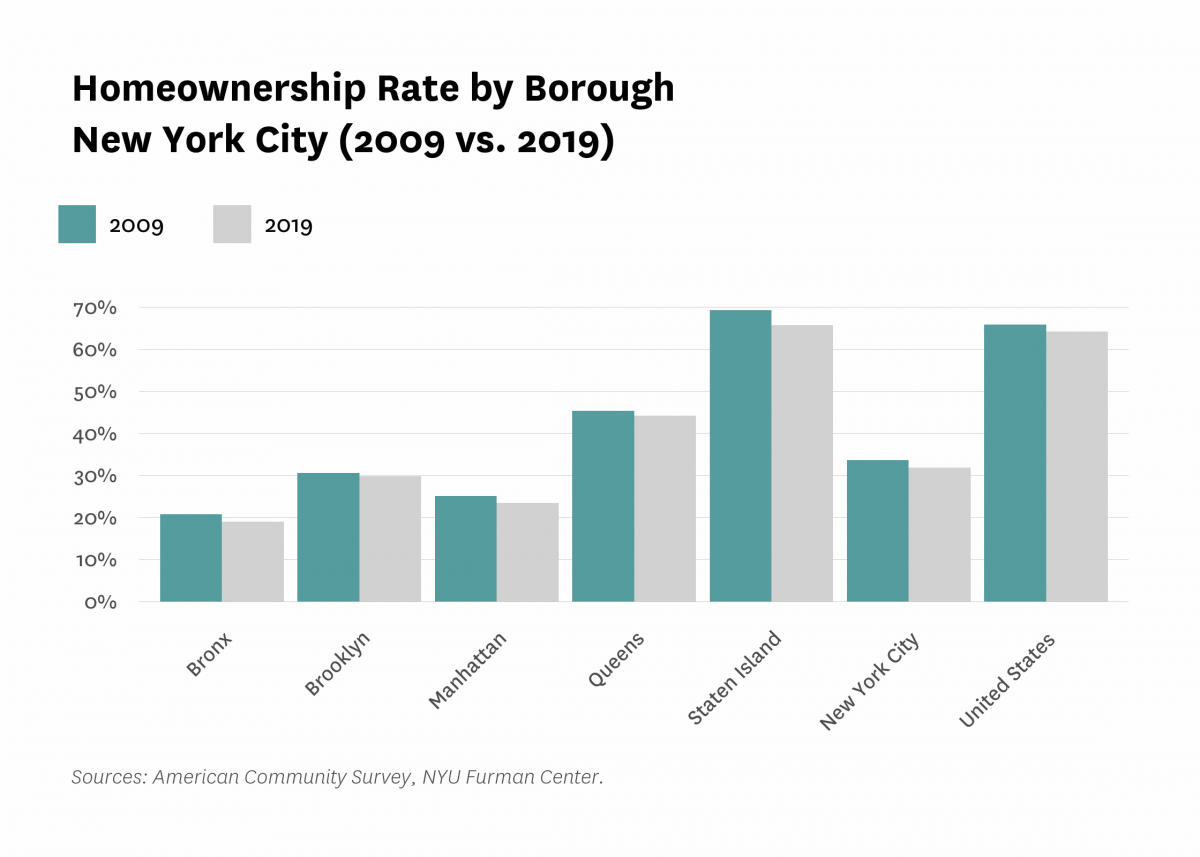
Homeownership rates declined slightly in each borough between 2009 and 2019.
The city’s homeownership rate declined from 33.6 percent in 2009 to 31.9 percent in 2019. Across each of the five boroughs, the homeownership rate decreased by between 0.7 and 3.5 percentage points over this time period, with the largest decrease in Staten Island and smallest decrease in Brooklyn. Staten Island also has the highest homeownership rate compared to any other borough. Staten Island’s 65.7 percent homeownership rate is slightly higher than the national rate (64.1%), over three times as high as the rate in the Bronx (18.9%), and over two times as high as the rates in Brooklyn (29.8%) and Manhattan (23.3%). Queens followed Staten Island with the second-highest homeowner rate in the city (44.1%).
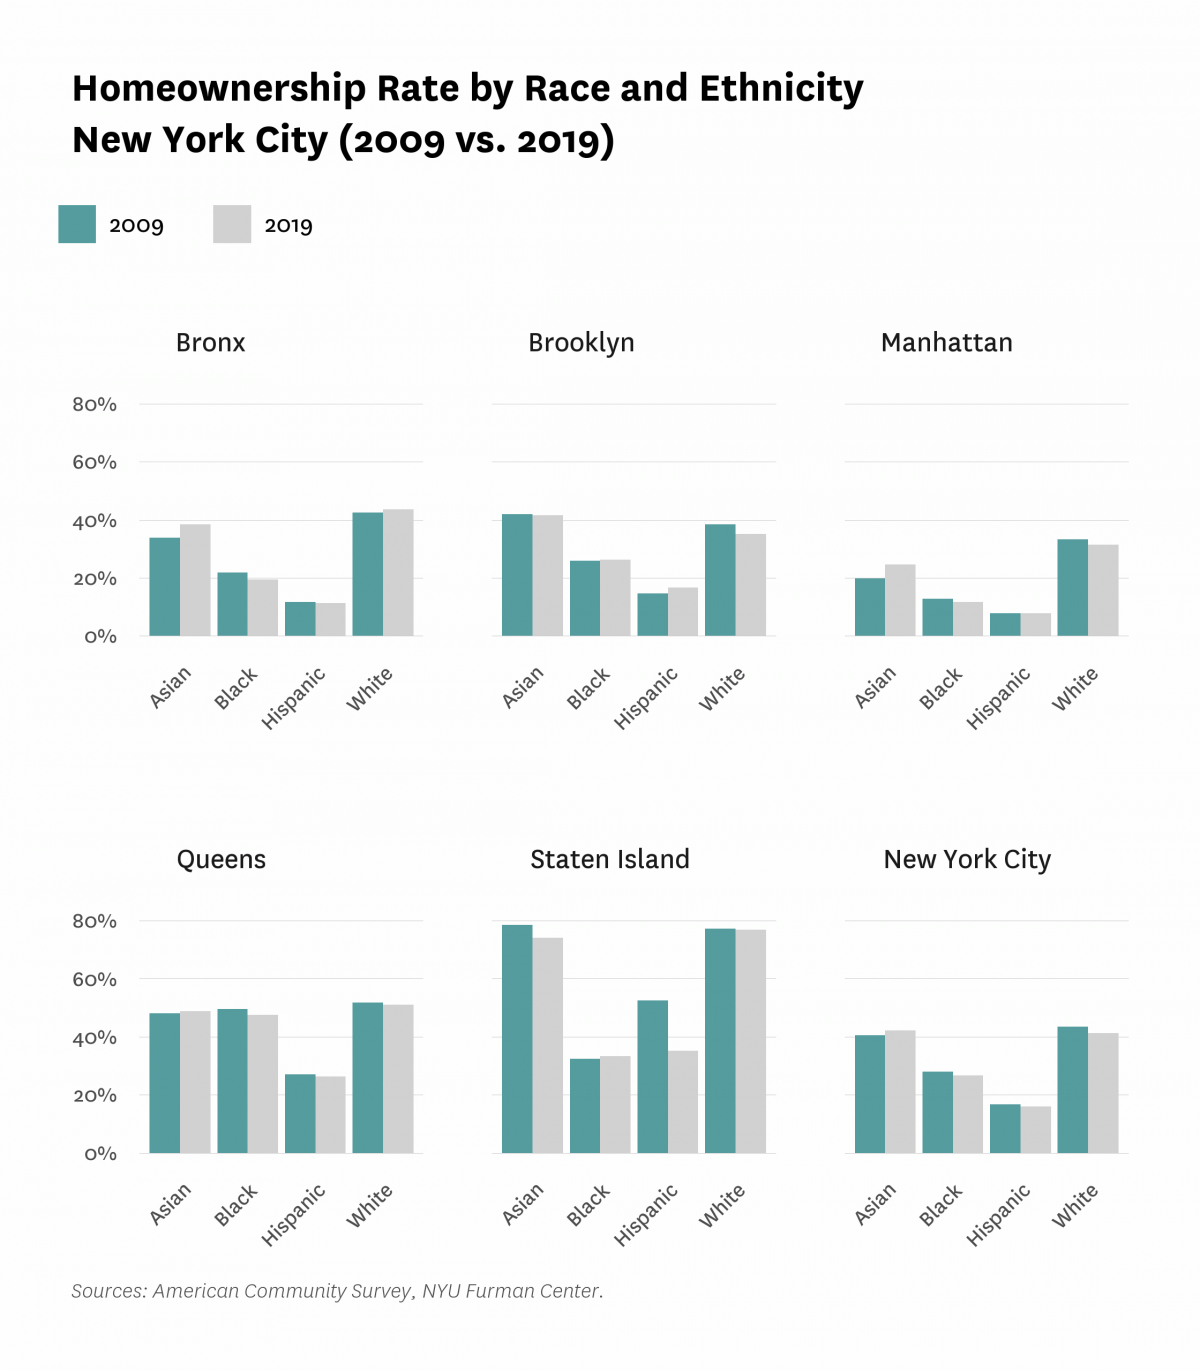
Homeownership rates were highest among white households and lowest for Black and Hispanic households in all boroughs.
Citywide, Asian households had the highest homeownership rate in 2019 at 42.2 percent, followed by white households at 41.2 percent. Homeownership rates were lowest for Black and Hispanic households, whose respective rates were 26.6 percent and 15.9 percent. These gaps were more pronounced in certain boroughs. For example, Staten Island had the largest racial disparities in homeownership rates with a 43.5 percentage point difference between Black and white households, and a 41.8 percentage point difference between Hispanic and white households. In Staten Island, Hispanic households also saw the largest decrease in homeownership rate (-17.4 percentage points) from 2009 to 2019 among any racial/ethnic group in any borough.
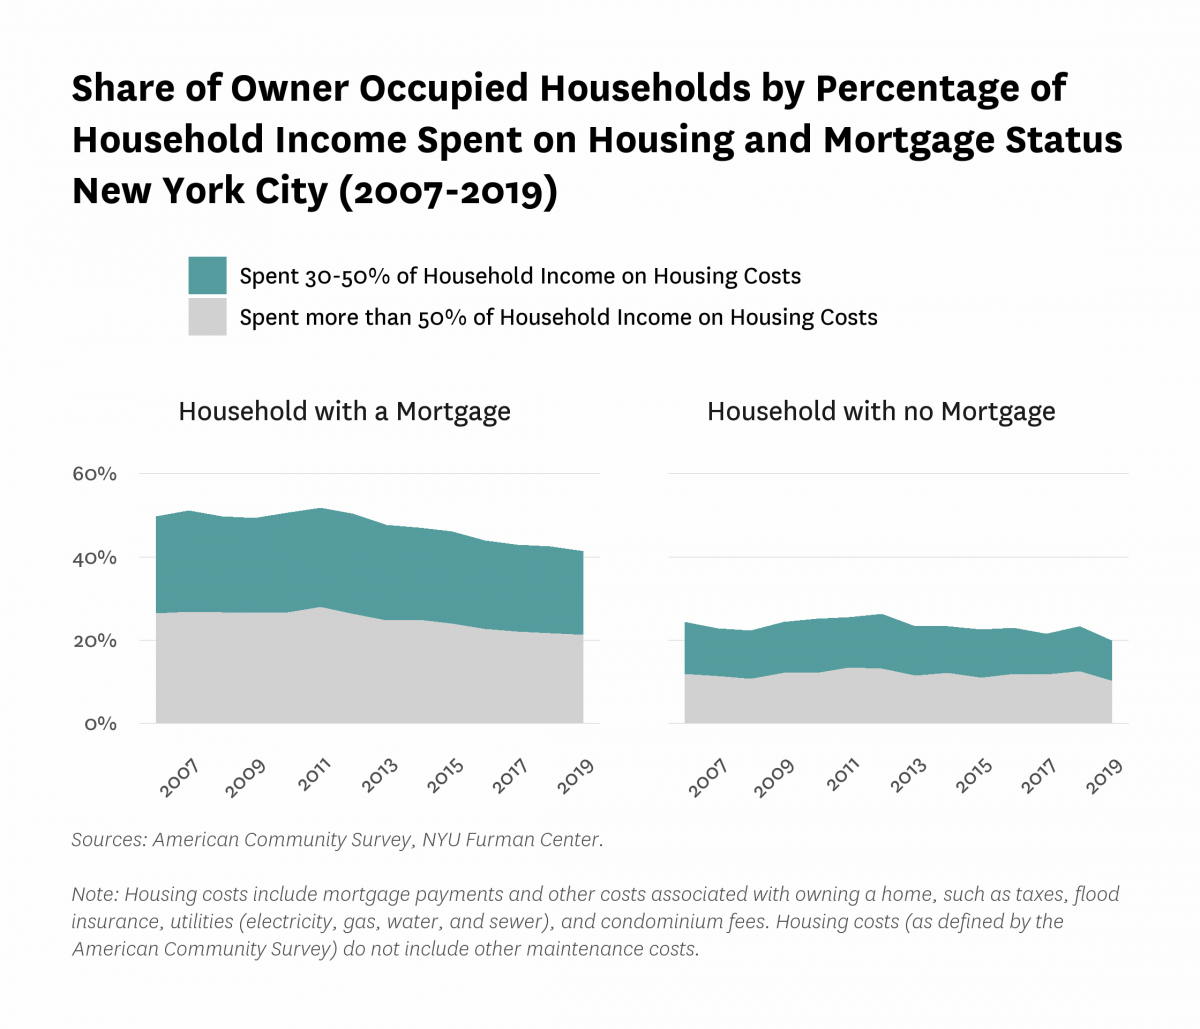
Although the share of cost burdened homeowners decreased between 2011 and 2019, close to one in five owner households without a mortgage are still moderately or severely cost burdened.
The share of severely cost-burdened owners, defined as those spending more than 50 percent of household income on housing costs, peaked in 2011 at 28.0 percent for households with a mortgage. Since then, the share decreased by 6.8 percentage points to 21.2 percent in 2019. The share of owners spending 30-50 percent of their household income on housing costs also decreased from 23.7 percent in 2011 to 20.2 percent in 2019 for households with a mortgage. The cost burden rates are significantly lower for households without a mortgage. In 2019, the share of severely cost burdened households without a mortgage was 11.0 percentage points lower than for households with a mortgage.
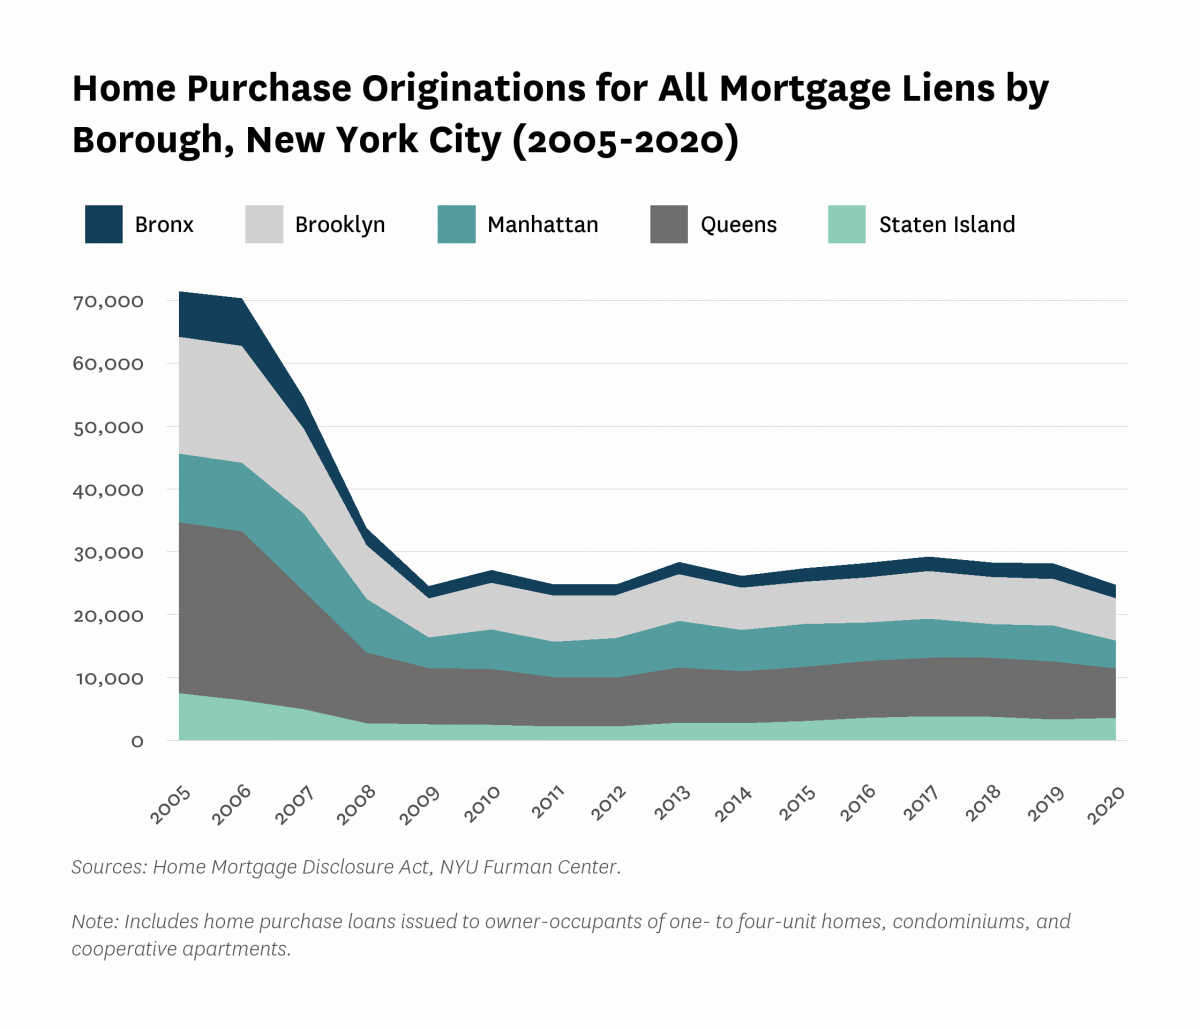
Home purchase originations decreased across all boroughs except Staten Island between 2019 and 2020.
Home purchase originations, or the number of new mortgages taken out by borrowers, remained relatively constant between 2014 and 2020. Between 2019 and 2020, however, originations fell from 28,171 to 24,707. Manhattan saw the largest decline over this period (-24.0%), followed by the Bronx (-15.5%), Queens (-14.4%), and Brooklyn (-8.8%). Staten Island was the only borough that saw an increase in home purchase originations (by 8.6%).
Home purchase originations declined across all racial and ethnic groups between 2019 and 2020.
Between 2019 and 2020, Black borrowers saw the largest decrease in home loan originations from 3,090 to 2,660, (-13.9%). This decline occurred just one year after a 17.2 percent increase among Black borrowers in the year prior. White and Asian borrowers saw slightly smaller declines between 2019 and 2020 (-12.8% and -12.1%, respectively) but still represented the highest shares of mortgage originations (45.8% and 33.2%, respectively). Hispanic borrowers represented the lowest share of home mortgage originations in 2020 (10.1%) but experienced the smallest decrease from 2019 to 2020 (-9.5%).

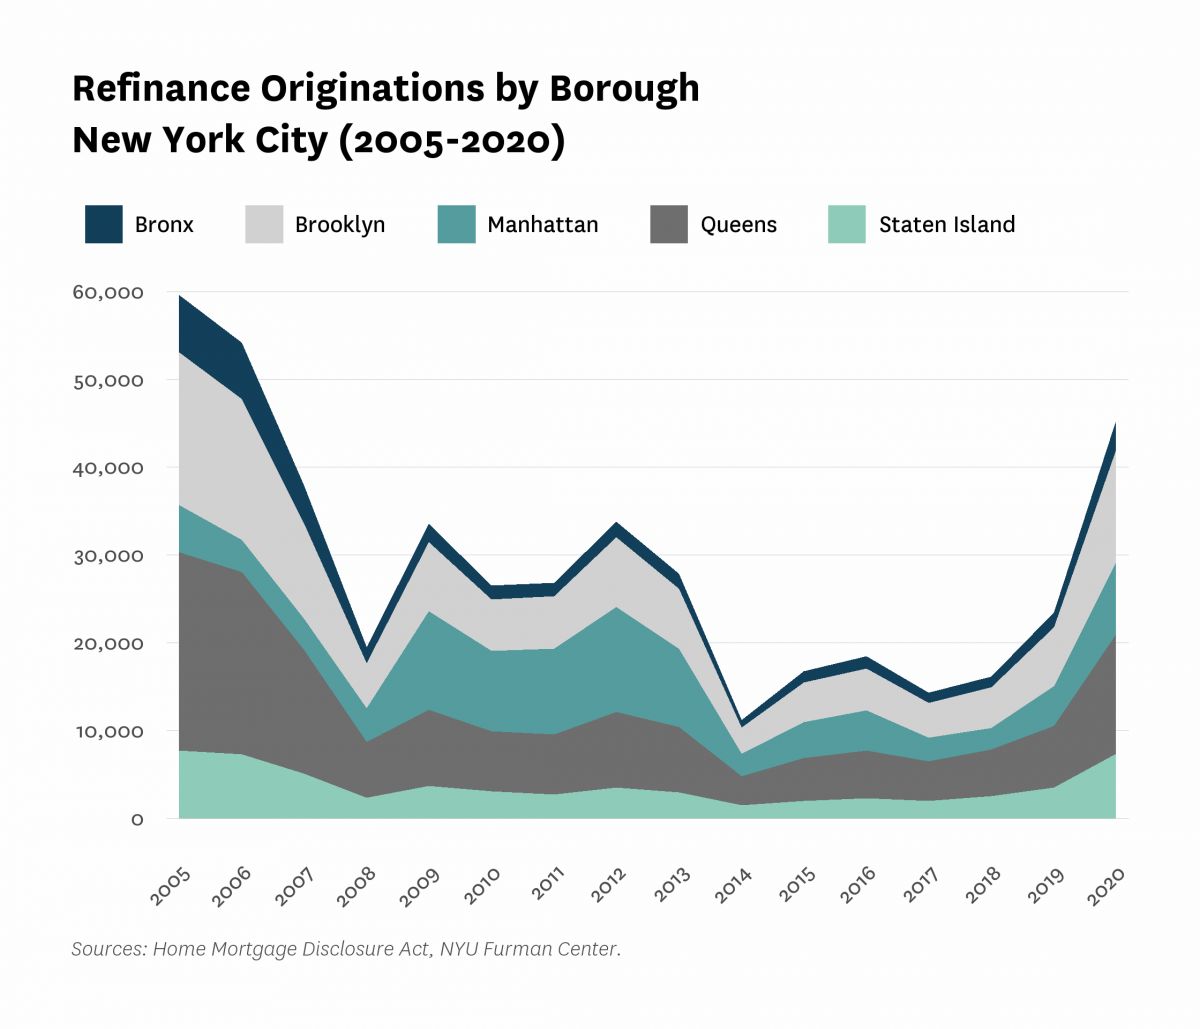
Mortgage refinancing increased by 93.2 percent between 2019 and 2020, the largest increase seen in New York City in the last decade and a half.
Across the city, the total number of mortgage refinance originations jumped from 23,477 in 2019 to 45,356 in 2020. All boroughs saw increases in originations in this time period, with Staten Island experiencing the largest increase (108.3%). This sharp jump in mortgage refinancing can likely be attributed to the low-interest rate environment. The interest rate on 30-year fixed-rate mortgages nationally was 3.1% in 2020, the lowest in this time period.
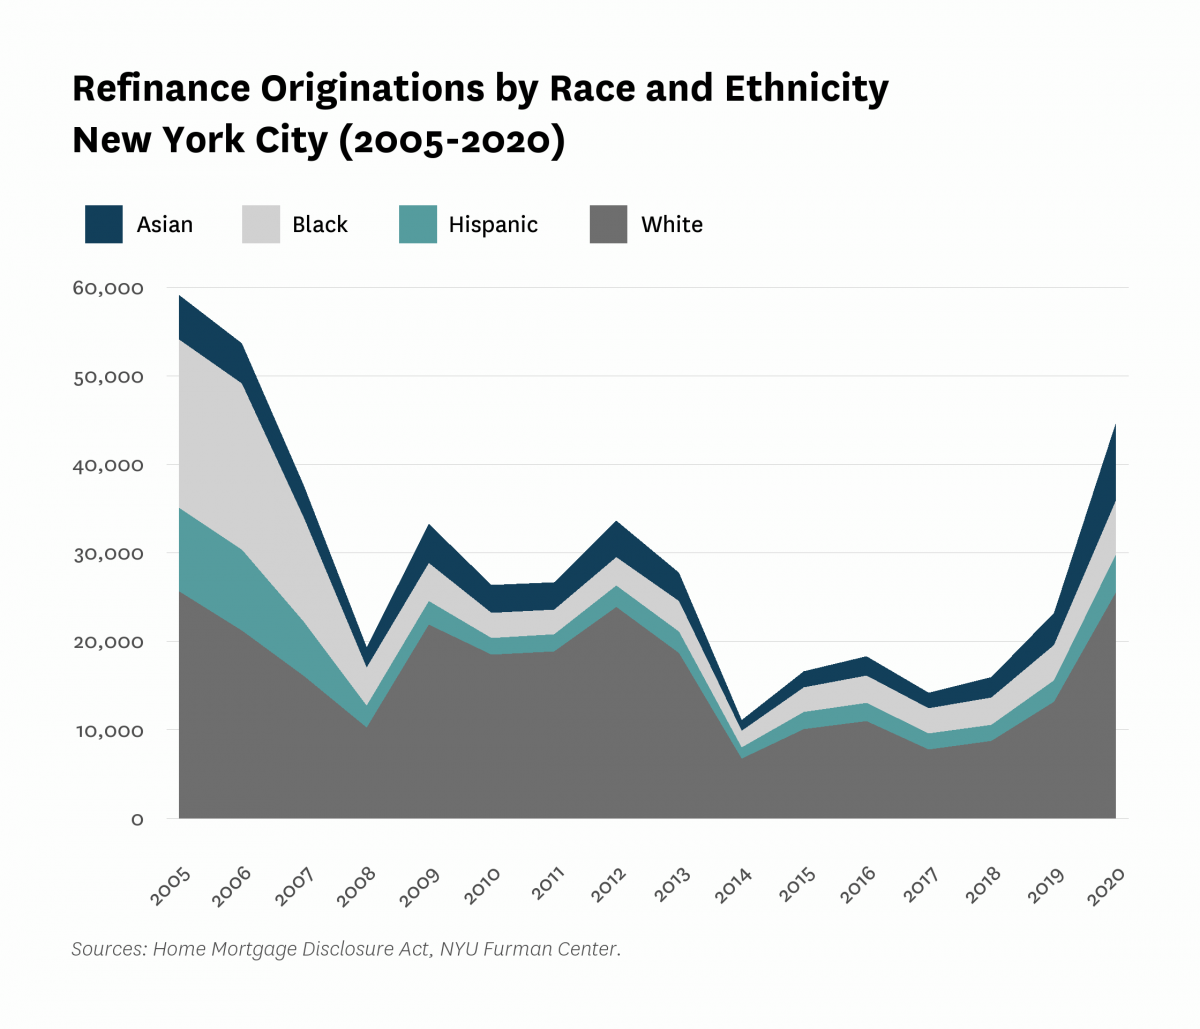
Refinancing activity increased for mortgage holders in all racial and ethnic groups between 2019 and 2020, with the largest increases seen among Asian and white borrowers.
The number of mortgage refinance originations increased significantly for all racial and ethnic groups between 2019 and 2020, likely attributed to the low-interest rate environment. Originations increased by 54.0 percent for Black borrowers and 74.6 percent for Hispanic borrowers, less than the increases for white and Asian borrowers (94.3% and 142.5%, respectively). Black and Hispanic shares of refinance originations (9.5% and 13.7%, respectively) also remained below that of white and Asian borrowers (57.2% and 19.6%).
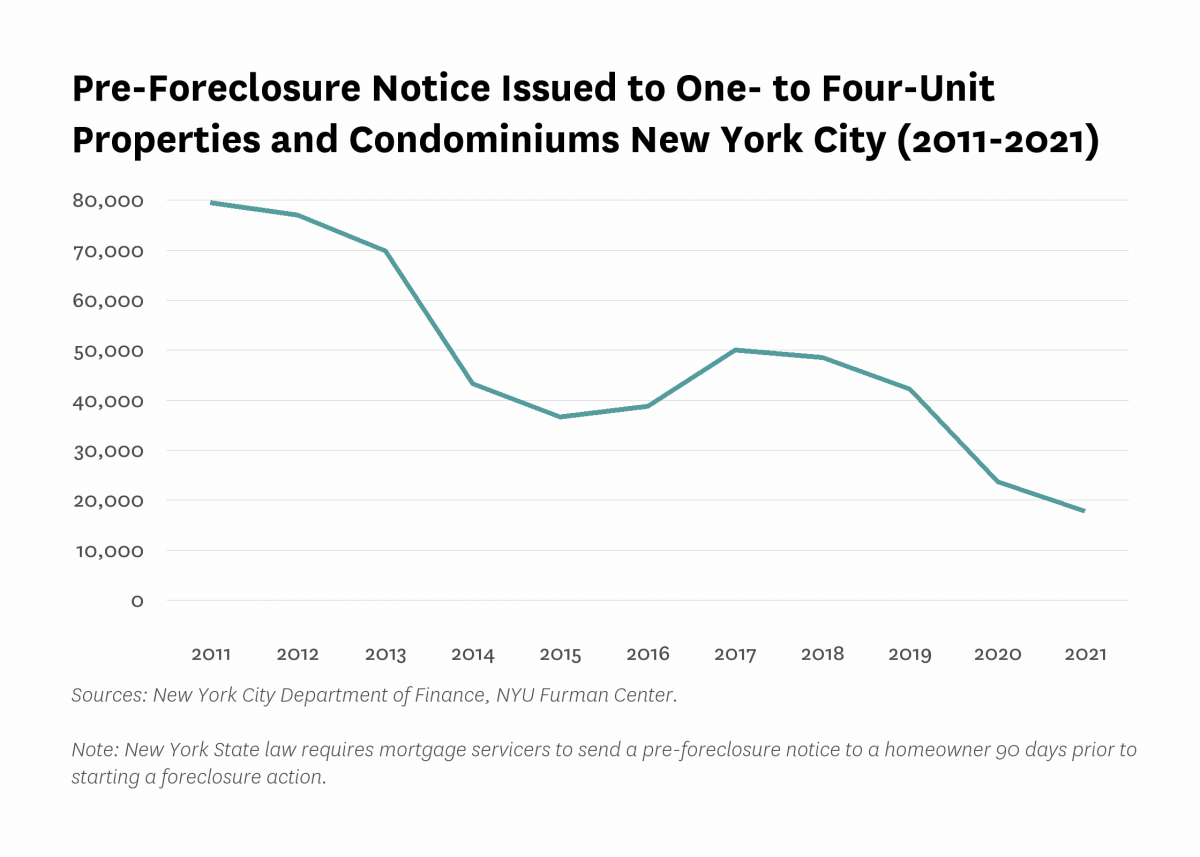
Pre-foreclosure notices in 1-4 unit homes, condominiums, and cooperatives declined dramatically between 2019 and 2020, before somewhat moderating between 2020 and 2021.
The number of pre-foreclosure notices in 1-4 unit homes, condiminiums, and cooperatives has been declining since 2017, but this trend continued between 2019 and 2020, decreasing by 43.8 percent to 23,698 pre-foreclosure notices. The rate of decrease slowed to 24.9 percent between 2020 and 2021, when pre-foreclosure notices reached a low of 17,802. The slower decline this past year is likely due to the expiration of foreclosure moratoria that were put in place in response to the COVID-19 pandemic and economic shutdown.
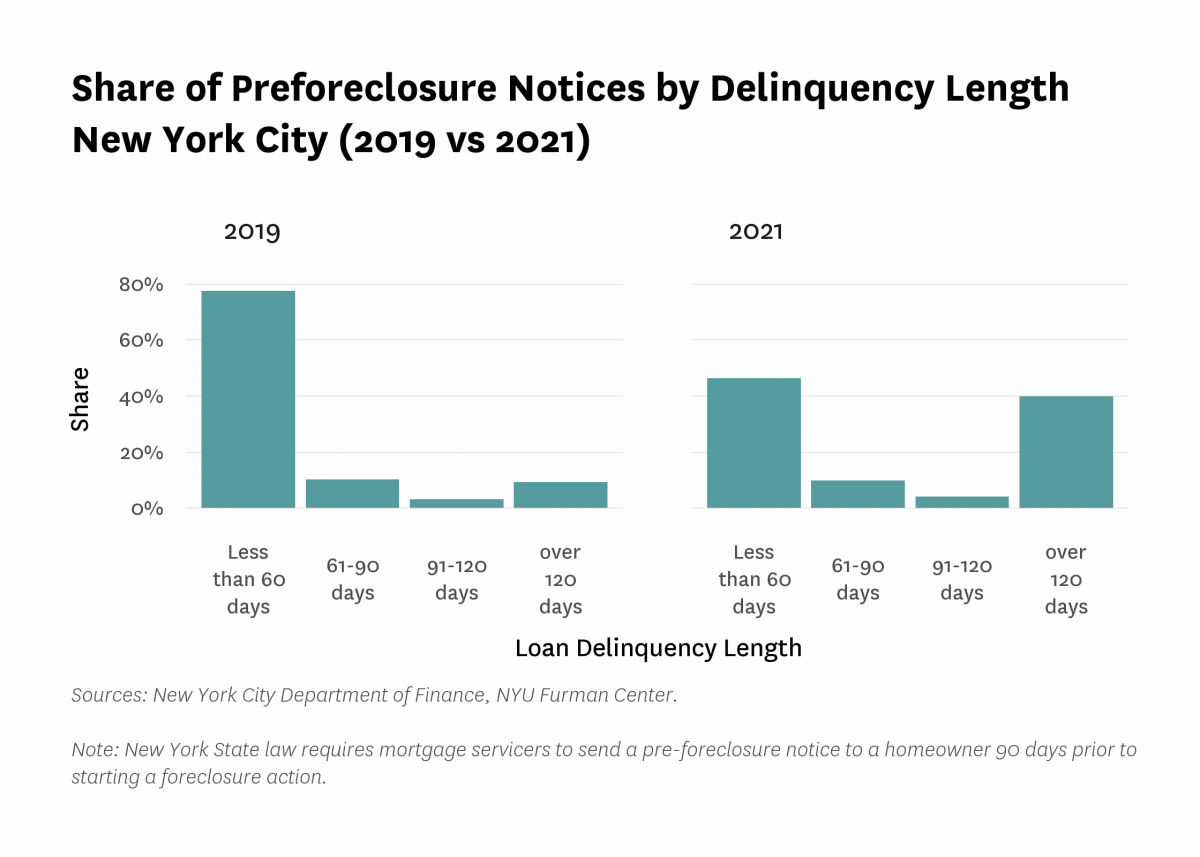
The share of pre-foreclosure notices with a delinquency length of over four months increased between 2019 and 2021.
In 2019, the majority of pre-foreclosure notices (77.5%) had a delinquency length of less than two months. In other words, the vast majority of households that received pre-foreclosure notices had missed less than two months of mortgage payments. In 2021, this share decreased to 46.4 percent, while the share of pre-foreclosure notices with a delinquency length of over four months rose to 39.8 percent, over four times the share in 2019. This jump can likely be attributed to the pandemic-related foreclosure moratoria that were put in place from March 2020 until June 2021.
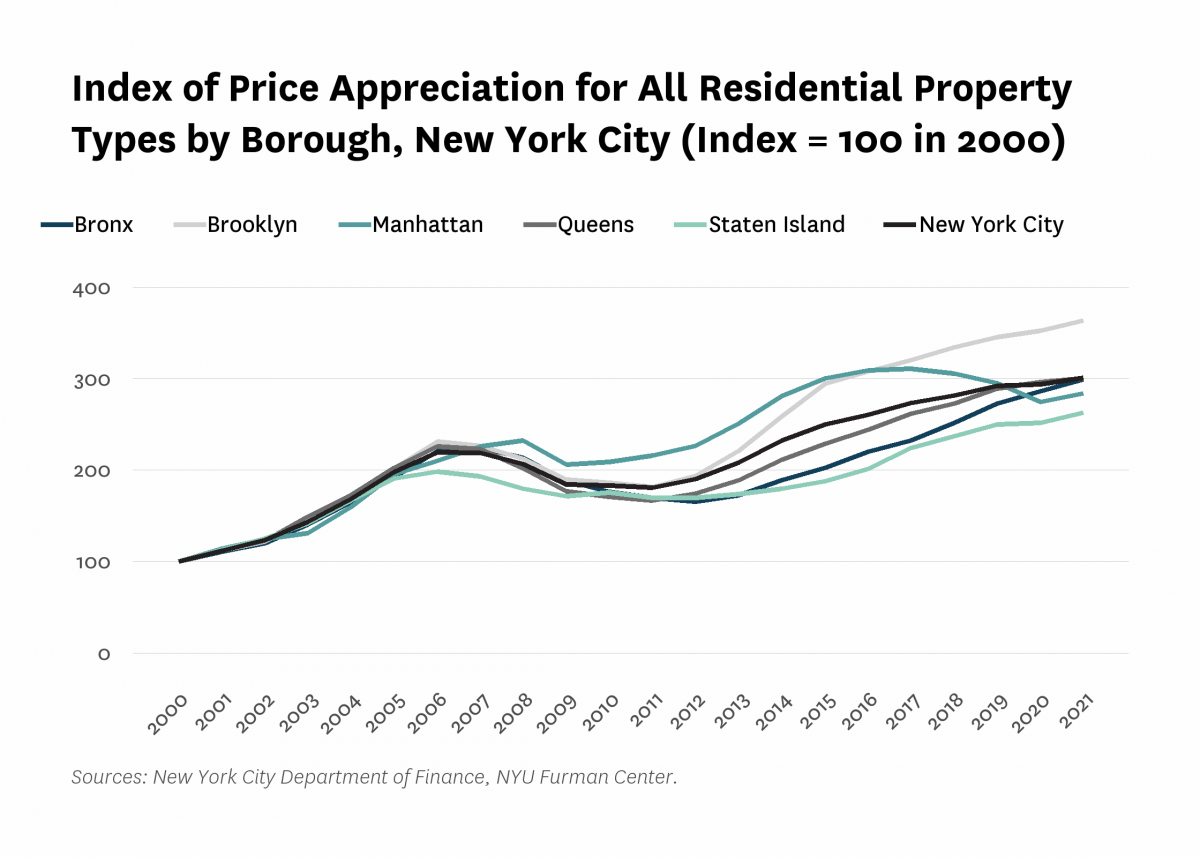
Residential property values appreciated throughout New York City between 2020 and 2021, with the largest gains in Brooklyn and the Bronx.
Between 2020 and 2021, the indexed value for sales price of residential property (index = 100 in 2000) increased by 7.0 percentage points across the city. Overall index value increased by 12.8 percentage points in the Bronx, 11.3 percentage points in Brooklyn, 3.8 percentage points in Queens, and 10.9 percentage points in Staten Island between 2020 and 2021. While overall sales value declined by 31.0 percentage points in Manhattan between 2018 and 2020, Manhattan residential properties rebounded, and appreciated by 8.9 percentage points between 2020 and 2021. Overall, properties have appreciated in sales value by approximately a factor of three since 2000, with the largest increase of all boroughs having occurred in Brooklyn (363.5% of the 2000 value in 2021). Manhattan is the only borough not currently experiencing its highest property values since 2000 (the borough’s peak was in 2017).
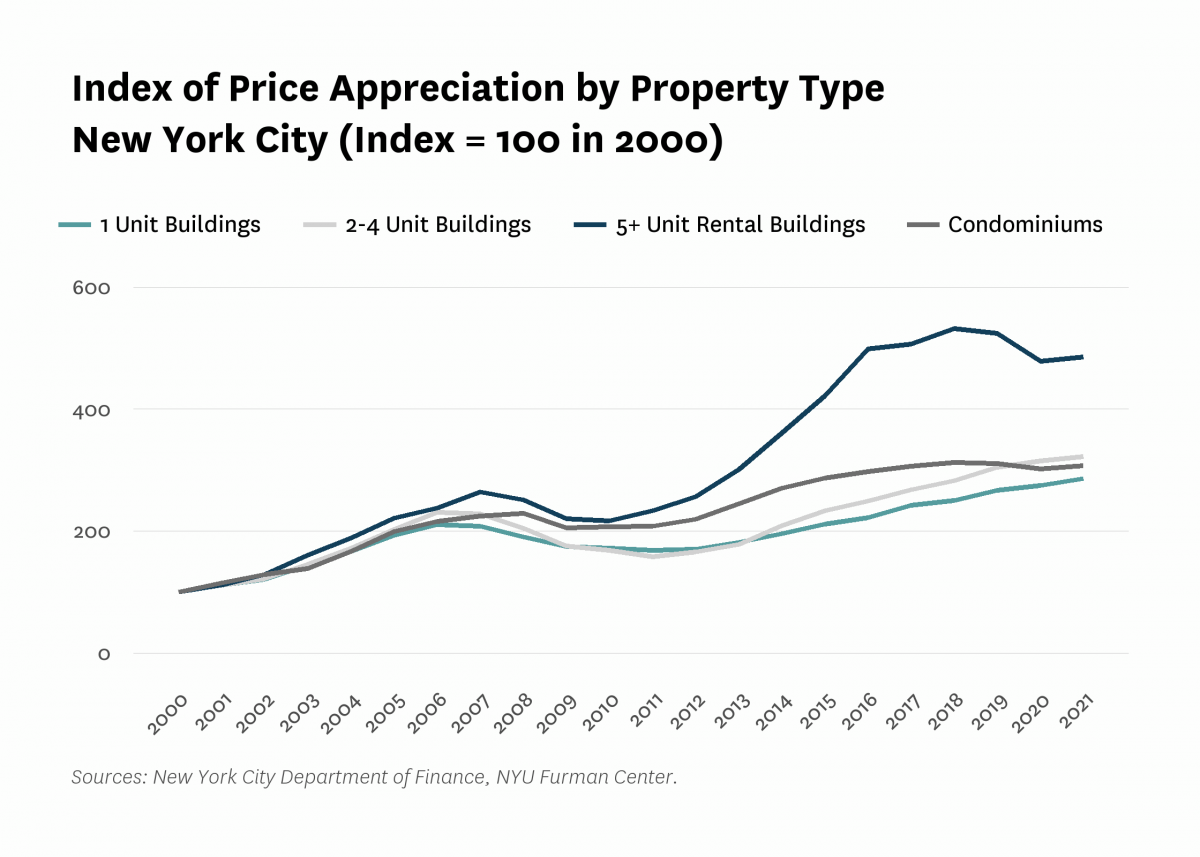
Between 2020 and 2021, single-unit buildings experienced the greatest increase in sales prices, compared to other types of properties.
Sales prices appreciated for properties with one or two to four units by 11.5 and 6.7 percent respectively between 2020 and 2021. This continued eight years of fairly consistent price appreciation for smaller residential buildings. Buildings with more than five units and condominiums also increased in value between 2020 and 2021, but only after a negative trend during the previous two years. The value of buildings with five or more units increased by 7.3 percent and condominiums increased by 5.6 percent between 2020 and 2021. Buildings with one unit experienced the smallest increase in value since 2000 (286.6% of 2000 value in 2021), while buildings with five or more units saw the largest increase over the same period (485.7% of 2000 value in 2021).
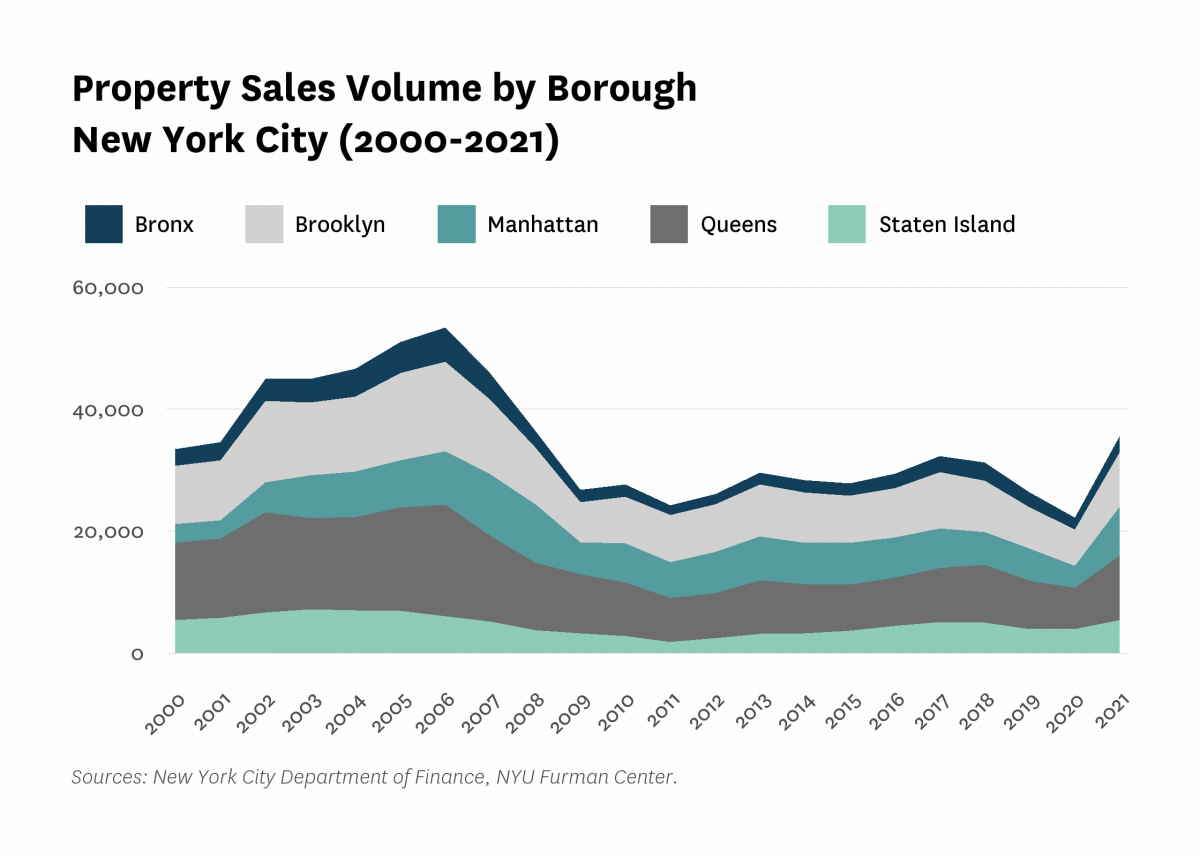
Property sales volume returned to pre-pandemic levels in 2021 after a citywide decline in 2020.
In 2021, citywide sales volume rebounded from 2020 to surpass its pre-pandemic amounts. Manhattan saw the greatest percent increase in sales between 2020 and 2021 (124.6%), with 8,056 total sales, the largest number of sales since 2008. Of all the boroughs, the Bronx experienced both the lowest overall volume (2,633 sales) and also the smallest increase from the prior year (37.1%). Sales increased in Staten Island by 39.6 percent between 2020 and 2021, by 49.8 percent in Brooklyn, and by 54.4 percent in Queens. The increase in sales followed a citywide decline in 2020 to the lowest level since 2000. There were 3,587 sales in Manhattan in 2020, for example, the lowest since 2001.
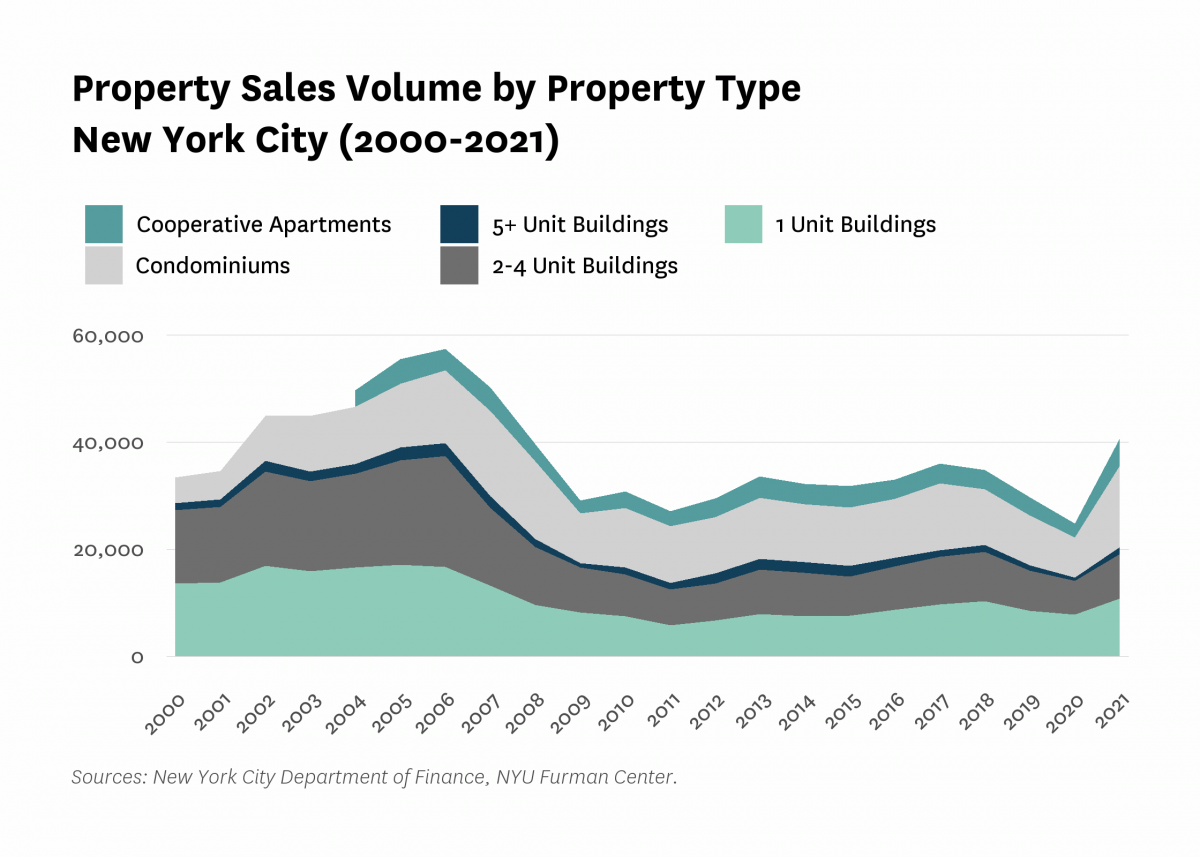
Property sales increased for all property types in 2021, with cooperative apartments and condominiums experiencing the greatest rebound from a low in 2020.
Between 2020 and 2021, sales volume increased for all property types citywide. Sales of cooperative apartments and condominiums saw the largest increases between 2020 and 2021 (100.8% and 103.3%, respectively), with buildings of five or more units not far behind (96.8%). The 2021 increase in sales was more modest for buildings with one or two to four units (38.1% and 32.7%, respectively). The increase in sales represents a rebound from a decline between 2018 and 2020 for all property types. Sales in 2020 were among the lowest since 2000 for all property types except for buildings with one unit, a decline due in large part to the pandemic and the economic shutdown.
All content © 2005 – 2024 Furman Center for Real Estate and Urban Policy | Top of page | Contact Us