State of the City 2021
| New York City Indicators | ||||||
|---|---|---|---|---|---|---|
| 2000 | 2006 | 2010 | 2019 | 2020 | 2021 | |
| Demographics | ||||||
| Population | 8,008,278 | 8,214,426 | 8,184,899 | 8,336,817 | — | — |
| Population aged 65+ | 11.7% | 12.1% | 12.2% | 15.4% | — | — |
| Foreign-born population | 35.9% | 37.0% | 37.2% | 36.2% | — | — |
| Households with children under 18 years old | 34.0% | 32.3% | 31.5% | 27.1% | — | — |
| Racial diversity index | 0.74 | 0.73 | 0.74 | 0.75 | — | — |
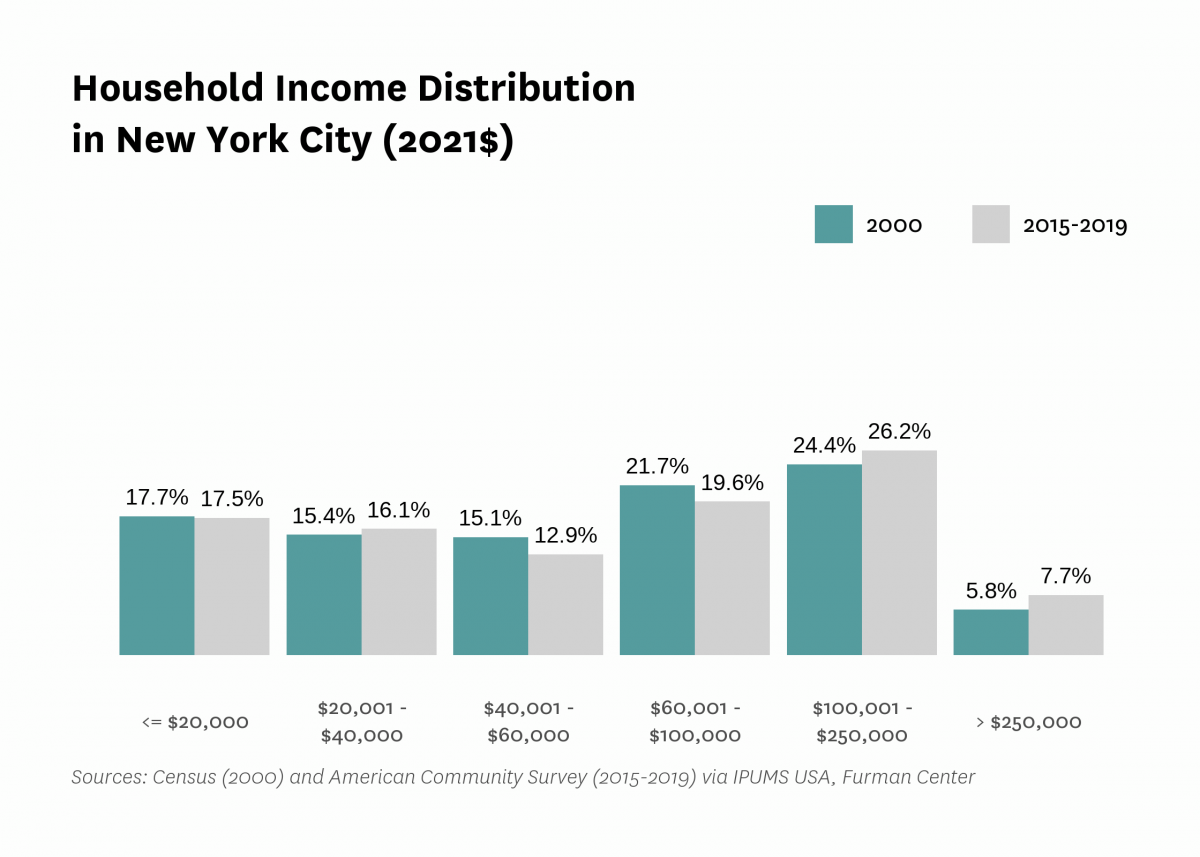
| Income diversity ratio | — | 6.1 | 5.9 | 6.3 | — | — |
| Median household income (2021$) | $63,240 | $61,560 | $59,150 | $72,930 | — | — |
| Poverty rate | 21.2% | 19.2% | 20.1% | 16.0% | — | — |
| Unemployment rate | 9.6% | 7.8% | 11.2% | 5.1% | — | — |
| Population aged 25+ with a bachelor's degree or higher | 27.4% | 32.1% | 33.4% | 39.2% | — | — |
| Population aged 25+ without a high school diploma | — | 21.3% | 20.4% | 16.8% | — | — |
| Housing Market and Conditions | ||||||
| Homeownership rate | 30.2% | 34.4% | 32.1% | 31.9% | — | — |
| Rental vacancy rate | — | 3.8% | 4.4% | 3.3% | — | — |
| Severe crowding rate (% of renter households) | — | — | 4.2% | 4.5% | — | — |
| Serious housing code violations (per 1,000 privately owned rental units)1 | — | 60.9 | 60.2 | 85.6 | 66.4 | 87.9 |
| Notices of foreclosure rate (per 1,000 1-4 unit and condo properties) | 9.0 | 11.5 | 19.1 | 8.7 | 3.6 | 4.6 |
| Home purchase loan rate (per 1,000 properties) | — | 42.8 | 20.2 | 20.2 | 17.6 | — |
| Index of housing price appreciation, all property types | 100.0 | 219.7 | 183.1 | 291.8 | 293.9 | 300.9 |
| Index of housing price appreciation, 1 unit building | 100.0 | 211.0 | 172.4 | 267.0 | 275.1 | 286.6 |
| Index of housing price appreciation, 2-4 unit building | 100.0 | 231.1 | 169.1 | 304.3 | 315.7 | 322.4 |
| Index of housing price appreciation, 5+ unit building | 100.0 | 238.5 | 217.0 | 524.3 | 478.4 | 485.7 |
| Index of housing price appreciation, condominium | 100.0 | 216.2 | 207.7 | 310.5 | 302.0 | 307.5 |
| Median sales price per unit, 1 unit building (2021$) | — | $604,340 | $503,380 | $630,500 | $645,730 | $680,000 |
| Median sales price per unit, 2-4 unit building (2021$) | — | $356,270 | $273,050 | $396,690 | $413,270 | $430,000 |
| Median sales price per unit, 5+ unit building (2021$) | — | $137,410 | $122,200 | $262,710 | $231,600 | $234,830 |
| Median sales price per unit, condominium (2021$) | — | $807,810 | $752,410 | $1,014,050 | $904,020 | $987,500 |
| Sales volume, all property types | 33,454 | 53,405 | 27,660 | 26,307 | 22,238 | 35,663 |
| Sales volume, 1 unit building | 13,586 | 16,669 | 7,515 | 8,530 | 7,802 | 10,771 |
| Sales volume, 2-4 unit building | 13,702 | 20,763 | 7,809 | 7,461 | 6,240 | 8,278 |
| Sales volume, 5+ unit building | 1,324 | 2,352 | 1,224 | 953 | 693 | 1,364 |
| Sales volume, condominium | 4,842 | 13,621 | 11,112 | 9,363 | 7,503 | 15,250 |
| Land Use and Development | ||||||
| Population density (1,000 persons per square mile) | — | 27.3 | 27.2 | 27.8 | — | — |
| Units authorized by new residential building permits | 15,544 | 44 | 7,335 | 28,787 | 20,590 | — |
| Units issued new certificates of occupancy | 13,603 | 24,982 | 21,913 | 24,496 | 20,050 | — |
| Neighborhood Services and Conditions | ||||||
| Car-free commute (% of commuters) | 63.8% | 67.3% | 69.4% | 70.5% | — | — |
| Mean travel time to work (minutes) | 40.0 | 39.0 | 38.7 | 41.7 | — | — |
| Serious crime rate (per 1,000 residents) | 23.1 | 15.8 | 12.9 | 11.6 | 11.6 | 12.2 |
| Students performing at grade level in ELA, 4th grade | — | — | — | 49.6% | — | — |
| Students performing at grade level in math, 4th grade | — | — | — | 49.4% | — | — |
| Renters | ||||||
| Median rent, all (2021$) | $1,130 | $1,250 | $1,370 | $1,560 | — | — |
| Median rent, recent movers (2021$) | — | $1,580 | $1,740 | $2,110 | — | — |
| Rental units affordable at 80% AMI (% of recently available units) | — | 52.5% | 44.9% | 40.7% | — | — |
| Rental units affordable at 120% AMI (% of recently available units) | — | 81.7% | 78.1% | 76.0% | — | — |
| Severely rent-burdened households | 23.7% | 27.9% | 29.1% | 26.2% | — | — |
| Severely rent-burdened households, low income households | — | 43.9% | 45.7% | 44.1% | — | — |
| Housing choice vouchers (% of occupied, privately owned rental units) | — | — | 6.9% | 6.1% | 6.0% | — |
| Public housing (% of rental units) | — | — | — | — | — | 7.5% |
| 1 In 2019 some violations types were reclassified into the most serious class, resulting in an increase in this indicator. | ||||||
| New York City Indicators by Race and Ethnicity | ||||
|---|---|---|---|---|
| Asian | Black | Hispanic | White | |
| Demographics | ||||
| Population | 1,201,923 | 2,060,119 | 2,423,588 | 2,655,368 |
| Percentage change since 2000 | 54.0% | 5.0% | 12.2% | −5.2% |
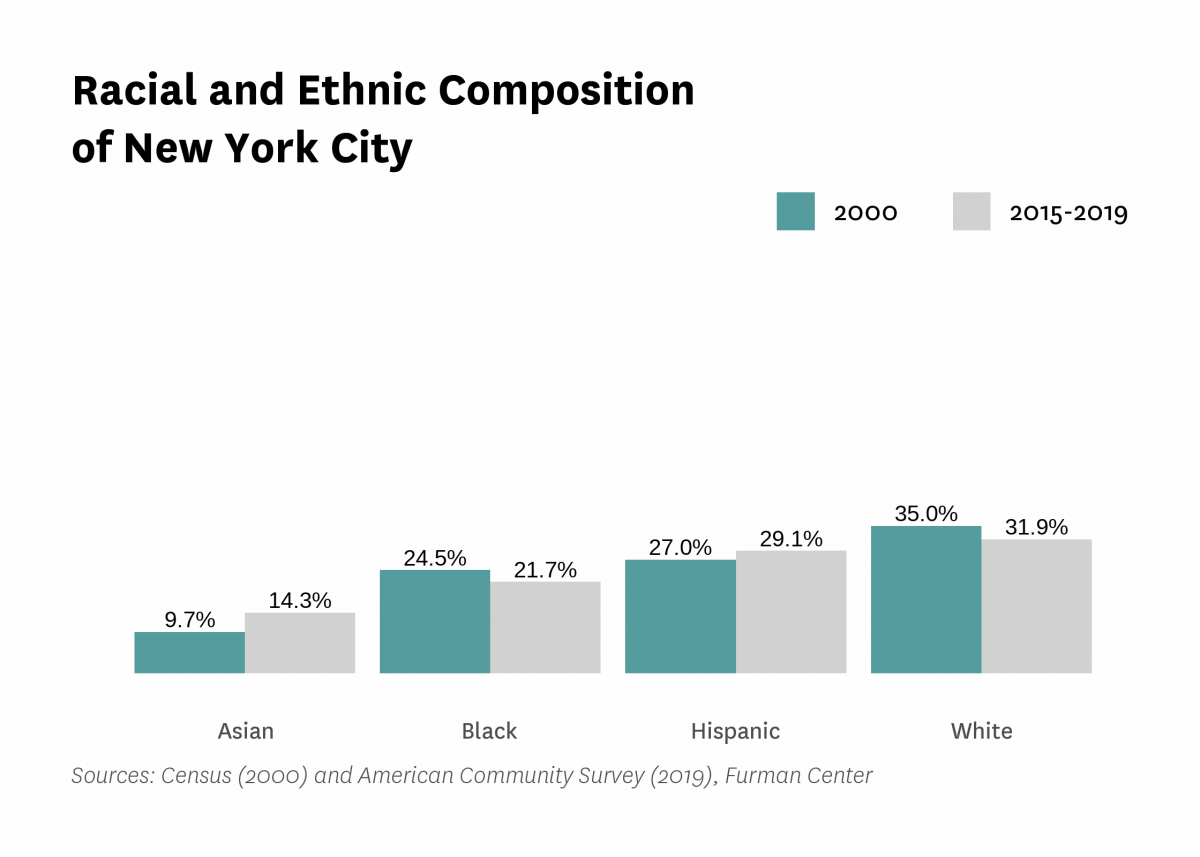
| Share of New York City population | 14.4% | 24.7% | 29.1% | 31.9% |
| Percentage point change since 2000 | 4.7 | 0.2 | 2.1 | −3.1 |
| Foreign-born population1 | 70.6% | 31.5% | 39.1% | 21.5% |
| Percentage point change since 2000 | −7.0 | 2.5 | −2.1 | −1.6 |
| Population under 18 years old1 | 17.3% | 21.7% | 24.9% | 17.0% |
| Percentage point change since 2000 | −13.4 | −7.6 | −5.7 | −1.7 |
| Population aged 65+1 | 23.3% | 19.2% | 27.5% | 12.5% |
| Percentage point change since 2000 | 15.8 | 10.7 | 21.1 | −4.4 |
| Disabled population1 | 4.2% | 10.8% | 10.2% | 5.4% |
| Median household income (2021$) | $79,042 | $53,715 | $49,554 | $106,697 |
| Percentage change since 1999 | 20.3% | 8.2% | 11.7% | 31.6% |
| Poverty rate1 | 14.2% | 20.5% | 20.9% | 10.1% |
| Percentage point change since 2000 | −5.4 | −5.2 | −9.8 | −1.4 |
| Poverty rate, population under 18 years old1 | 17.3% | 28.1% | 28.1% | 14.0% |
| Percentage point change since 2000 | −6.7 | −5.8 | −11.9 | −2.2 |
| Poverty rate, population aged 65+1 | 23.3% | 19.2% | 27.5% | 12.5% |
| Percentage point change since 2000 | −1.0 | −4.0 | −2.5 | 0.7 |
| Unemployment rate1 | 4.1% | 7.5% | 6.6% | 3.3% |
| Percentage point change since 2000 | −2.3 | −6.7 | −7.2 | −2.0 |
| Population aged 25+ with a bachelor's degree or higher1 | 43.3% | 24.2% | 19.8% | 61.8% |
| Percentage point change since 2000 | 7.1 | 8.4 | 9.3 | 19.9 |
| Population aged 25+ without a high school diploma1 | 22.8% | 15.5% | 29.0% | 6.0% |
| Percentage point change since 2000 | −7.8 | −14.1 | −17.5 | −9.2 |
| Housing Market and Conditions | ||||
| Homeownership rate1 | 42.2% | 26.6% | 15.9% | 41.2% |
| Percentage point change since 2000 | 7.6 | 2.1 | 1.9 | 4.7 |
| Severe crowding rate (% of renter households) | 8.2% | 3.3% | 5.6% | 2.7% |
| Share of home purchase loans2 | 32.6% | 10.8% | 9.9% | 45.0% |
| Percentage point change since 2006 | 0.1 | −0.1 | −0.1 | 0.0 |
| Share of refinance loans3 | 19.4% | 13.5% | 9.4% | 56.4% |
| Percentage point change since 2006 | 0.1 | −0.2 | −0.1 | 0.2 |
| Neighborhood Services and Conditions | ||||
| Car-free commute (% of commuters) | 67.7% | 69.0% | 73.5% | 70.0% |
| Mean travel time to work (minutes) | 41.4 | 48.3 | 42.6 | 37.4 |
| Students performing at grade level in ELA, 4th grade | 69.9% | 37.6% | 38.8% | 67.9% |
| Students performing at grade level in math, 4th grade | 77.5% | 31.6% | 37.0% | 69.9% |
| Renters | ||||
| Median rent burden | 34.0% | 32.5% | 35.5% | 27.6% |
| Moderately rent-burdened households | 22.6% | 23.9% | 27.4% | 21.5% |
| Severely rent-burdened households | 29.5% | 29.0% | 31.5% | 21.3% |
| 1 It is not possible to disaggregate the data for Black and Asian New Yorkers by Hispanic ethnicity, therefore some double counting may occur. | ||||
| 2 Values indicate race/ethnic share of all home purchase loans. | ||||
| 3 Values indicate race/ethnic share of all refinance loans. | ||||
All content © 2005 – 2024 Furman Center for Real Estate and Urban Policy | Top of page | Contact Us