| Indicator | 2000 | 2006 | 2010 | 2019 | 2021 | 2022 |
|---|---|---|---|---|---|---|
| Population | ||||||
| Born in New York State | 71.8% | 64.7% | 63.4% | 65.2% | ||
| Disabled population | 8.6% | 16.0% | 11.0% | |||
| Foreign-born population | 15.8% | 16.7% | 20.8% | 24.3% | 22.4% | |
| Population | 111,661 | 114,081 | 109,482 | 110,883 | 124,141 | |
| Population aged 65+ | 18.5% | 19.9% | 21.3% | 23.9% | 21.5% | |
| Households | ||||||
| Households with children under 18 years old | 29.4% | 24.8% | 24.9% | 21.9% | 24.5% | |
| Single-person households | 34.9% | 36.1% | 40.4% | 31.6% | ||
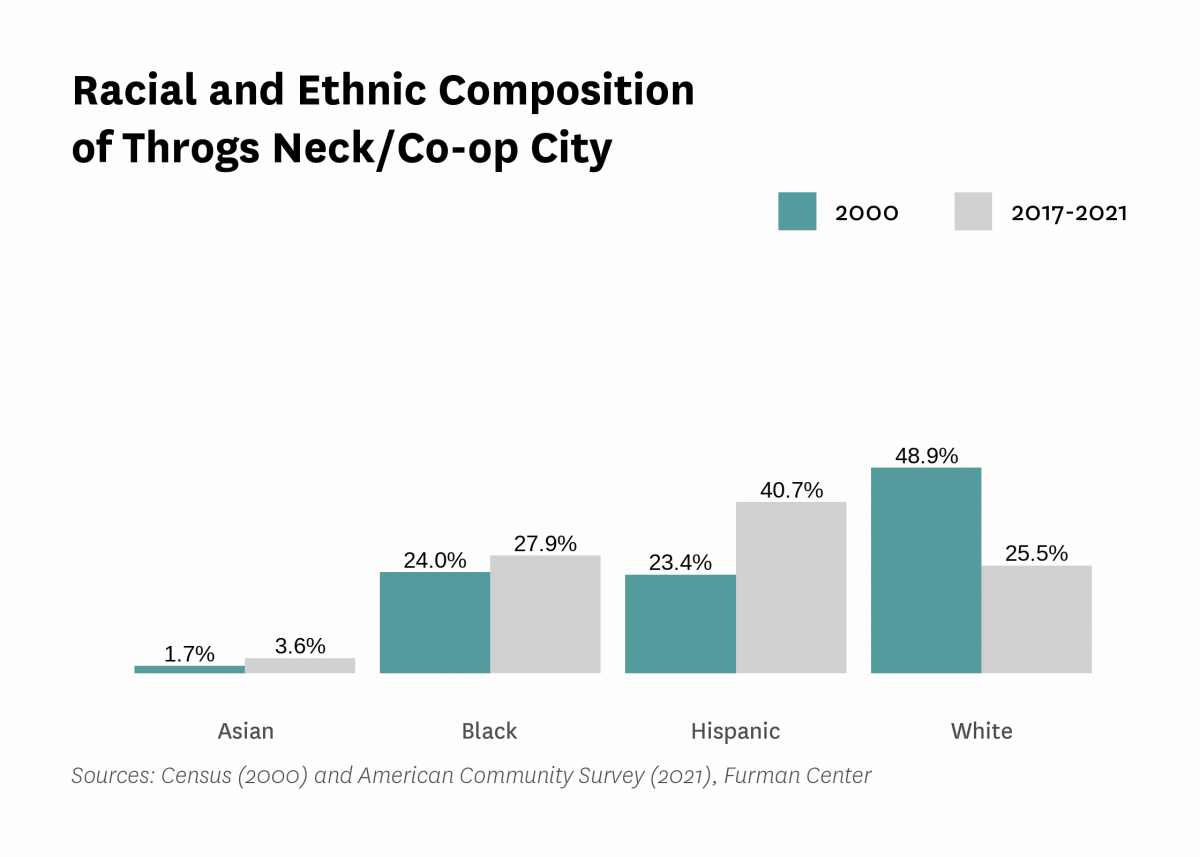
| Race and Ethnicity | ||||||
| Percent Asian | 1.7% | 2.5% | 2.0% | 3.8% | 3.6% | |
| Percent Black | 24.0% | 23.2% | 27.5% | 22.0% | 27.9% | |
| Percent Hispanic | 23.4% | 25.4% | 31.1% | 43.9% | 40.7% | |
| Percent white | 48.9% | 47.2% | 37.7% | 27.8% | 25.5% | |
| Racial diversity index | 0.65 | 0.66 | 0.69 | 0.68 | 0.69 | |
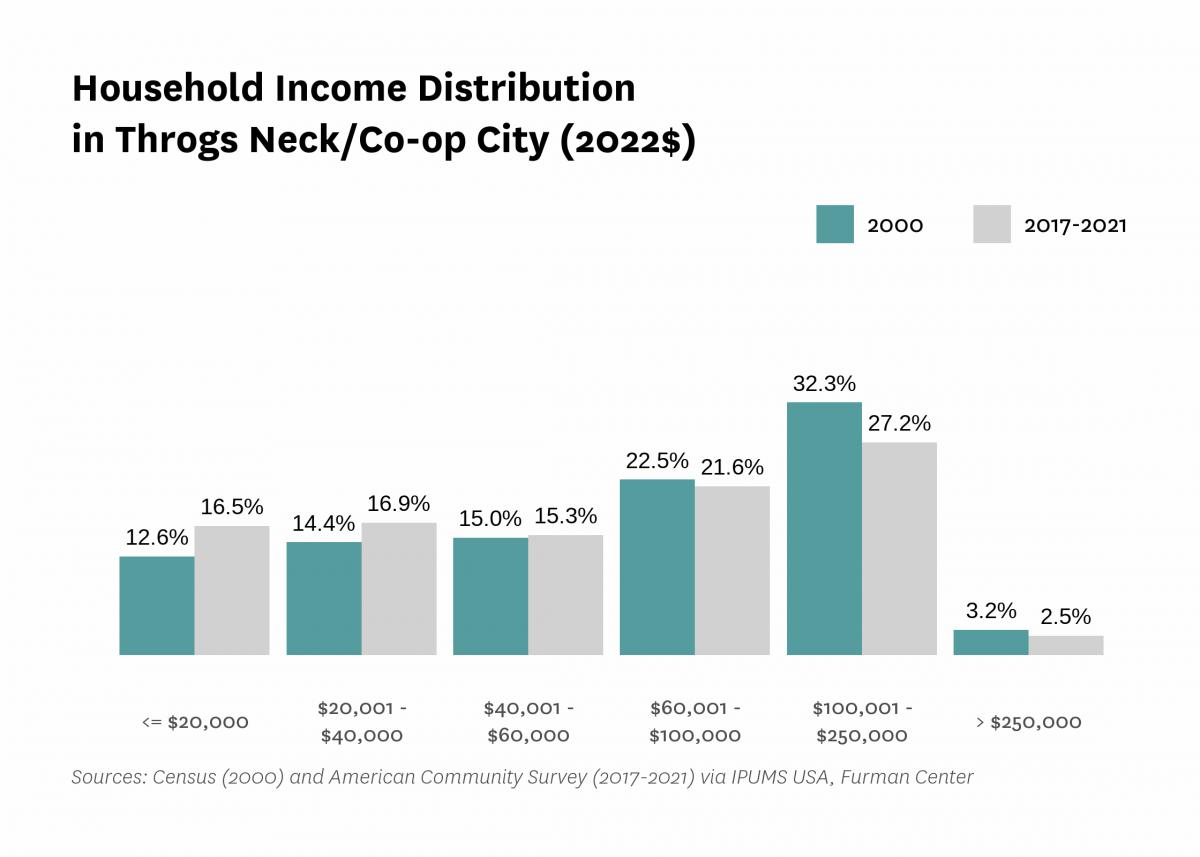
| Income and Poverty | ||||||
| Income diversity ratio | 4.7 | 4.8 | 5.1 | 4.3 | ||
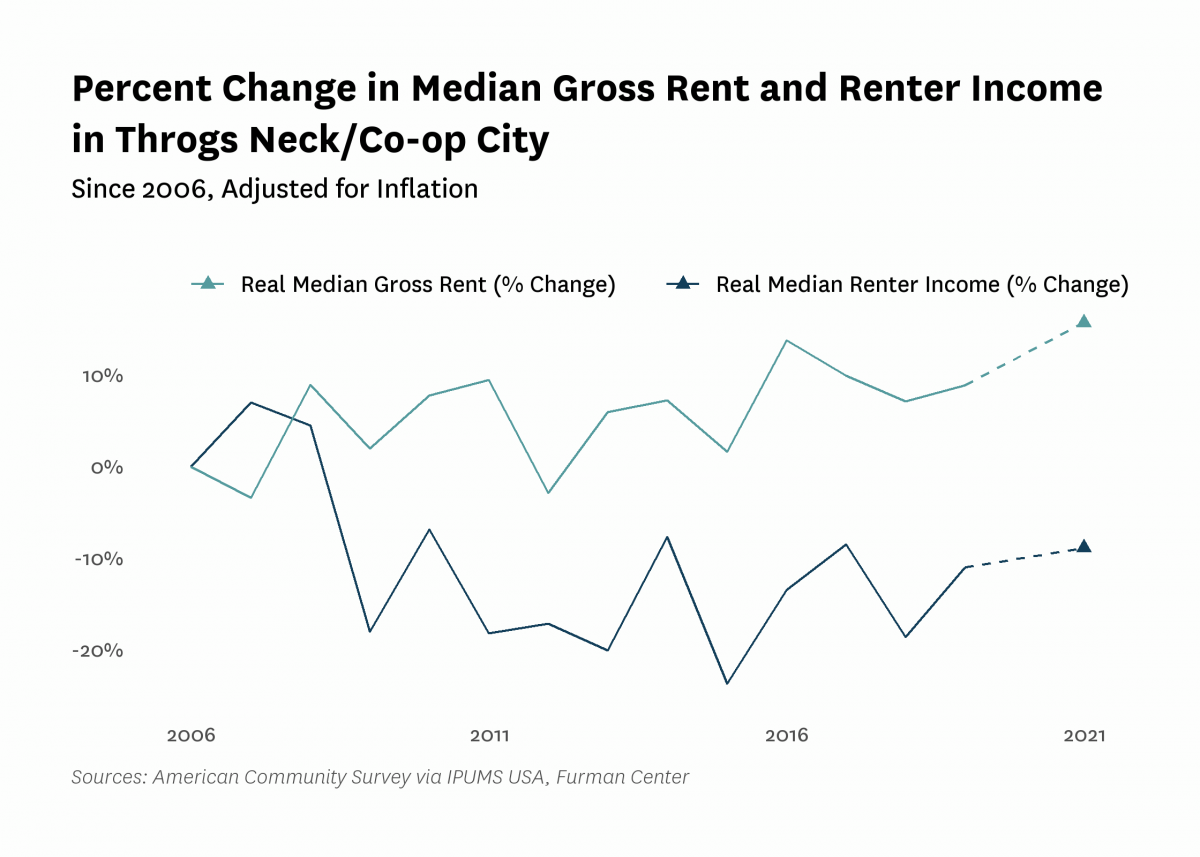
| Median household income (2022$) | $77,270 | $72,760 | $60,810 | $68,040 | $60,490 | |
| Median household income, homeowners (2022$) | $87,950 | $73,340 | $86,010 | $73,820 | ||
| Median household income, renters (2022$) | $57,720 | $53,770 | $51,380 | $52,600 | ||
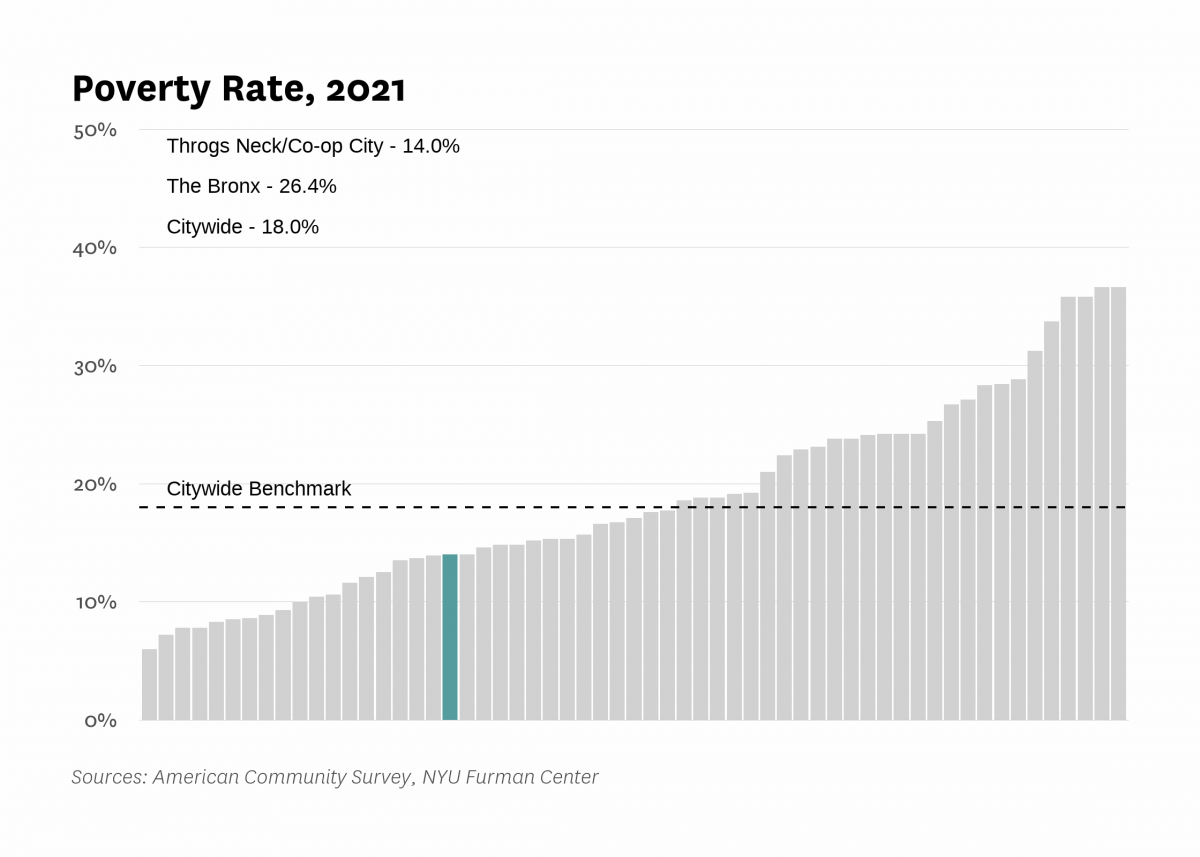
| Poverty rate | 10.1% | 9.9% | 16.4% | 12.9% | 14.0% | |
| Poverty rate, population aged 65+ | 9.1% | 10.0% | 16.0% | 10.7% | ||
| Poverty rate, population under 18 years old | 12.0% | 37.4% | 13.6% | 16.6% | ||
| Labor Market | ||||||
| Labor force participation rate | 57.1% | 59.1% | 55.7% | 57.9% | ||
| Population aged 25+ without a high school diploma | 18.7% | 19.6% | 20.1% | 10.5% | ||
| Unemployment rate | 6.39% | 9.17% | 10.74% | 4.50% | 9.50% | |
| Indicator | 2000 | 2006 | 2010 | 2019 | 2021 | 2022 |
|---|---|---|---|---|---|---|
| Housing Stock | ||||||
| Homeownership rate | 45.5% | 57.3% | 41.5% | 46.7% | 42.3% | |
| Housing units | 46,355 | 48,438 | 48,074 | 52,651 | ||
| Rental vacancy rate | 1.8% | 1.4% | 1.3% | |||
| Serious housing code violations (per 1,000 privately owned rental units) | 18.0 | 27.5 | 66.1 | 72.7 | 85.6 | |
| Severe crowding rate (% of renter households) | 1.2% | 2.5% | 1.9% | |||
| Total housing code violations (per 1,000 privately owned rental units) | 102.6 | 132.7 | 248.8 | 354.3 | 351.5 | |
| Finance - Distress | ||||||
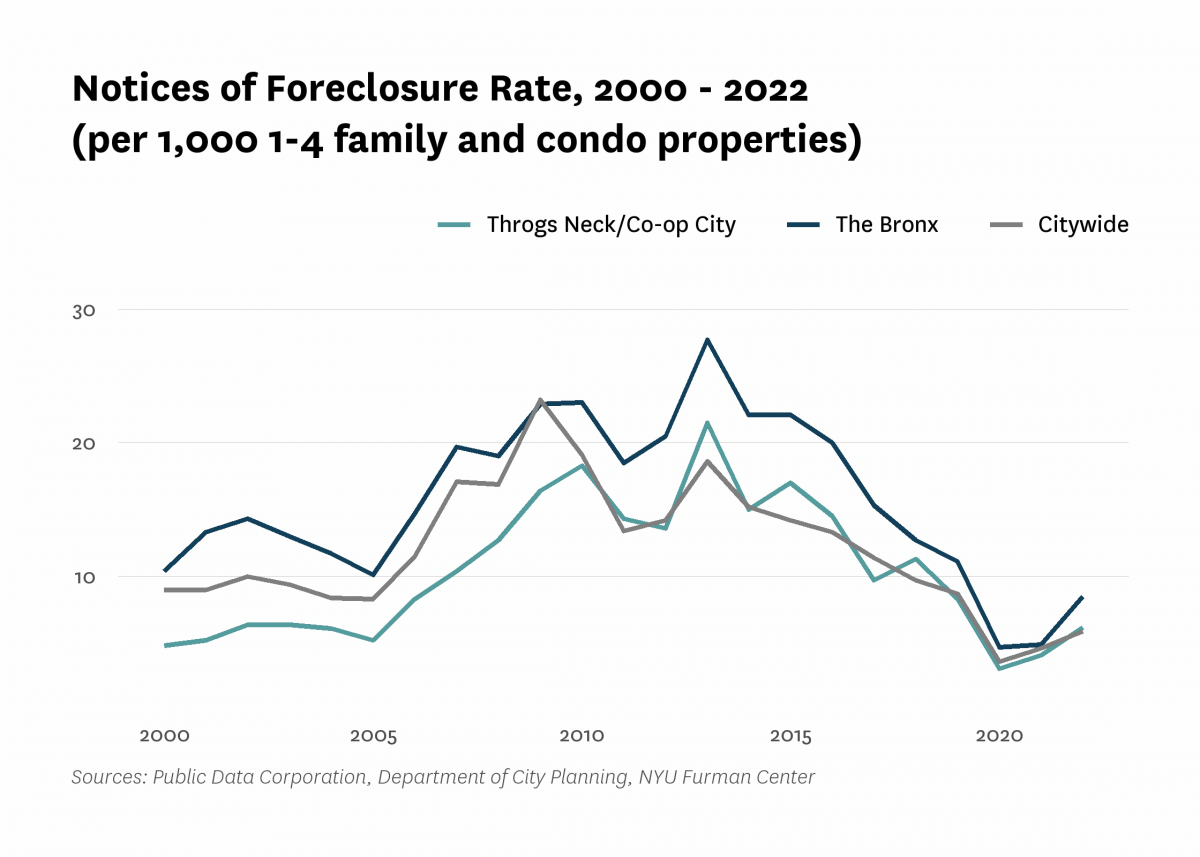
| Notices of foreclosure rate (per 1,000 1-4 family and condo properties) | 4.8 | 8.3 | 18.3 | 8.3 | 4.1 | 6.2 |
| Notices of foreclosure, all residential properties | 62 | 116 | 249 | 115 | 57 | 87 |
| Notices of foreclosure, initial, 1-4 family and condo properties | 48 | 87 | 200 | 55 | 21 | 31 |
| Notices of foreclosure, repeat, 1-4 family and condo properties | 12 | 24 | 47 | 58 | 35 | 54 |
| Pre-foreclosure notice rate (per 1,000 1-4 family and condo properties) | 55.3 | 22.7 | 50.9 | |||
| Pre-foreclosure notices, 1-4 family and condo properties | 754 | 310 | 693 | |||
| Properties entering REO, 1-4 family | 6 | 3 | 18 | |||
| Finance - Lending | ||||||
| FHA/VA-backed home purchase loans (% of home purchase loans) | 0.3% | 34.2% | 24.0% | 24.4% | ||
| Higher-cost home purchase loans (% of home purchase loans) | 21.2% | 0.0% | 10.3% | 5.8% | ||
| Higher-cost refinance loans (% of refinance loans) | 30.8% | 2.1% | 2.7% | 0.7% | ||
| Home purchase loan rate (per 1,000 properties) | 29.7 | 12.5 | 14.6 | 17.7 | ||
| Home purchase loans in LMI tracts (% of home purchase loans) | 2.6% | 21.4% | 11.4% | 8.4% | ||
| Home purchase loans to LMI borrowers (% of home purchase loans) | 19.2% | 1.5% | 14.6% | 11.2% | ||
| Refinance loan rate (per 1,000 properties) | 26.5 | 9.0 | 10.9 | 26.8 | ||
| Sales - Volume | ||||||
| Sales volume, 1 family building | 195 | 273 | 120 | 183 | 235 | 235 |
| Sales volume, 2-4 family building | 174 | 365 | 131 | 195 | 217 | 297 |
| Sales volume, 5+ family building | 5 | 18 | 7 | 5 | 9 | 14 |
| Sales volume, condominium | 18 | 84 | 19 | 60 | 48 | 49 |
| Sales volume, all property types | 392 | 740 | 277 | 443 | 509 | 595 |
| Sales - Median Prices | ||||||
| Median sales price per unit, 1 family building (2022$) | $373,870 | $632,370 | $502,170 | $585,350 | $626,010 | $632,000 |
| Median sales price per unit, 2-4 family building (2022$) | $203,930 | $368,880 | $276,840 | $345,640 | $395,230 | $365,000 |
| Median sales price per unit, 5+ family building (2022$) | $80,920 | $156,920 | $102,270 | $234,140 | $175,830 | $161,190 |
| Median sales price per unit, condominium (2022$) | $322,890 | $646,420 | $389,500 | $467,720 | $490,720 | $492,500 |
| Sales - Housing Price Index | ||||||
| Index of housing price appreciation, 1 family building | 100.0 | 210.6 | 173.7 | 235.7 | 271.2 | 279.9 |
| Index of housing price appreciation, 2-4 family building | 100.0 | 192.1 | 160.6 | 232.6 | 261.4 | 285.2 |
| Index of housing price appreciation, 5+ family building | 100.0 | 214.7 | 183.1 | 480.8 | 400.1 | 342.0 |
| Index of housing price appreciation, condominium | 100.0 | 183.8 | 116.0 | 159.8 | 196.6 | 199.0 |
| Index of housing price appreciation, all property types | 100.0 | 202.0 | 165.3 | 227.1 | 260.5 | 274.4 |
| Subsidized Housing | ||||||
| Total number of subsidized properties (properties) | 42 | |||||
| HUD Financing or Insurance (properties) | 2 | |||||
| HUD Financing or Insurance (units) | 180 | |||||
| HUD Project-based Rental Assistance Program (properties) | 4 | |||||
| HUD Project-based Rental Assistance Program (units) | 201 | |||||
| Low Income Housing Tax Credit (properties) | 5 | |||||
| Low Income Housing Tax Credit (units) | 381 | |||||
| Public Housing (properties) | 8 | |||||
| Public Housing (units) | 2,205 | |||||
| Mitchell-Lama (properties) | 4 | |||||
| Mitchell-Lama (units) | 15,650 | |||||
| 421-a Tax Exemption (properties) | 57 | |||||
| 421-a Tax Exemption (units) | 667 | |||||
| 420-c Tax Exemption (properties) | 3 | |||||
| 420-c Tax Exemption (units) | 423 | |||||
| NYC Housing Production Programs and Zoning Incentives or Requirements (properties) | 15 | |||||
| Eligible to expire from housing programs between 2023 and 2028 (properties) | 3 | |||||
| Eligible to expire from housing programs between 2023 and 2028 (units) | 201 | |||||
| Eligible to expire from housing programs between 2029 and 2038 (properties) | 1 | |||||
| Eligible to expire from housing programs between 2029 and 2038 (units) | 0 | |||||
| Eligible to expire from housing programs in 2039 and later (properties) | 5 | |||||
| Eligible to expire from housing programs in 2039 and later (units) | 381 | |||||
| Indicator | 2000 | 2006 | 2010 | 2019 | 2021 | 2022 |
|---|---|---|---|---|---|---|
| Density | ||||||
| Population density (1,000 persons per square mile) | 12.3 | 11.8 | 11.9 | 13.4 | ||
| Development | ||||||
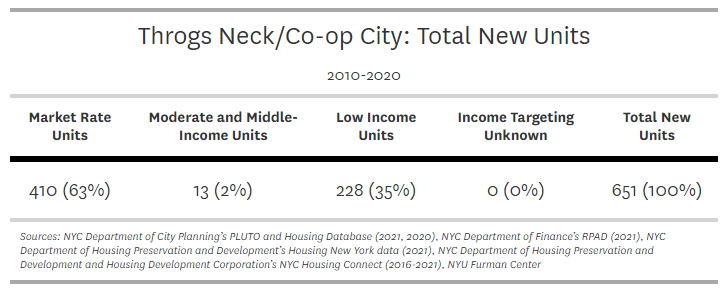
| Units authorized by new residential building permits | 236 | 0 | 20 | 69 | 19 | 204 |
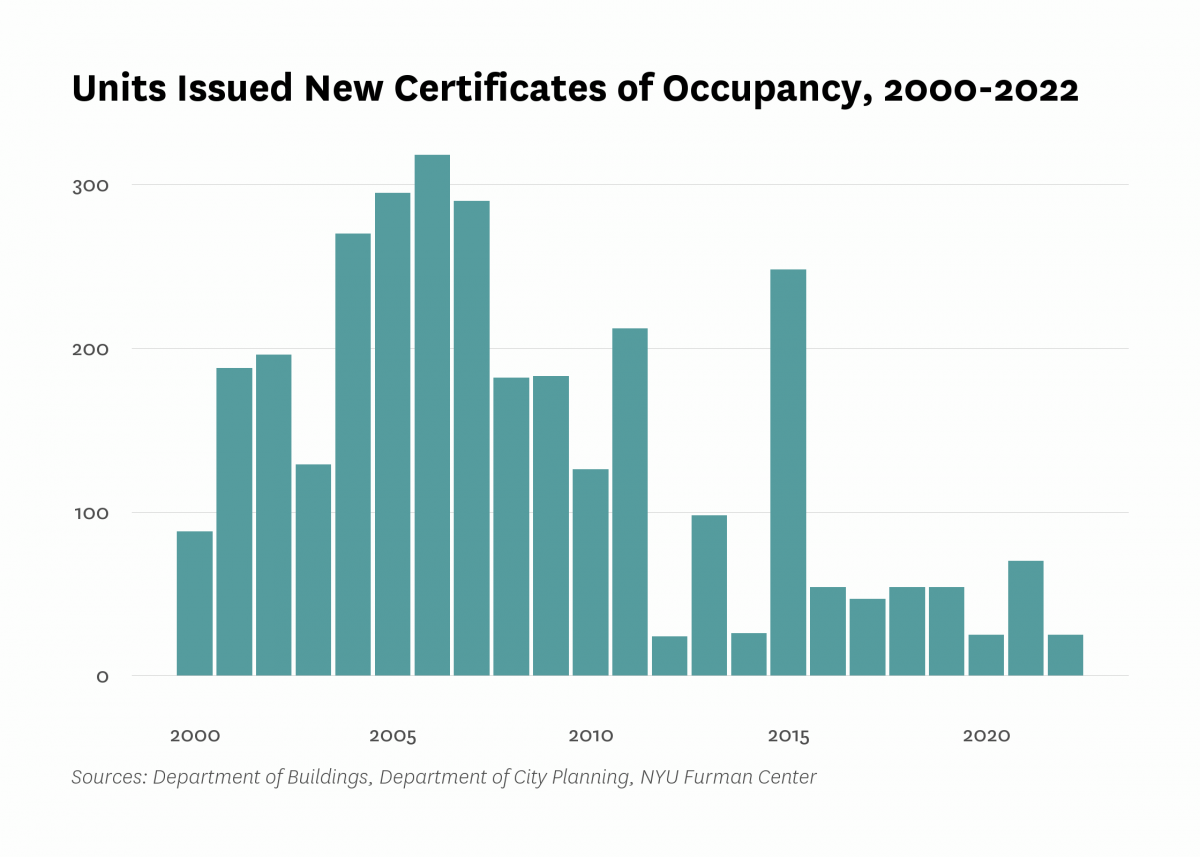
| Units issued new certificates of occupancy | 88 | 318 | 126 | 54 | 70 | 25 |
| Indicator | 2000 | 2006 | 2010 | 2019 | 2021 | 2022 |
|---|---|---|---|---|---|---|
| Commute | ||||||
| Car-free commute (% of commuters) | 42.9% | 43.6% | 45.8% | 48.5% | 56.3% | |
| Mean travel time to work (minutes) | 41.6 | 40.4 | 41.4 | 43.7 | 44.7 | |
| Crime and Incarceration | ||||||
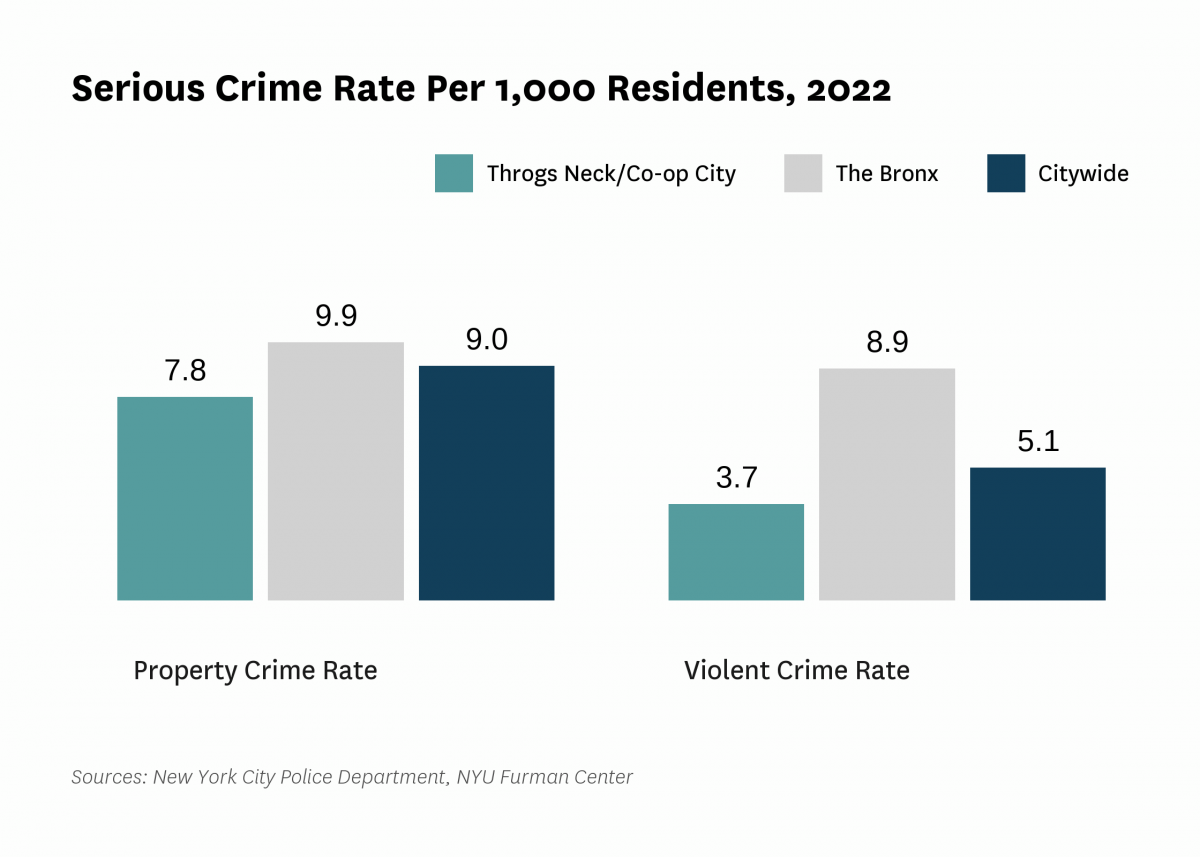
| Serious crime rate (per 1,000 residents) | 12.3 | 11.7 | 9.4 | 10.1 | 11.5 | |
| Serious crime rate, property (per 1,000 residents) | 9.0 | 8.2 | 6.2 | 7.1 | 7.8 | |
| Serious crime rate, violent (per 1,000 residents) | 3.2 | 3.5 | 3.2 | 3.1 | 3.7 | |
| Schools | ||||||
| Students performing at grade level in English language arts, 4th grade | 52.5% | 38.8% | ||||
| Students performing at grade level in math, 4th grade | 45.7% | 32.0% | ||||
| Indicator | 2000 | 2006 | 2010 | 2019 | 2021 | 2022 |
|---|---|---|---|---|---|---|
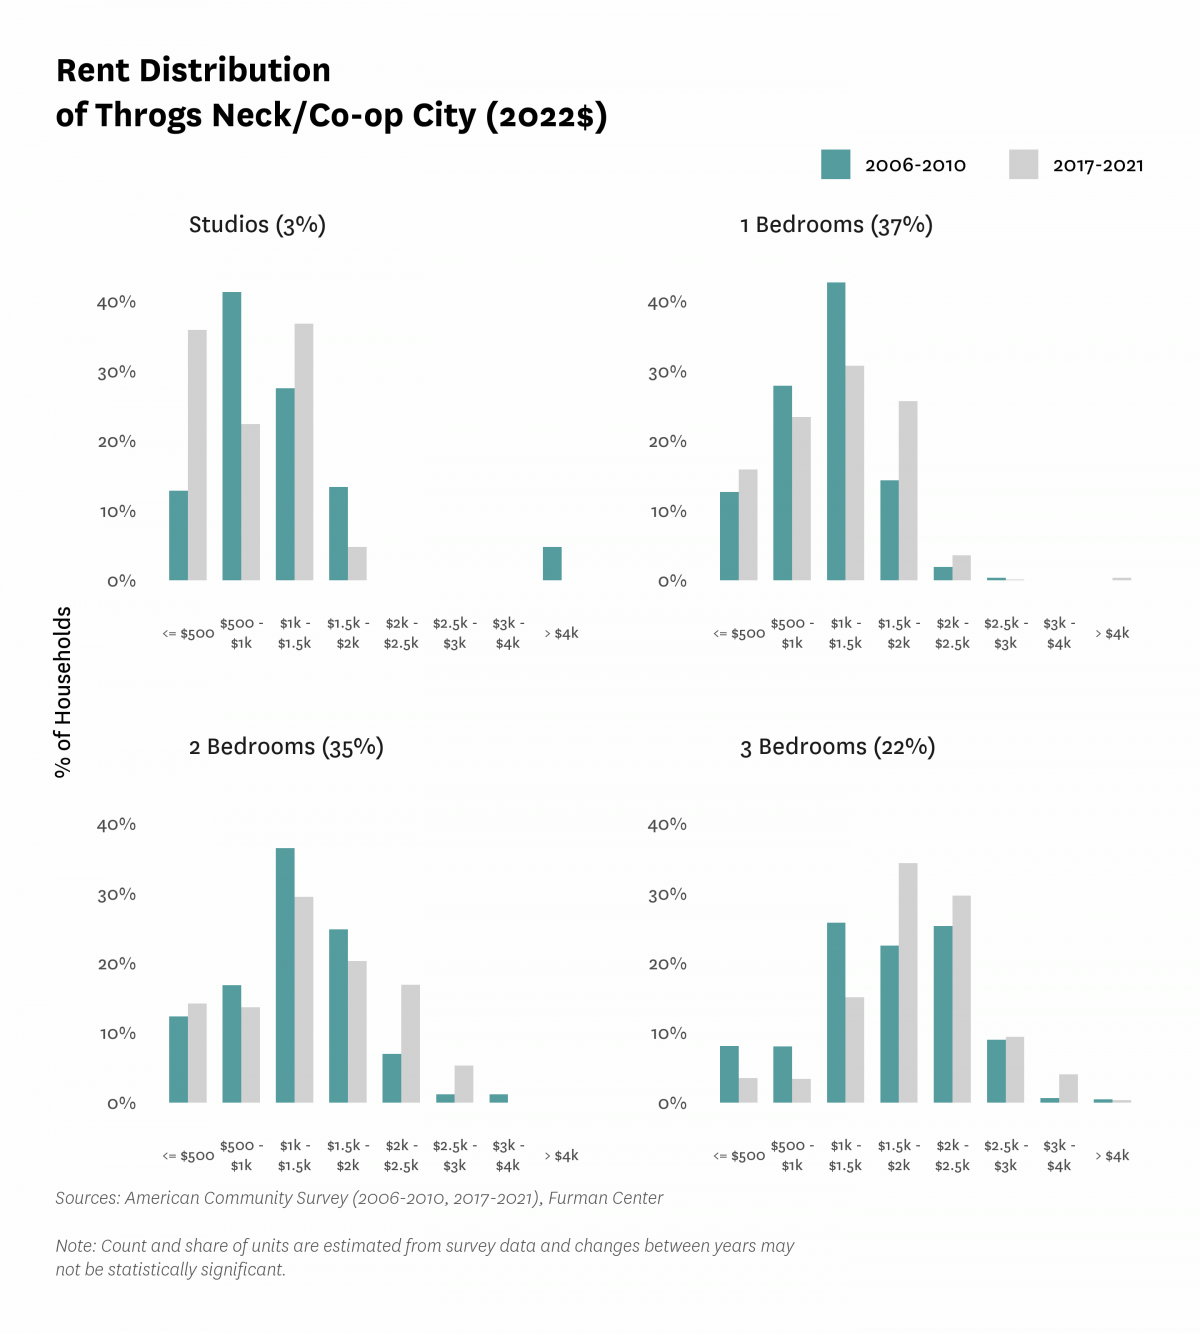
| Median Rent | ||||||
| Median rent, 2- and 3-bedrooms (2022$) | $1,430 | $1,560 | $1,630 | |||
| Median rent, all (2022$) | $1,120 | $1,240 | $1,330 | $1,350 | $1,430 | |
| Median rent, recent movers (2022$) | $1,580 | $1,750 | $1,830 | |||
| Median rent, studios and 1-bedrooms (2022$) | $1,110 | $1,010 | $1,100 | |||
| Change in collected rent (2019-2020) | 3.0% | |||||
| Affordability | ||||||
| Rental units affordable at 30% AMI (% of recently available units) | ||||||
| Rental units affordable at 80% AMI (% of recently available units) | ||||||
| Rental units affordable at 120% AMI (% of recently available units) | ||||||
| Rent Burden | ||||||
| Moderately rent-burdened households | 12.8% | 16.4% | 31.2% | 25.5% | ||
| Moderately rent-burdened households, low income | 27.0% | 28.6% | 30.3% | |||
| Moderately rent-burdened households, moderate income | 9.1% | 4.5% | 3.5% | |||
| Severely rent-burdened households | 18.8% | 23.7% | 25.9% | 24.7% | ||
| Severely rent-burdened households, low income | 39.5% | 41.9% | 35.9% | |||
| Severely rent-burdened households, moderate income | 0.0% | 0.0% | 0.5% | |||
| Rental Subsidy | ||||||
| Housing choice vouchers (% of occupied, privately owned rental units) | 3.7% | 4.3% | ||||
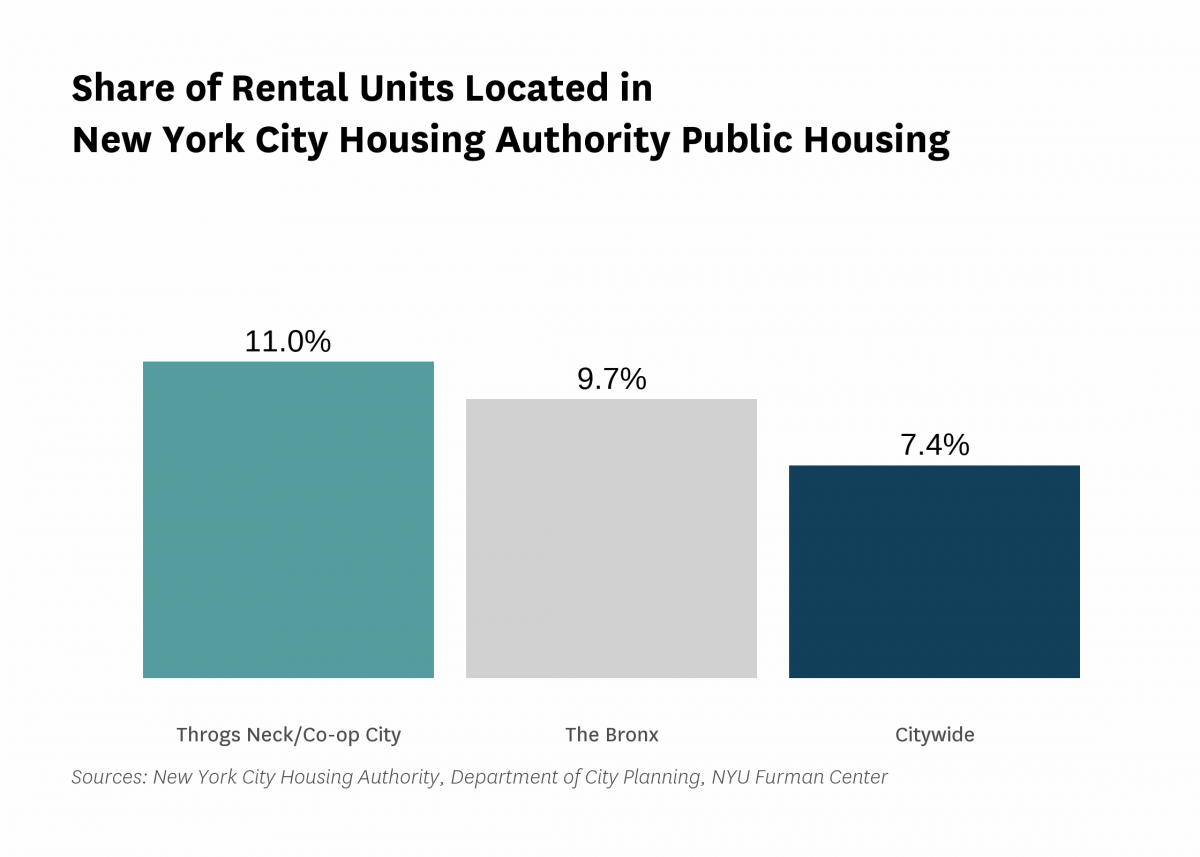
| Public housing (% of rental units) | 11.0% | |||||

Data Notes: See CoreData User Guide for more information about indicator definitions and methods.
Indicators: The rental vacancy rate, severe crowding rate, and the severely rent-burdened households indicators use five-year American Community Survey (ACS) estimates. Data under the 2010 heading comes from the 2006 – 2010 ACS, data under the 2019 heading comes from the 2015 – 2019 ACS and data under the 2021 heading comes from 2017 – 2021 ACS .
All content © 2005 – 2024 Furman Center for Real Estate and Urban Policy | Top of page | Contact Us