| Indicator | 2000 | 2006 | 2010 | 2019 | 2021 | 2022 |
|---|---|---|---|---|---|---|
| Population | ||||||
| Born in New York State | 54.2% | 51.9% | 53.4% | 53.4% | ||
| Disabled population | 12.2% | 13.4% | 13.4% | |||
| Foreign-born population | 29.3% | 31.8% | 34.3% | 33.7% | 33.7% | |
| Population | 1,327,690 | 1,361,473 | 1,386,657 | 1,418,207 | 1,424,948 | |
| Population aged 65+ | 10.1% | 10.3% | 10.6% | 13.4% | 14.0% | |
| Households | ||||||
| Households with children under 18 years old | 43.8% | 41.3% | 41.3% | 32.9% | 33.3% | |
| Single-person households | 29.9% | 29.2% | 34.6% | 31.6% | ||
| Race and Ethnicity | ||||||
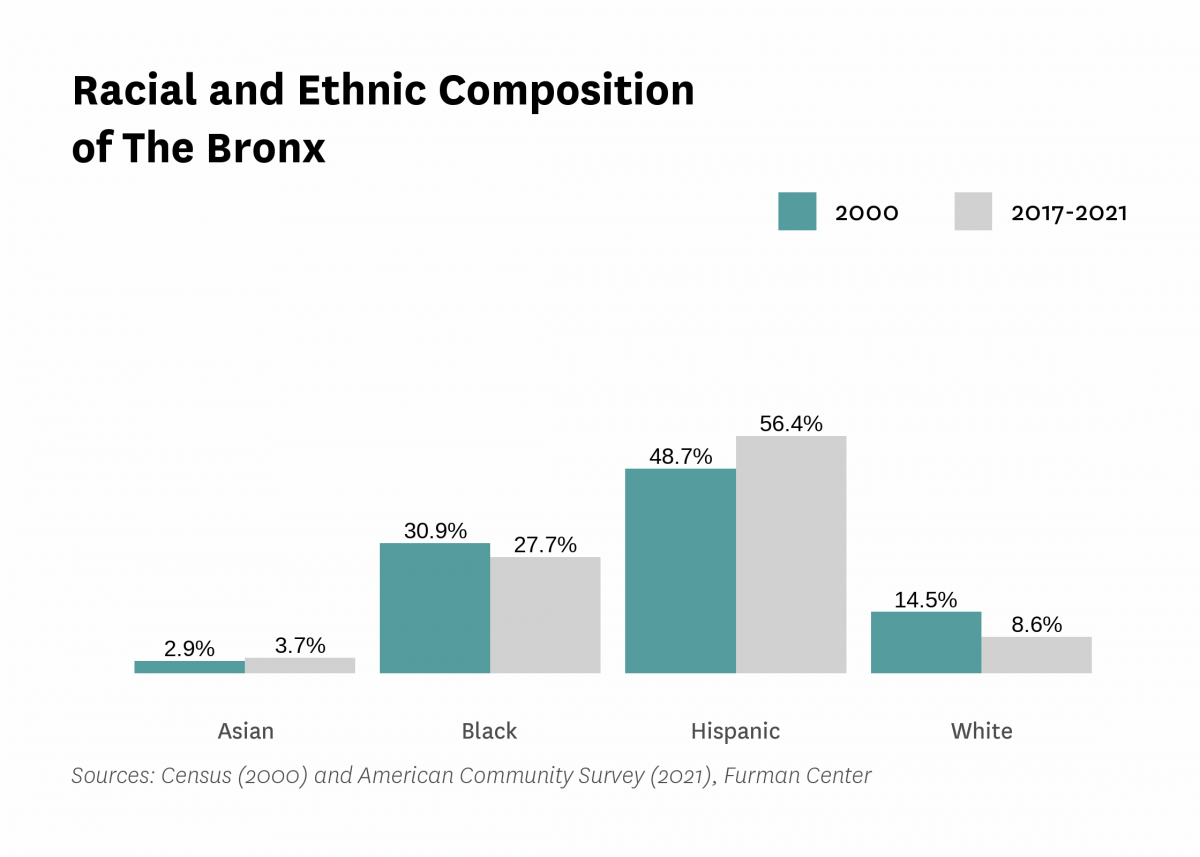
| Percent Asian | 2.9% | 3.3% | 3.4% | 3.7% | 3.7% | |
| Percent Black | 30.9% | 30.8% | 30.5% | 29.0% | 27.7% | |
| Percent Hispanic | 48.7% | 51.0% | 53.6% | 56.4% | 56.4% | |
| Percent white | 14.5% | 12.9% | 10.9% | 8.8% | 8.6% | |
| Racial diversity index | 0.65 | 0.63 | 0.61 | 0.59 | 0.60 | |
| Income and Poverty | ||||||
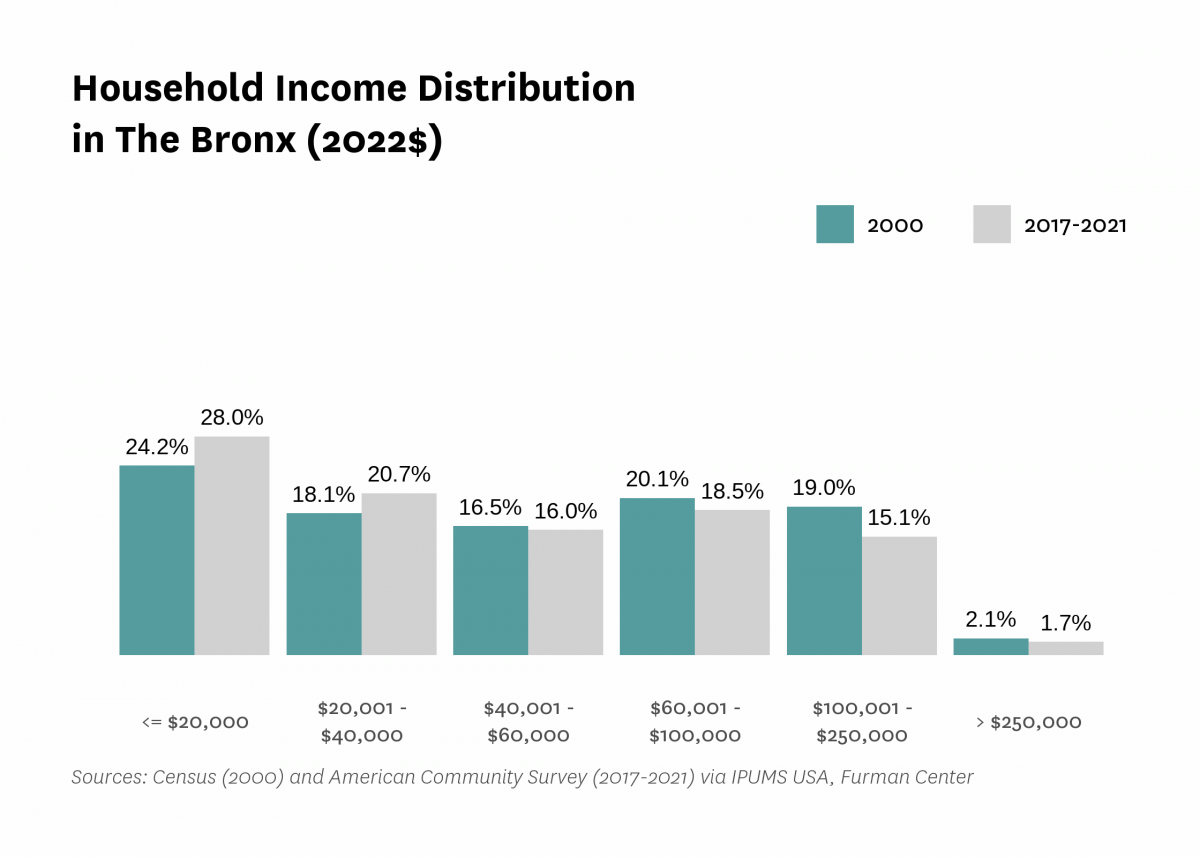
| Income diversity ratio | 5.7 | 5.8 | 6.5 | 6.4 | ||
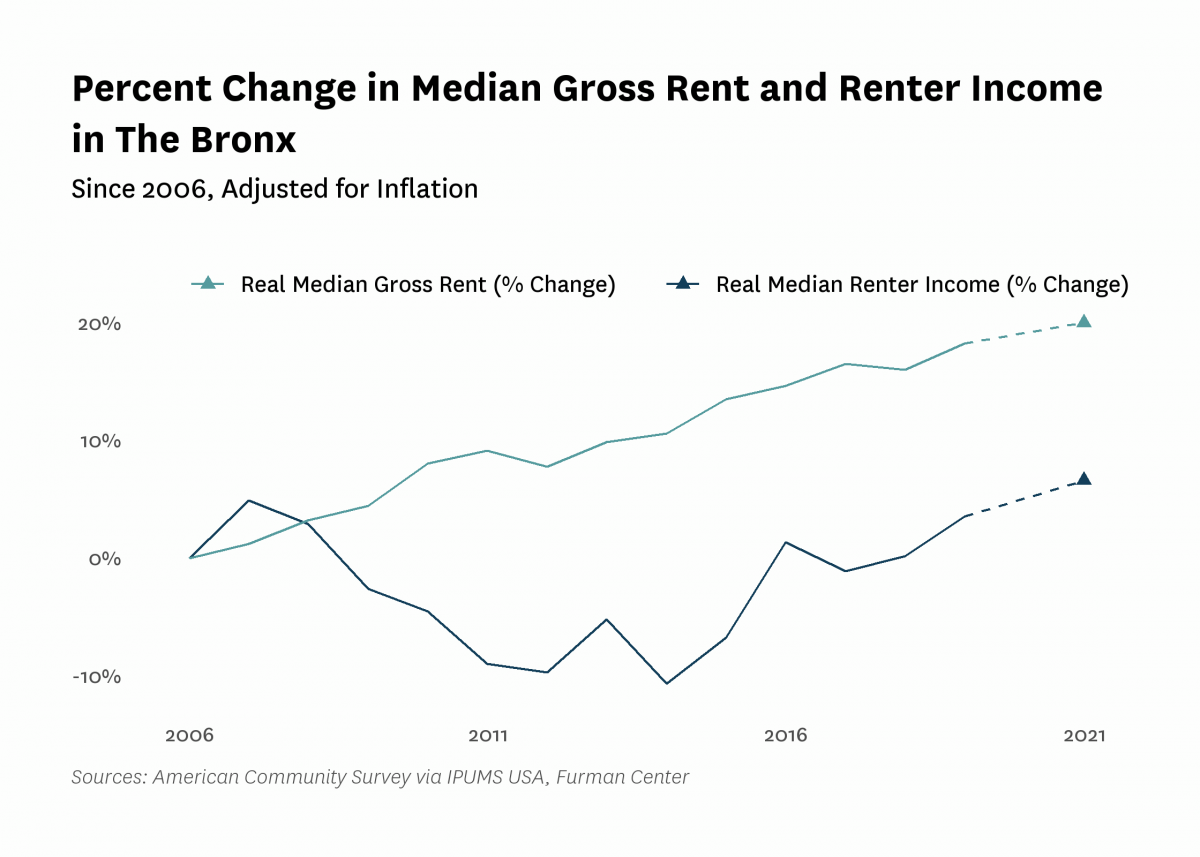
| Median household income (2022$) | $48,380 | $44,260 | $41,940 | $46,190 | $45,640 | |
| Median household income, homeowners (2022$) | $87,250 | $86,220 | $97,010 | $91,230 | ||
| Median household income, renters (2022$) | $36,510 | $34,870 | $37,800 | $38,920 | ||
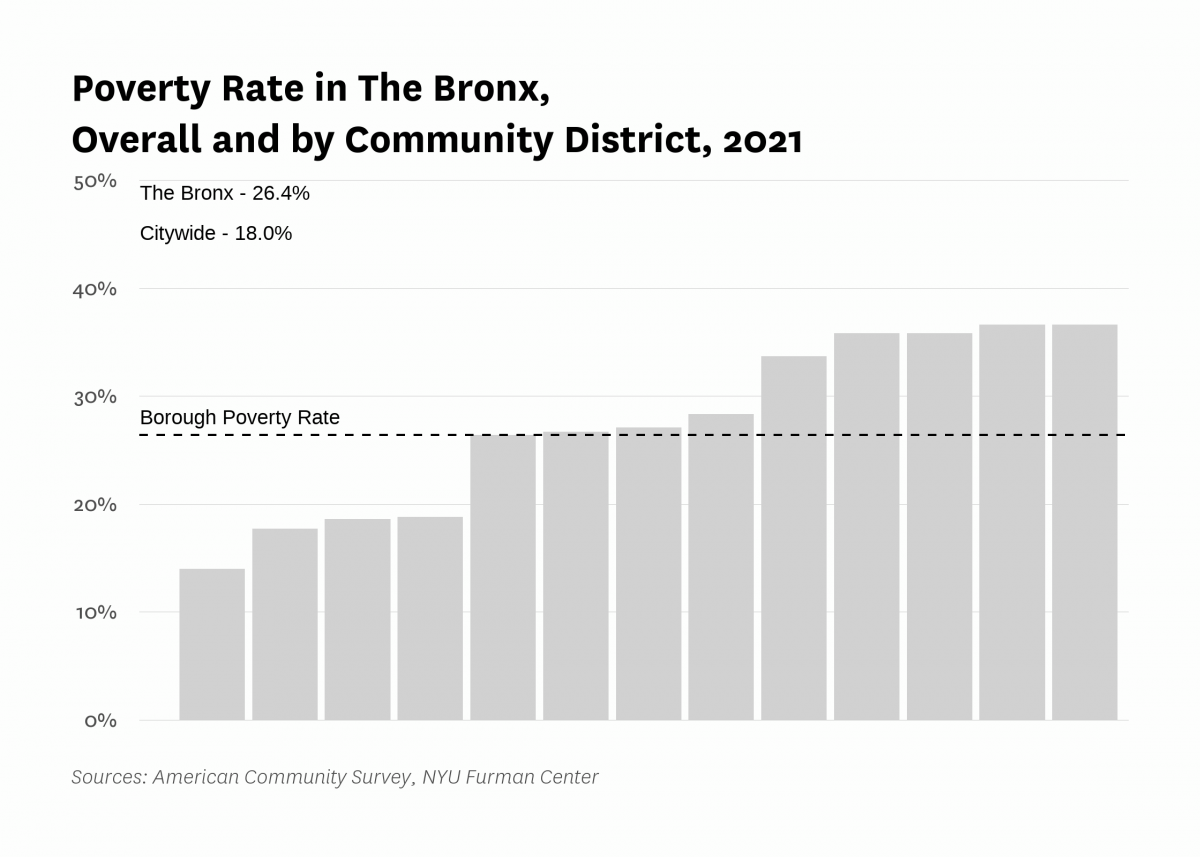
| Poverty rate | 30.7% | 29.1% | 30.2% | 26.4% | 26.4% | |
| Poverty rate, population aged 65+ | 22.6% | 22.5% | 25.2% | 25.2% | ||
| Poverty rate, population under 18 years old | 41.3% | 43.0% | 37.1% | 34.4% | ||
| Labor Market | ||||||
| Labor force participation rate | 58.0% | 58.7% | 59.2% | 58.1% | ||
| Population aged 25+ with a bachelor's degree or higher | 14.6% | 16.4% | 16.9% | 20.4% | 23.0% | |
| Population aged 25+ without a high school diploma | 31.6% | 30.8% | 25.6% | 24.1% | ||
| Unemployment rate | 14.32% | 11.76% | 15.76% | 9.07% | 16.07% | |
| Indicator | 2000 | 2006 | 2010 | 2019 | 2021 | 2022 |
|---|---|---|---|---|---|---|
| Housing Stock | ||||||
| Homeownership rate | 19.5% | 21.5% | 18.8% | 18.9% | 19.6% | |
| Housing units | 506,396 | 512,024 | 537,197 | 552,421 | ||
| Rental vacancy rate | 3.7% | 2.0% | 1.9% | |||
| Serious housing code violations (per 1,000 privately owned rental units) | 127.5 | 114.2 | 161.2 | 158.8 | 188.4 | |
| Severe crowding rate (% of renter households) | 4.1% | 5.7% | 5.7% | |||
| Total housing code violations (per 1,000 privately owned rental units) | 608.9 | 502.2 | 523.4 | 554.8 | 589.4 | |
| Finance - Distress | ||||||
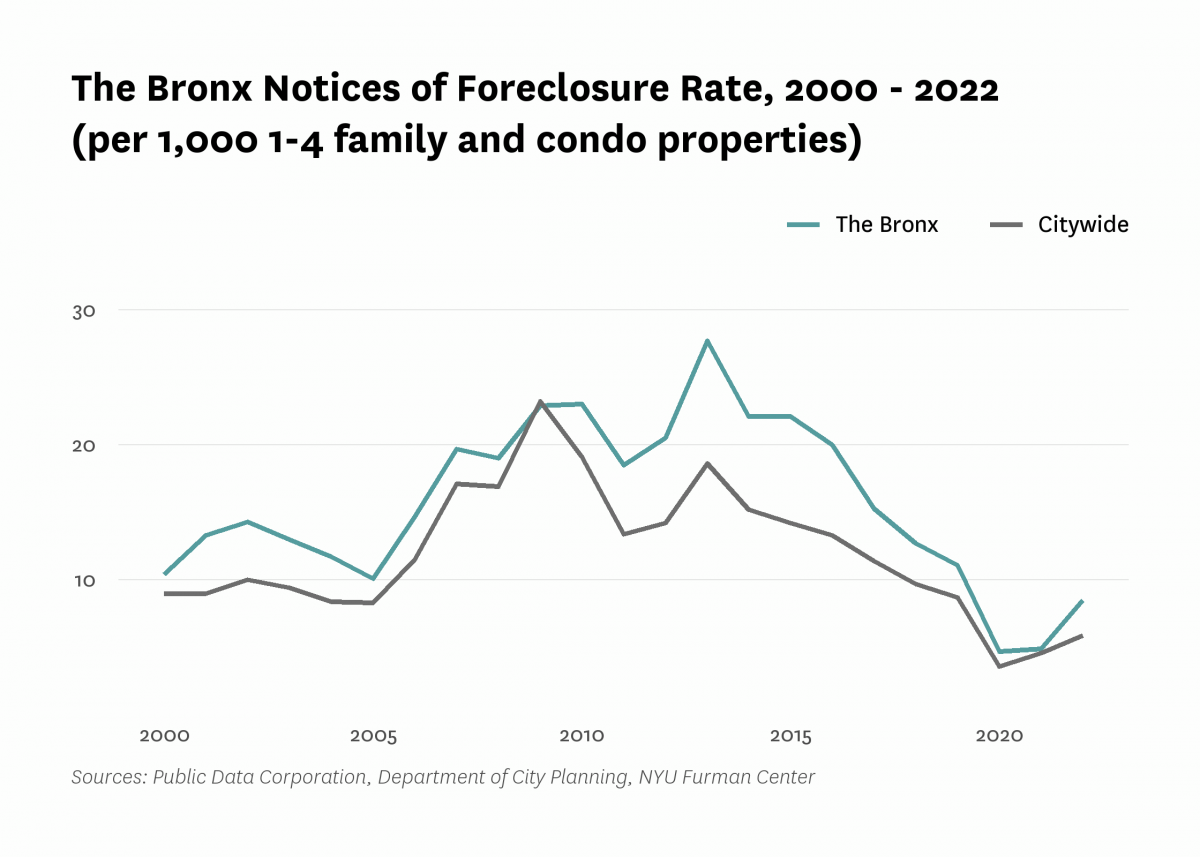
| Notices of foreclosure rate (per 1,000 1-4 family and condo properties) | 10.4 | 14.7 | 23.0 | 11.1 | 4.9 | 8.5 |
| Notices of foreclosure, all residential properties | 841 | 1,223 | 1,982 | 930 | 422 | 724 |
| Notices of foreclosure, initial, 1-4 family and condo properties | 618 | 930 | 1,416 | 407 | 137 | 288 |
| Notices of foreclosure, repeat, 1-4 family and condo properties | 160 | 236 | 444 | 492 | 261 | 400 |
| Pre-foreclosure notice rate (per 1,000 1-4 family and condo properties) | 72.8 | 29.3 | 64.5 | |||
| Pre-foreclosure notices, 1-4 family and condo properties | 5,923 | 2,379 | 5,231 | |||
| Properties entering REO, 1-4 family | 133 | 22 | 140 | |||
| Finance - Lending | ||||||
| FHA/VA-backed home purchase loans (% of home purchase loans) | 0.9% | 40.4% | 24.6% | 24.7% | ||
| Higher-cost home purchase loans (% of home purchase loans) | 34.2% | 1.0% | 10.0% | 5.3% | ||
| Higher-cost refinance loans (% of refinance loans) | 39.5% | 3.1% | 4.1% | 1.1% | ||
| Home purchase loan rate (per 1,000 properties) | 40.4 | 14.6 | 17.8 | 21.8 | ||
| Home purchase loans in LMI tracts (% of home purchase loans) | 47.5% | 18.5% | 40.3% | 39.4% | ||
| Home purchase loans to LMI borrowers (% of home purchase loans) | 10.8% | 41.9% | 14.6% | 15.1% | ||
| Refinance loan rate (per 1,000 properties) | 46.9 | 11.3 | 12.3 | 29.2 | ||
| Sales - Volume | ||||||
| Sales volume, 1 family building | 754 | 1,296 | 484 | 656 | 697 | 849 |
| Sales volume, 2-4 family building | 1,433 | 3,097 | 910 | 1,176 | 1,098 | 1,522 |
| Sales volume, 5+ family building | 176 | 354 | 202 | 119 | 142 | 161 |
| Sales volume, condominium | 322 | 891 | 377 | 465 | 387 | 381 |
| Sales volume, all property types | 2,685 | 5,638 | 1,973 | 2,416 | 2,324 | 2,913 |
| Sales - Median Prices | ||||||
| Median sales price per unit, 1 family building (2022$) | $339,880 | $566,040 | $450,670 | $552,180 | $610,090 | $608,000 |
| Median sales price per unit, 2-4 family building (2022$) | $186,930 | $316,180 | $242,270 | $314,980 | $352,880 | $345,000 |
| Median sales price per unit, 5+ family building (2022$) | $53,940 | $108,910 | $85,930 | $185,830 | $157,920 | $165,220 |
| Median sales price per unit, condominium (2022$) | $64,130 | $186,900 | $283,280 | $253,100 | $286,480 | $250,000 |
| Sales - Housing Price Index | ||||||
| Index of housing price appreciation, 1 family building | 100.0 | 202.8 | 167.7 | 231.9 | 273.2 | 284.0 |
| Index of housing price appreciation, 2-4 family building | 100.0 | 206.1 | 156.7 | 249.4 | 286.1 | 301.1 |
| Index of housing price appreciation, 5+ family building | 100.0 | 256.0 | 200.7 | 529.4 | 448.4 | 499.9 |
| Index of housing price appreciation, condominium | 100.0 | 300.6 | 307.5 | 399.7 | 442.8 | 454.9 |
| Index of housing price appreciation, all property types | 100.0 | 218.2 | 178.7 | 270.3 | 306.1 | 321.5 |
| Subsidized Housing | ||||||
| Total number of subsidized properties (properties) | 3,900 | |||||
| HUD Financing or Insurance (properties) | 89 | |||||
| HUD Financing or Insurance (units) | 7,520 | |||||
| HUD Project-based Rental Assistance Program (properties) | 287 | |||||
| HUD Project-based Rental Assistance Program (units) | 19,842 | |||||
| Low Income Housing Tax Credit (properties) | 826 | |||||
| Low Income Housing Tax Credit (units) | 56,119 | |||||
| Public Housing (properties) | 156 | |||||
| Public Housing (units) | 55,317 | |||||
| Mitchell-Lama (properties) | 86 | |||||
| Mitchell-Lama (units) | 30,279 | |||||
| 421-a Tax Exemption (properties) | 658 | |||||
| 421-a Tax Exemption (units) | 22,716 | |||||
| 420-c Tax Exemption (properties) | 613 | |||||
| 420-c Tax Exemption (units) | 36,308 | |||||
| NYC Housing Production Programs and Zoning Incentives or Requirements (properties) | 1,616 | |||||
| Eligible to expire from housing programs between 2023 and 2028 (properties) | 111 | |||||
| Eligible to expire from housing programs between 2023 and 2028 (units) | 5,910 | |||||
| Eligible to expire from housing programs between 2029 and 2038 (properties) | 370 | |||||
| Eligible to expire from housing programs between 2029 and 2038 (units) | 21,378 | |||||
| Eligible to expire from housing programs in 2039 and later (properties) | 563 | |||||
| Eligible to expire from housing programs in 2039 and later (units) | 46,575 | |||||
| Indicator | 2000 | 2006 | 2010 | 2019 | 2021 | 2022 |
|---|---|---|---|---|---|---|
| Density | ||||||
| Population density (1,000 persons per square mile) | 32.4 | 33.0 | 33.7 | 33.9 | ||
| Development | ||||||
| Units authorized by new residential building permits | 3,045 | 3 | 1,461 | 6,120 | 5,933 | 10,531 |
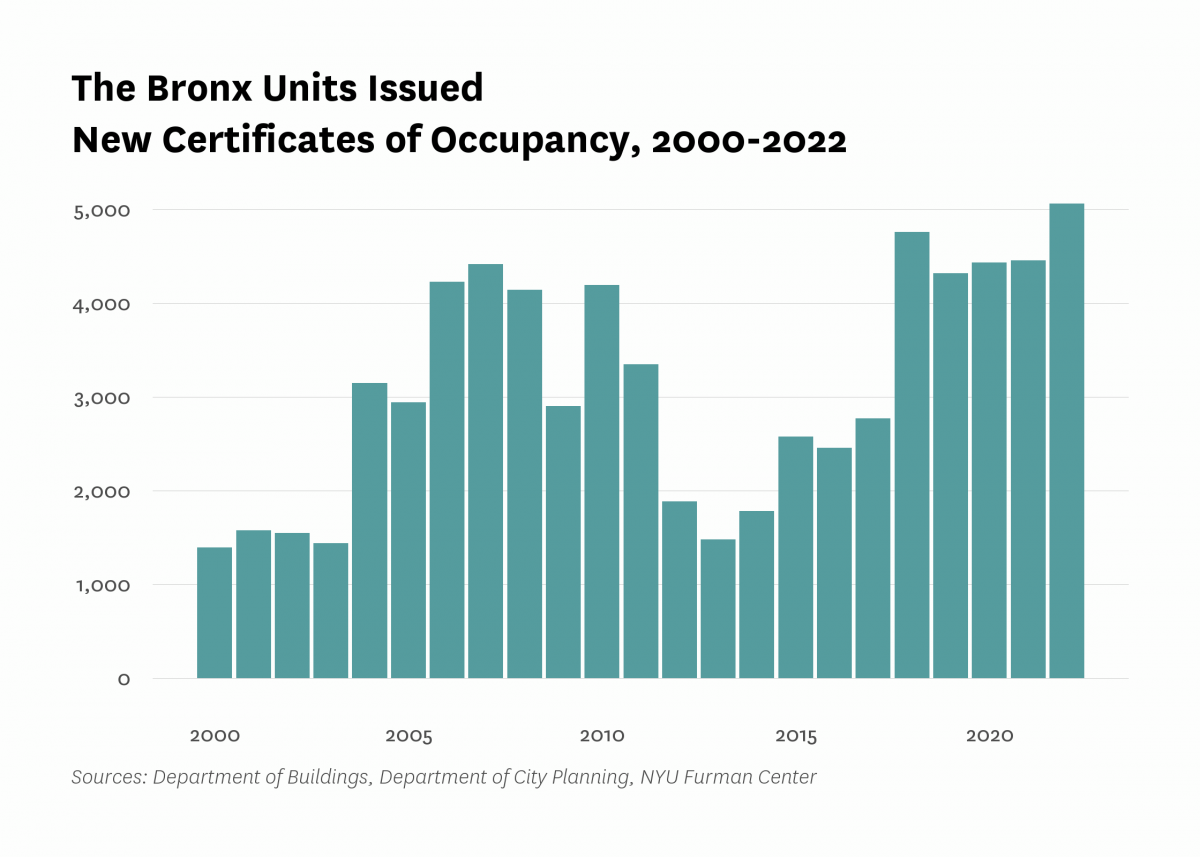
| Units issued new certificates of occupancy | 1,390 | 4,226 | 4,192 | 4,317 | 4,455 | 5,061 |
| Indicator | 2000 | 2006 | 2010 | 2019 | 2021 | 2022 |
|---|---|---|---|---|---|---|
| Commute | ||||||
| Car-free commute (% of commuters) | 61.1% | 65.8% | 69.4% | 71.1% | 64.8% | |
| Mean travel time to work (minutes) | 43.0 | 40.6 | 42.9 | 45.9 | 43.3 | |
| Crime and Incarceration | ||||||
| Serious crime rate (per 1,000 residents) | 23.8 | 16.6 | 14.3 | 14.0 | 15.7 | 18.8 |
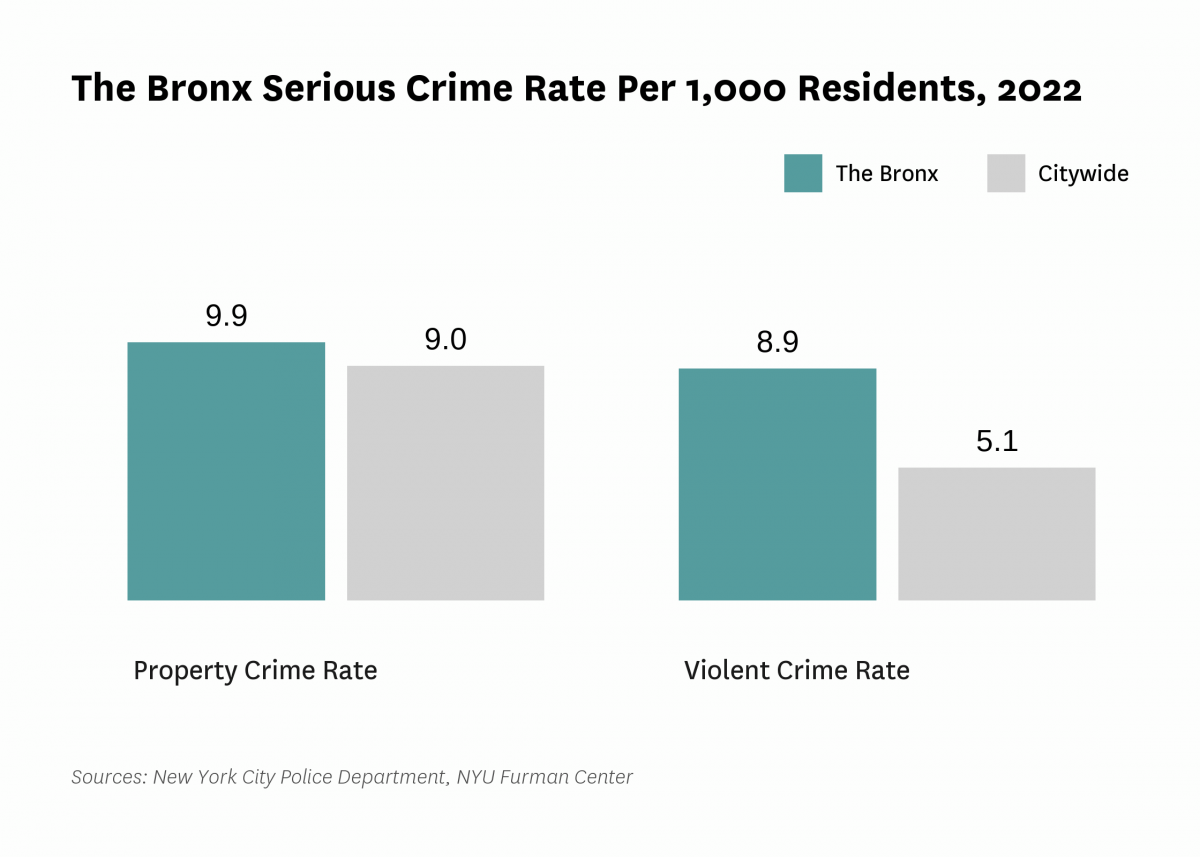
| Serious crime rate, property (per 1,000 residents) | 14.0 | 9.4 | 7.4 | 6.9 | 8.4 | 9.9 |
| Serious crime rate, violent (per 1,000 residents) | 9.8 | 7.2 | 6.9 | 7.1 | 7.3 | 8.9 |
| Schools | ||||||
| Students performing at grade level in English language arts, 4th grade | 36.0% | 25.3% | ||||
| Students performing at grade level in math, 4th grade | 33.1% | 21.6% | ||||
| Indicator | 2000 | 2006 | 2010 | 2019 | 2021 | 2022 |
|---|---|---|---|---|---|---|
| Median Rent | ||||||
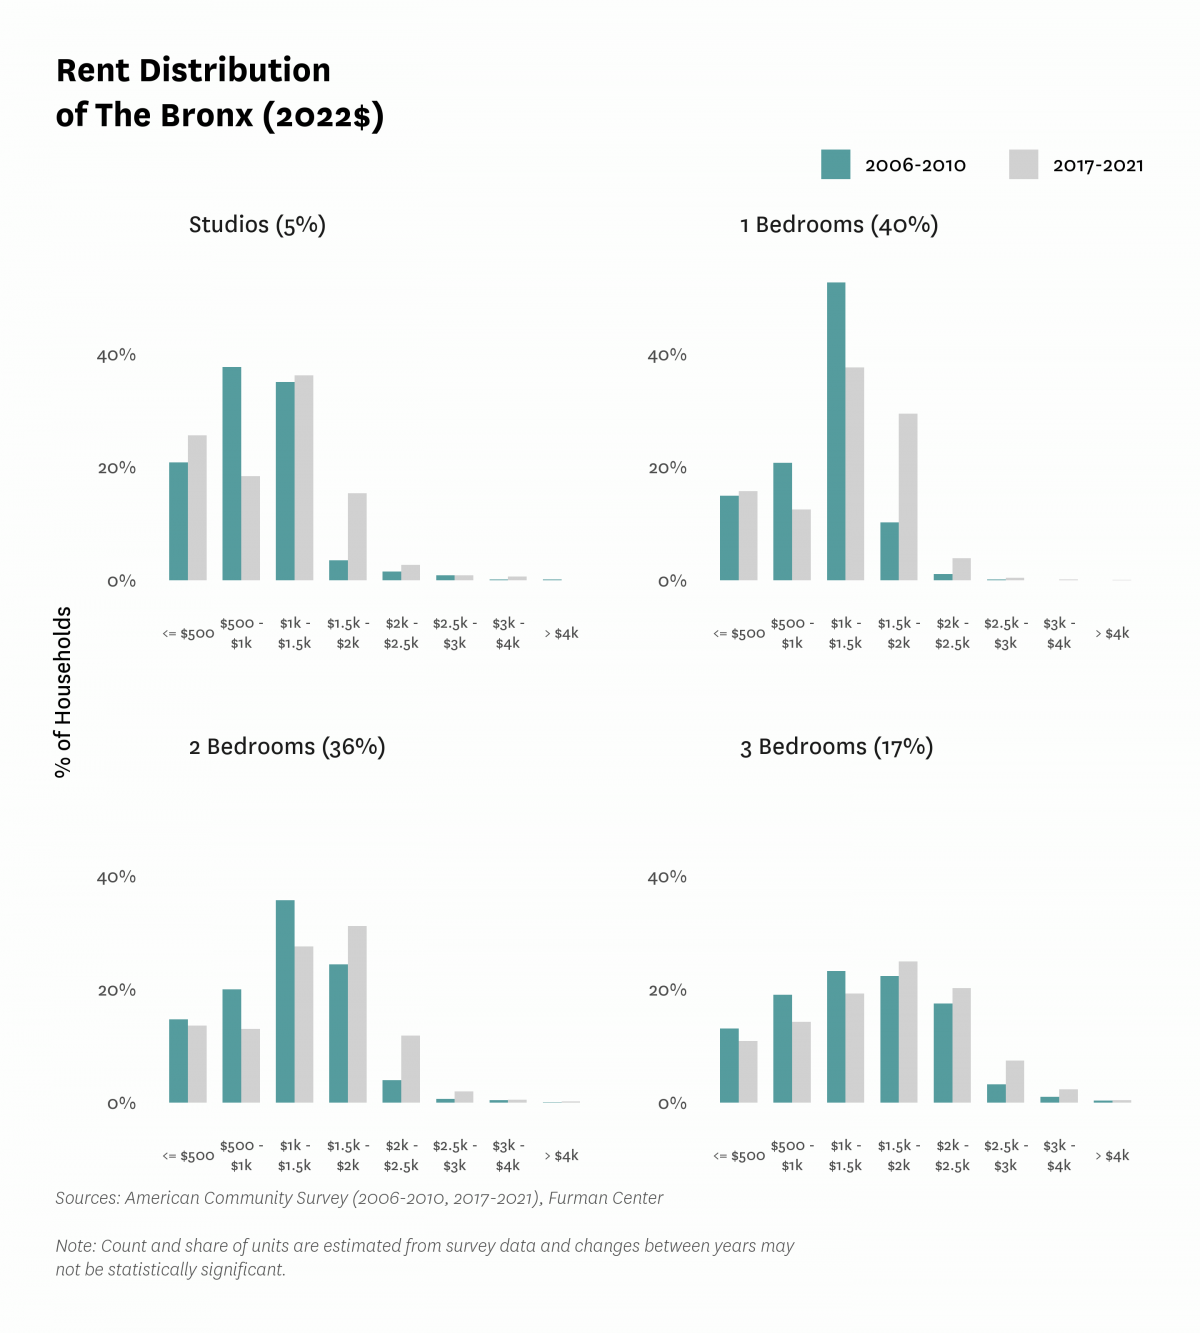
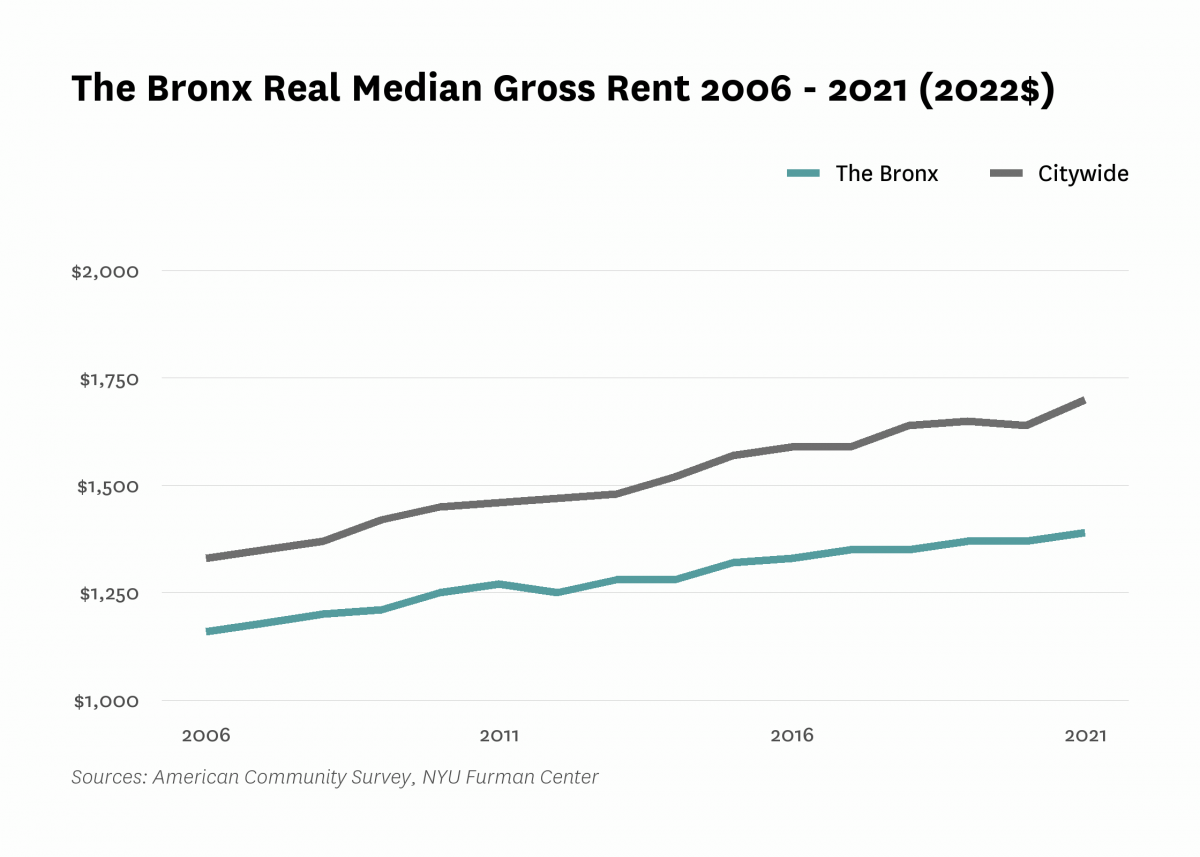
| Median rent, 2- and 3-bedrooms (2022$) | $1,290 | $1,420 | $1,500 | |||
| Median rent, all (2022$) | $1,050 | $1,160 | $1,250 | $1,370 | $1,390 | |
| Median rent, recent movers (2022$) | $1,340 | $1,540 | $1,620 | |||
| Median rent, studios and 1-bedrooms (2022$) | $1,120 | $1,230 | $1,290 | |||
| Affordability | ||||||
| Rental units affordable at 30% AMI (% of recently available units) | 12.6% | 15.9% | 15.8% | |||
| Rental units affordable at 80% AMI (% of recently available units) | 81.0% | 85.8% | 85.8% | |||
| Rental units affordable at 120% AMI (% of recently available units) | 98.3% | 98.7% | 98.7% | |||
| Rent Burden | ||||||
| Moderately rent-burdened households | 21.8% | 24.6% | 27.3% | 25.1% | ||
| Moderately rent-burdened households, low income | 28.7% | 30.1% | 30.2% | |||
| Moderately rent-burdened households, moderate income | 5.8% | 5.7% | 4.1% | |||
| Severely rent-burdened households | 27.2% | 31.8% | 34.3% | 34.0% | ||
| Severely rent-burdened households, low income | 40.8% | 42.3% | 41.9% | |||
| Severely rent-burdened households, moderate income | 0.3% | 0.2% | 0.3% | |||
| Rental Subsidy | ||||||
| Housing choice vouchers (% of occupied, privately owned rental units) | 14.8% | 13.8% | ||||
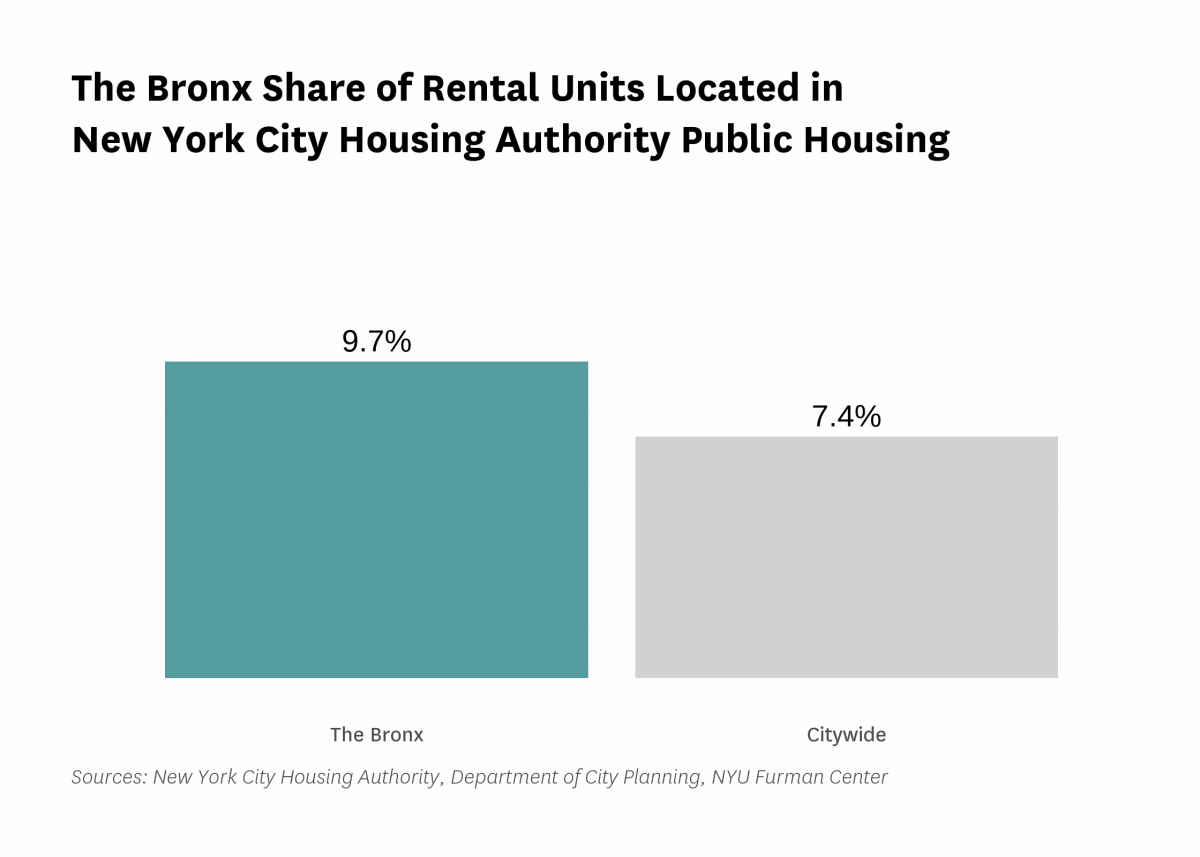
| Public housing (% of rental units) | 9.7% | |||||
Data Notes: See CoreData User Guide for more information about indicator definitions and methods.
Indicators: The rental vacancy rate, severe crowding rate, and the severely rent-burdened households indicators use five-year American Community Survey (ACS) estimates. Data under the 2010 heading comes from the 2006 – 2010 ACS, data under the 2019 heading comes from the 2015 – 2019 ACS and data under the 2021 heading comes from 2017 – 2021 ACS .
All content © 2005 – 2024 Furman Center for Real Estate and Urban Policy | Top of page | Contact Us