| Indicator | 2000 | 2006 | 2010 | 2019 | 2021 | 2022 |
|---|---|---|---|---|---|---|
| Population | ||||||
| Born in New York State | 66.5% | 65.4% | 66.0% | 65.6% | ||
| Disabled population | 6.7% | 7.2% | 8.0% | |||
| Foreign-born population | 19.1% | 24.0% | 24.7% | 24.7% | 25.5% | |
| Population | 162,609 | 168,395 | 172,052 | 176,195 | 185,150 | |
| Population aged 65+ | 11.1% | 10.5% | 10.7% | 14.2% | 13.8% | |
| Households | ||||||
| Households with children under 18 years old | 39.3% | 38.4% | 40.0% | 28.3% | 33.9% | |
| Single-person households | 28.5% | 24.3% | 30.2% | 26.8% | ||
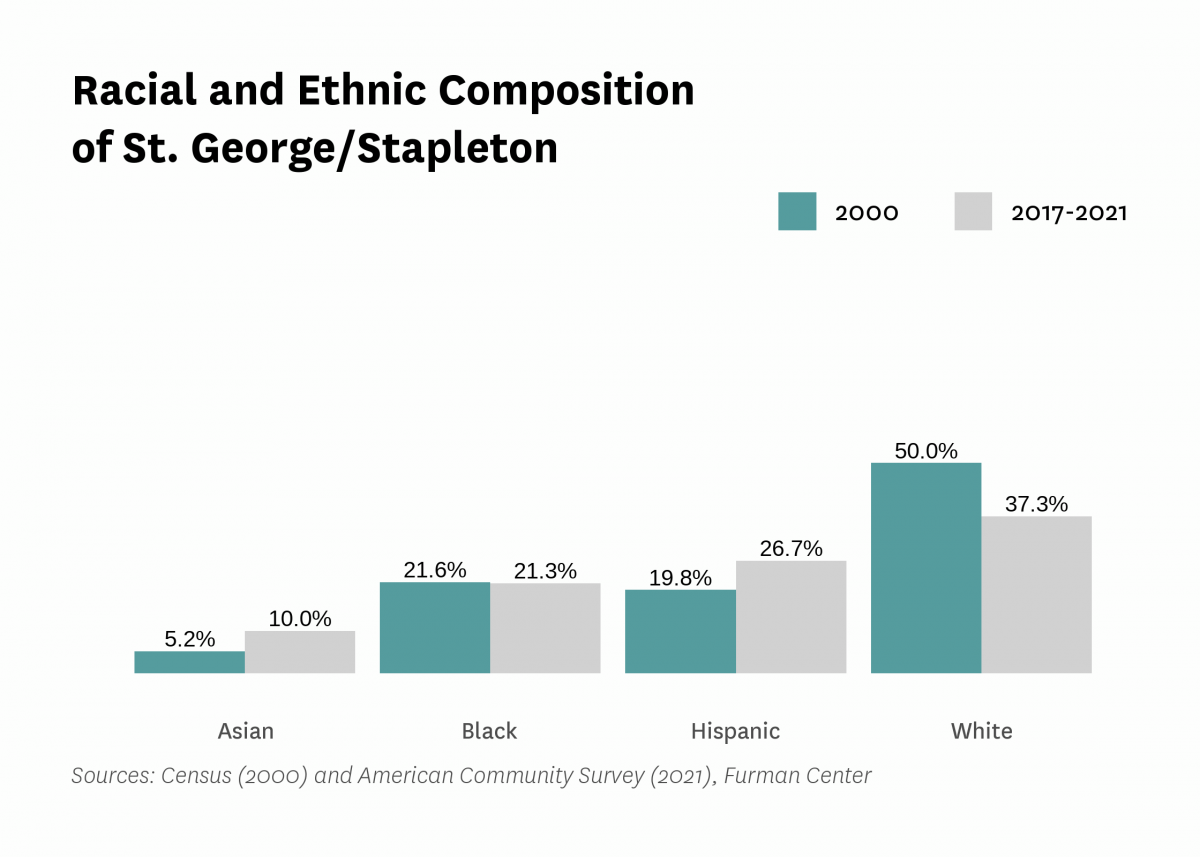
| Race and Ethnicity | ||||||
| Percent Asian | 5.2% | 7.1% | 8.1% | 8.2% | 10.0% | |
| Percent Black | 21.6% | 22.2% | 21.7% | 21.9% | 21.3% | |
| Percent Hispanic | 19.8% | 26.8% | 27.2% | 29.5% | 26.7% | |
| Percent white | 50.0% | 41.9% | 41.3% | 37.9% | 37.3% | |
| Racial diversity index | 0.66 | 0.70 | 0.70 | 0.72 | 0.73 | |
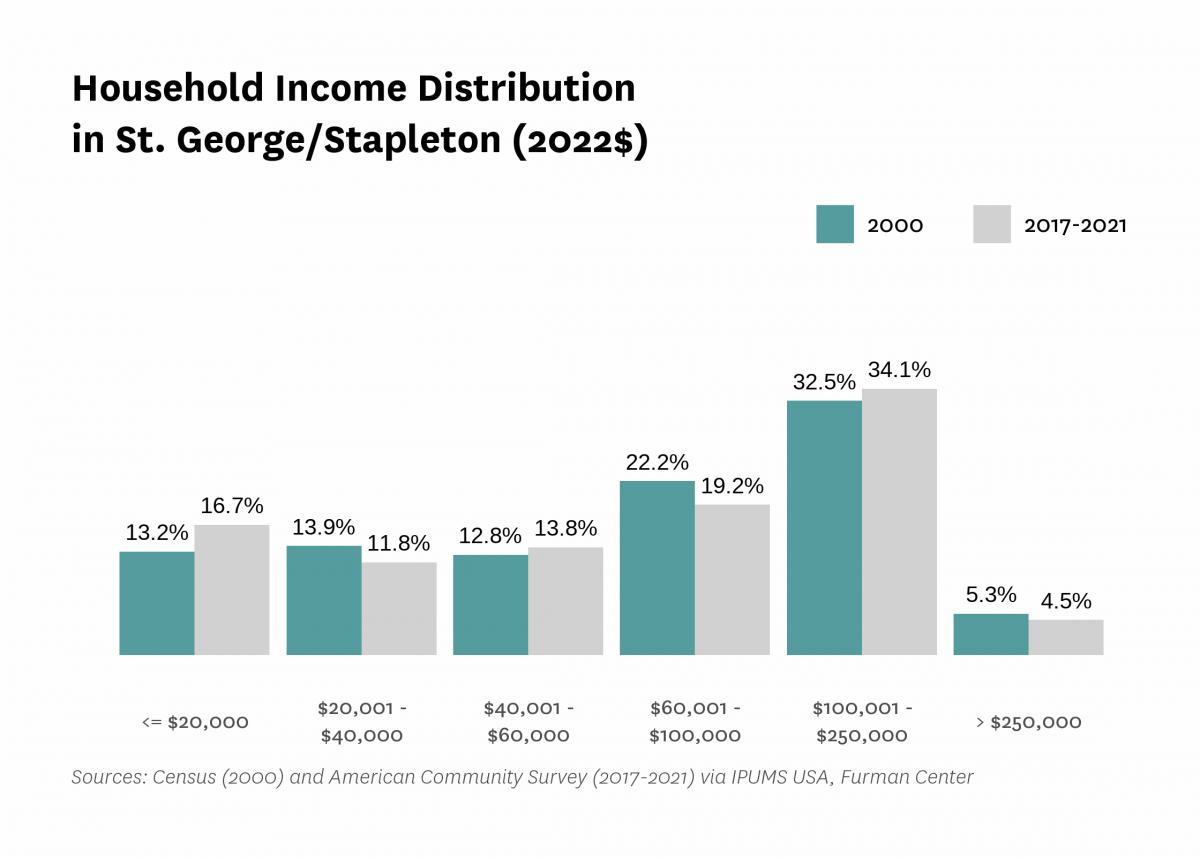
| Income and Poverty | ||||||
| Income diversity ratio | 5.0 | 5.7 | 5.1 | 6.0 | ||
| Median household income (2022$) | $81,300 | $82,180 | $76,410 | $83,820 | $77,170 | |
| Median household income, homeowners (2022$) | $109,200 | $111,920 | $127,560 | $110,830 | ||
| Median household income, renters (2022$) | $40,110 | $37,180 | $47,370 | $42,210 | ||
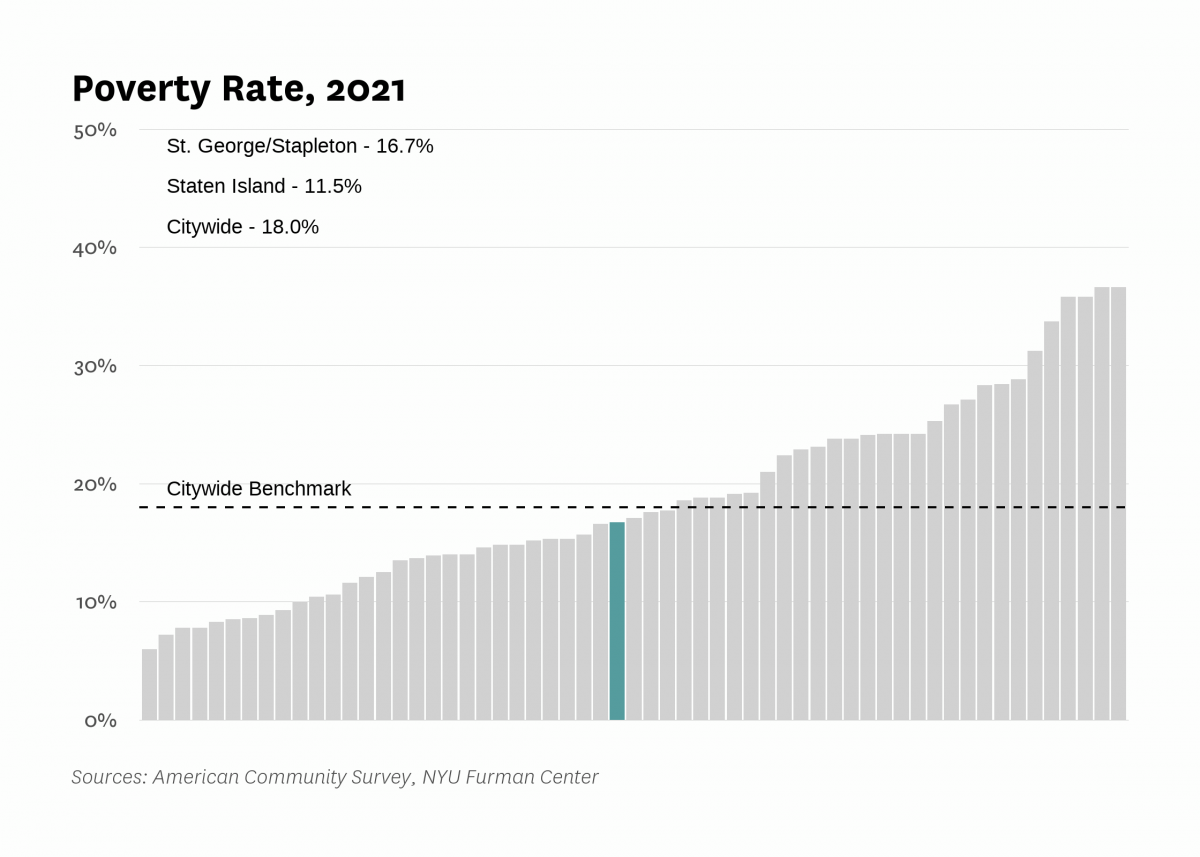
| Poverty rate | 15.7% | 15.0% | 17.9% | 13.0% | 16.7% | |
| Poverty rate, population aged 65+ | 16.1% | 16.2% | 14.0% | 15.2% | ||
| Poverty rate, population under 18 years old | 21.5% | 26.2% | 19.7% | 22.4% | ||
| Labor Market | ||||||
| Labor force participation rate | 61.9% | 59.1% | 63.8% | 57.8% | ||
| Population aged 25+ without a high school diploma | 15.4% | 14.6% | 14.6% | 12.6% | ||
| Unemployment rate | 8.21% | 5.64% | 10.09% | 5.13% | 7.91% | |
| Indicator | 2000 | 2006 | 2010 | 2019 | 2021 | 2022 |
|---|---|---|---|---|---|---|
| Housing Stock | ||||||
| Homeownership rate | 51.9% | 58.7% | 58.3% | 51.3% | 58.4% | |
| Housing units | 66,700 | 68,295 | 71,357 | 69,433 | ||
| Rental vacancy rate | 8.6% | 8.4% | 8.4% | |||
| Serious housing code violations (per 1,000 privately owned rental units) | 34.9 | 69.4 | 71.1 | 62.5 | 82.1 | |
| Severe crowding rate (% of renter households) | 2.8% | 2.6% | 4.3% | |||
| Total housing code violations (per 1,000 privately owned rental units) | 231.1 | 294.1 | 291.0 | 267.9 | 306.4 | |
| Finance - Distress | ||||||
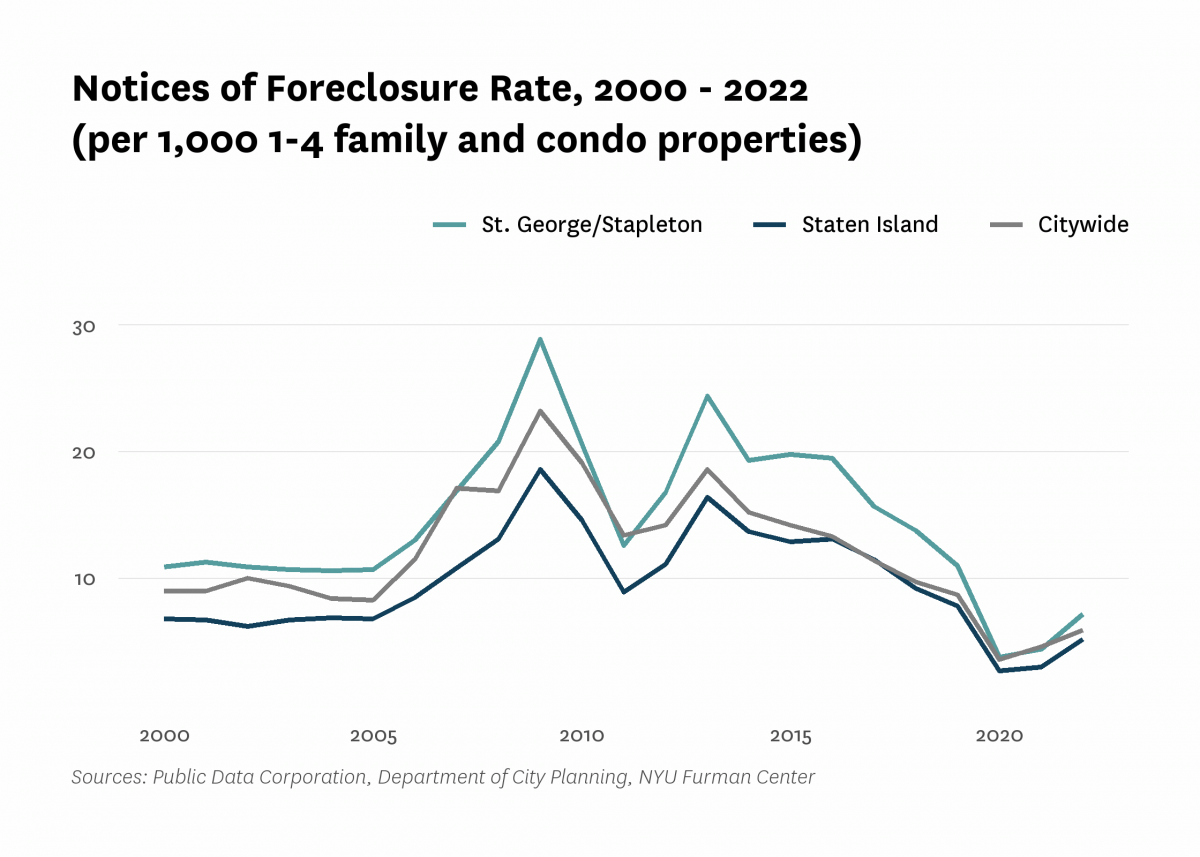
| Notices of foreclosure rate (per 1,000 1-4 family and condo properties) | 10.9 | 13.0 | 20.6 | 11.0 | 4.4 | 7.2 |
| Notices of foreclosure, all residential properties | 367 | 471 | 751 | 411 | 165 | 267 |
| Notices of foreclosure, initial, 1-4 family and condo properties | 344 | 360 | 598 | 168 | 49 | 105 |
| Notices of foreclosure, repeat, 1-4 family and condo properties | 12 | 105 | 143 | 231 | 113 | 158 |
| Pre-foreclosure notice rate (per 1,000 1-4 family and condo properties) | 66.3 | 24.4 | 54.3 | |||
| Pre-foreclosure notices, 1-4 family and condo properties | 2,414 | 891 | 1,987 | |||
| Properties entering REO, 1-4 family | 3 | 43 | 102 | |||
| Finance - Lending | ||||||
| FHA/VA-backed home purchase loans (% of home purchase loans) | 2.0% | 41.5% | 20.1% | 18.4% | ||
| Higher-cost home purchase loans (% of home purchase loans) | 32.3% | 0.7% | 7.2% | 5.0% | ||
| Higher-cost refinance loans (% of refinance loans) | 35.9% | 2.0% | 2.8% | 0.8% | ||
| Home purchase loan rate (per 1,000 properties) | 50.4 | 18.8 | 26.0 | 38.2 | ||
| Home purchase loans in LMI tracts (% of home purchase loans) | 18.8% | 15.6% | 21.7% | 17.3% | ||
| Home purchase loans to LMI borrowers (% of home purchase loans) | 2.6% | 15.0% | 14.1% | 19.0% | ||
| Refinance loan rate (per 1,000 properties) | 74.5 | 21.4 | 28.8 | 60.6 | ||
| Sales - Volume | ||||||
| Sales volume, 1 family building | 1,020 | 1,227 | 521 | 743 | 804 | 917 |
| Sales volume, 2-4 family building | 436 | 789 | 247 | 327 | 294 | 472 |
| Sales volume, 5+ family building | 5 | 19 | 13 | 15 | 7 | 7 |
| Sales volume, condominium | 115 | 199 | 74 | 119 | 186 | 163 |
| Sales volume, all property types | 1,576 | 2,234 | 855 | 1,204 | 1,291 | 1,559 |
| Sales - Median Prices | ||||||
| Median sales price per unit, 1 family building (2022$) | $305,720 | $526,970 | $437,790 | $546,330 | $573,750 | $570,000 |
| Median sales price per unit, 2-4 family building (2022$) | $164,080 | $301,430 | $229,260 | $306,610 | $328,920 | $305,000 |
| Median sales price per unit, 5+ family building (2022$) | $93,460 | $142,280 | $114,280 | $148,660 | $165,050 | $198,000 |
| Median sales price per unit, condominium (2022$) | $200,530 | $361,850 | $302,820 | $356,790 | $375,970 | $358,000 |
| Sales - Housing Price Index | ||||||
| Index of housing price appreciation, 1 family building | 100.0 | 198.1 | 172.7 | 253.8 | 284.7 | 295.1 |
| Index of housing price appreciation, 2-4 family building | 100.0 | 225.4 | 160.6 | 268.8 | 304.2 | 295.1 |
| Index of housing price appreciation, 5+ family building | 100.0 | 193.8 | 206.1 | 192.9 | 461.6 | 625.3 |
| Index of housing price appreciation, condominium | 100.0 | 236.4 | 203.7 | 296.7 | 313.2 | 305.7 |
| Index of housing price appreciation, all property types | 100.0 | 209.1 | 173.0 | 260.1 | 291.0 | 294.6 |
| Subsidized Housing | ||||||
| Total number of subsidized properties (properties) | 95 | |||||
| HUD Financing or Insurance (properties) | 6 | |||||
| HUD Financing or Insurance (units) | 734 | |||||
| HUD Project-based Rental Assistance Program (properties) | 14 | |||||
| HUD Project-based Rental Assistance Program (units) | 2,532 | |||||
| Low Income Housing Tax Credit (properties) | 22 | |||||
| Low Income Housing Tax Credit (units) | 3,196 | |||||
| Public Housing (properties) | 10 | |||||
| Public Housing (units) | 3,093 | |||||
| Mitchell-Lama (properties) | 1 | |||||
| Mitchell-Lama (units) | 536 | |||||
| 421-a Tax Exemption (properties) | 32 | |||||
| 421-a Tax Exemption (units) | 1,511 | |||||
| 420-c Tax Exemption (properties) | 10 | |||||
| 420-c Tax Exemption (units) | 856 | |||||
| NYC Housing Production Programs and Zoning Incentives or Requirements (properties) | 31 | |||||
| Eligible to expire from housing programs between 2023 and 2028 (properties) | 9 | |||||
| Eligible to expire from housing programs between 2023 and 2028 (units) | 407 | |||||
| Eligible to expire from housing programs between 2029 and 2038 (properties) | 8 | |||||
| Eligible to expire from housing programs between 2029 and 2038 (units) | 1,936 | |||||
| Eligible to expire from housing programs in 2039 and later (properties) | 14 | |||||
| Eligible to expire from housing programs in 2039 and later (units) | 2,775 | |||||
| Indicator | 2000 | 2006 | 2010 | 2019 | 2021 | 2022 |
|---|---|---|---|---|---|---|
| Density | ||||||
| Population density (1,000 persons per square mile) | 12.3 | 12.6 | 12.9 | 13.6 | ||
| Development | ||||||
| Units authorized by new residential building permits | 522 | 0 | 101 | 140 | 119 | 509 |
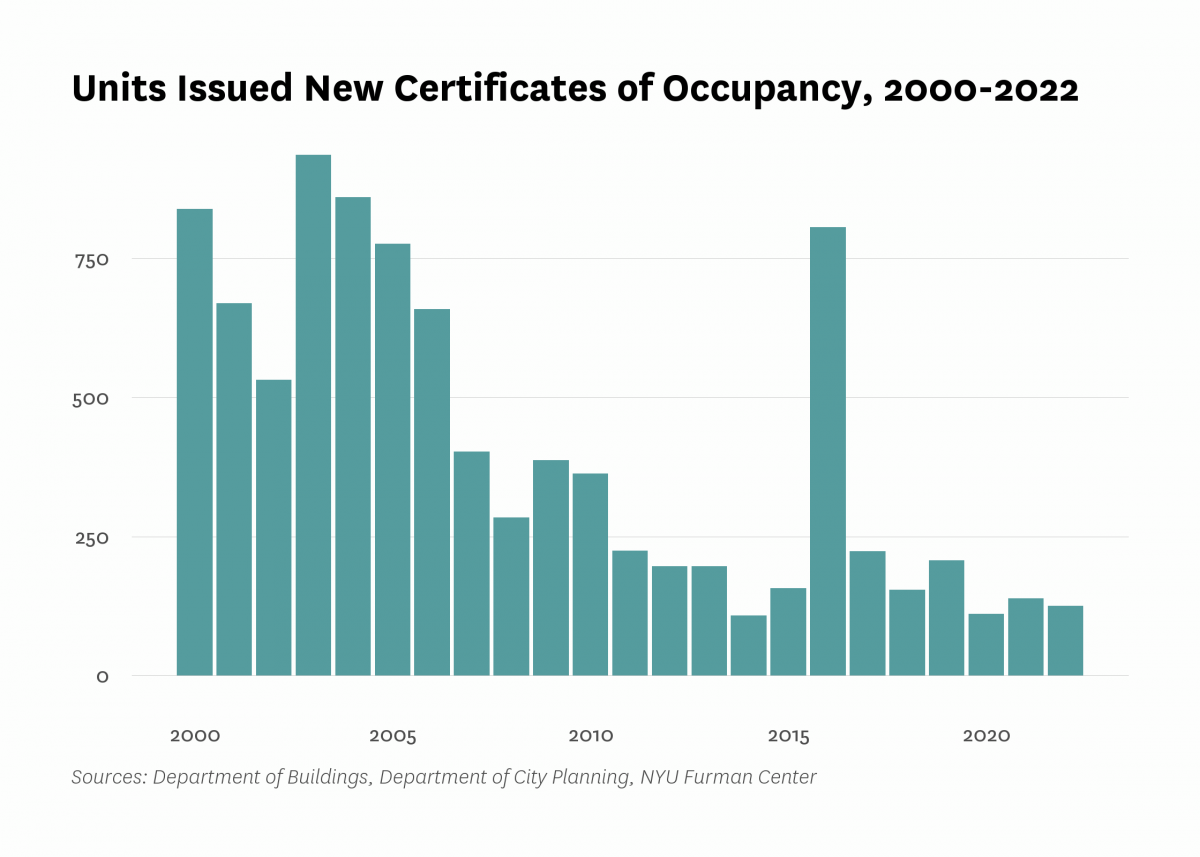
| Units issued new certificates of occupancy | 839 | 659 | 363 | 207 | 139 | 125 |
| Indicator | 2000 | 2006 | 2010 | 2019 | 2021 | 2022 |
|---|---|---|---|---|---|---|
| Commute | ||||||
| Car-free commute (% of commuters) | 39.6% | 45.2% | 42.1% | 40.9% | 30.6% | |
| Mean travel time to work (minutes) | 43.3 | 42.4 | 38.6 | 44.6 | 40.4 | |
| Crime and Incarceration | ||||||
| Serious crime rate (per 1,000 residents) | 9.9 | 8.6 | 7.3 | 6.7 | 8.4 | |
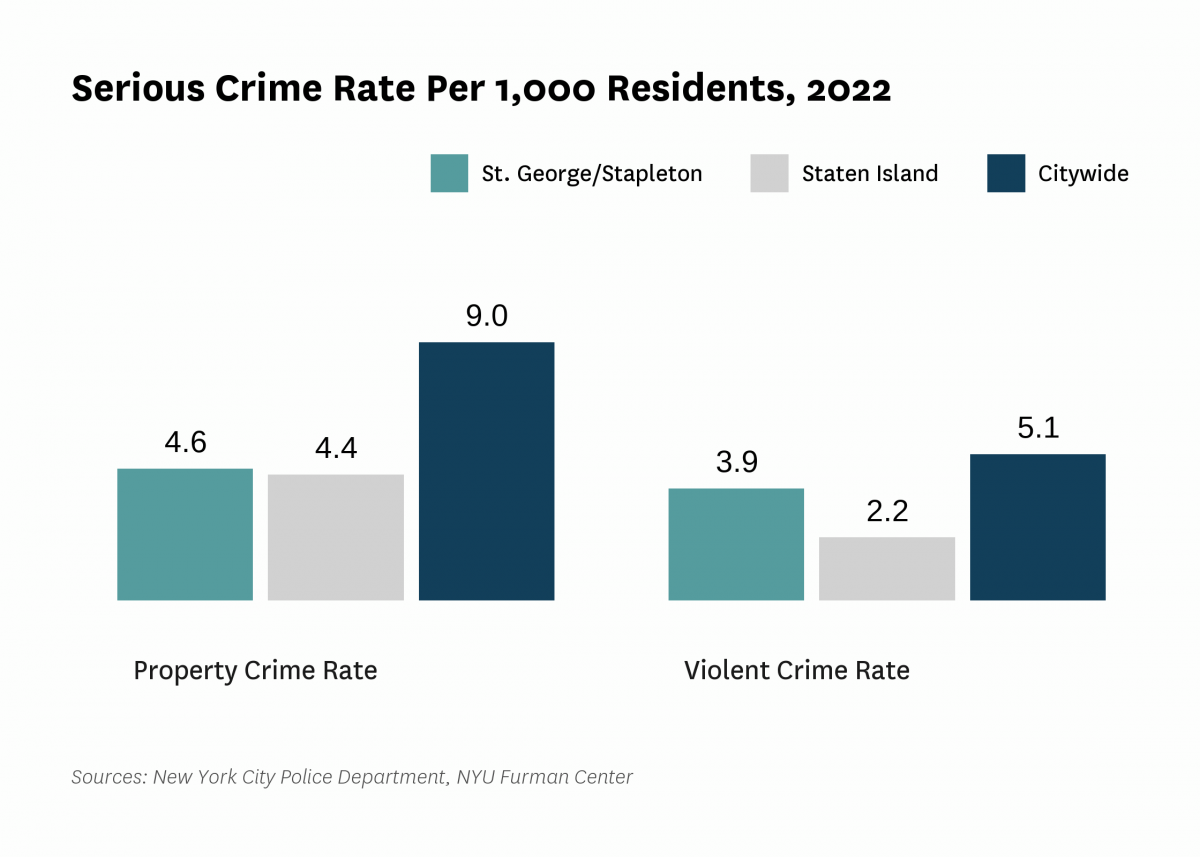
| Serious crime rate, property (per 1,000 residents) | 6.2 | 5.2 | 3.9 | 3.7 | 4.6 | |
| Serious crime rate, violent (per 1,000 residents) | 3.8 | 3.4 | 3.3 | 2.9 | 3.9 | |
| Schools | ||||||
| Students performing at grade level in English language arts, 4th grade | 39.5% | 33.1% | ||||
| Students performing at grade level in math, 4th grade | 39.8% | 28.5% | ||||
| Indicator | 2000 | 2006 | 2010 | 2019 | 2021 | 2022 |
|---|---|---|---|---|---|---|
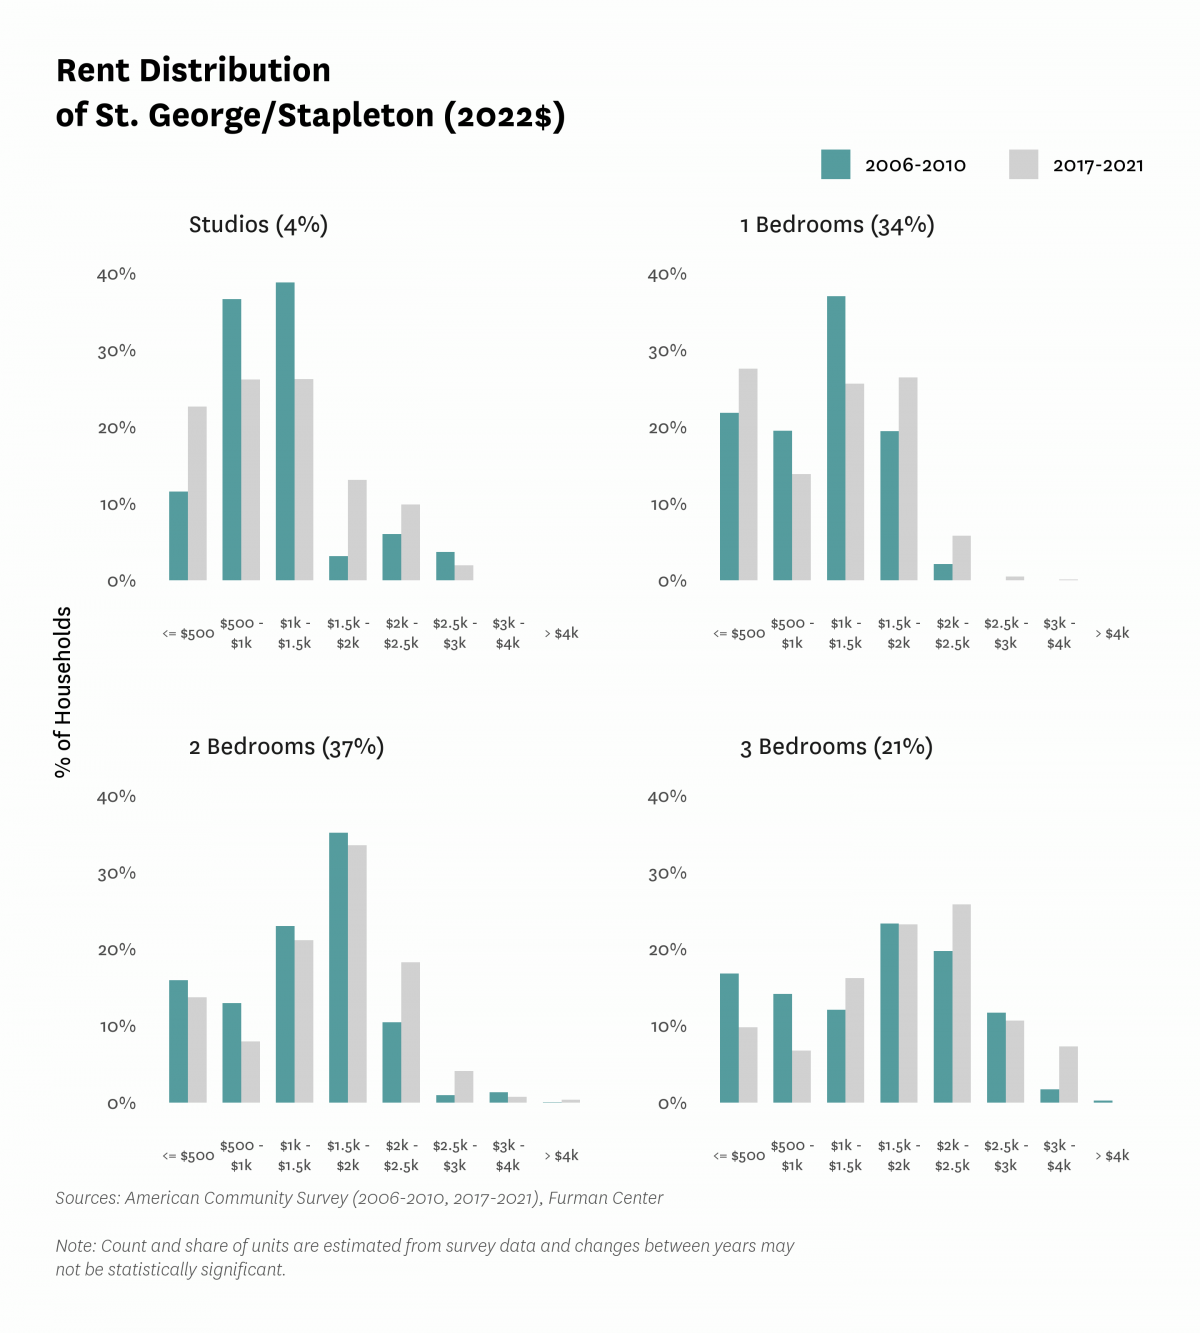
| Median Rent | ||||||
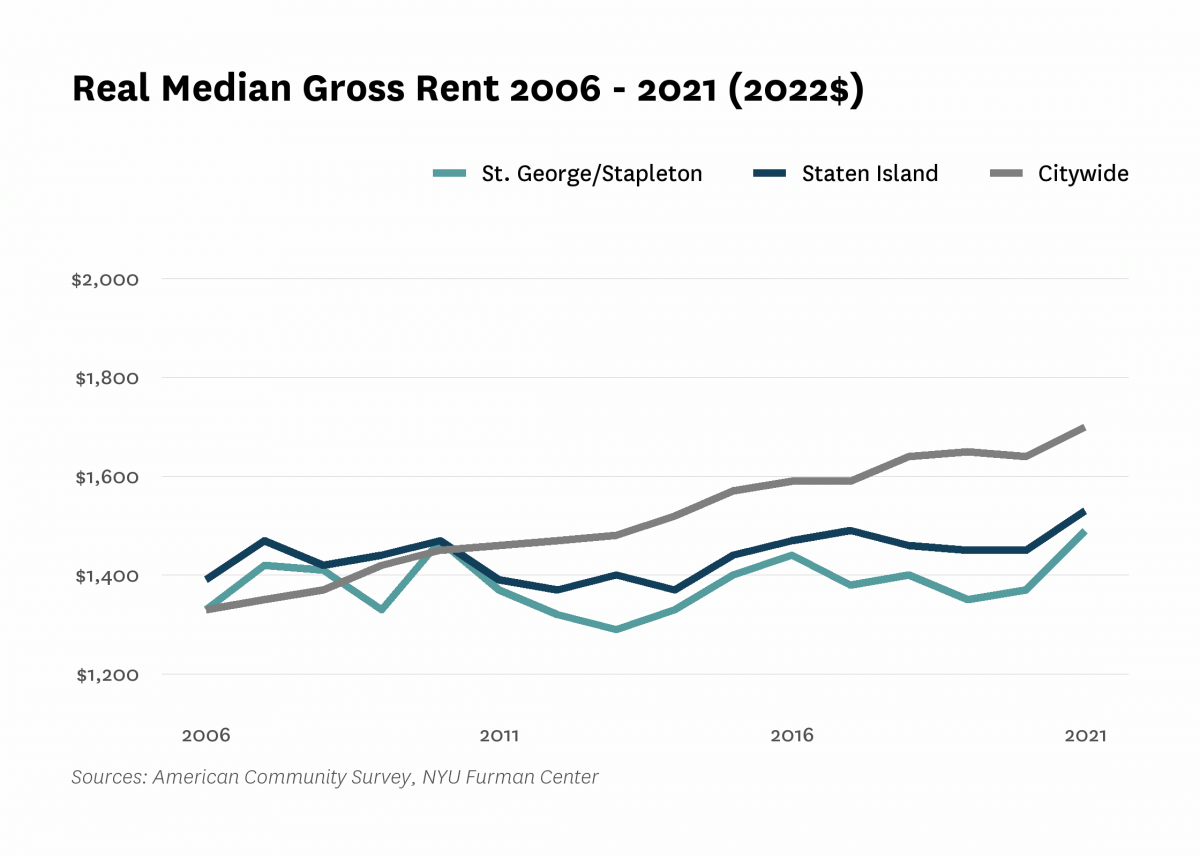
| Median rent, 2- and 3-bedrooms (2022$) | $1,570 | $1,620 | $1,720 | |||
| Median rent, all (2022$) | $1,190 | $1,330 | $1,470 | $1,350 | $1,490 | |
| Median rent, recent movers (2022$) | $1,560 | $1,510 | $1,640 | |||
| Median rent, studios and 1-bedrooms (2022$) | $1,160 | $1,080 | $1,220 | |||
| Change in collected rent (2019-2020) | 5.2% | |||||
| Affordability | ||||||
| Rental units affordable at 30% AMI (% of recently available units) | 16.9% | 7.5% | 10.2% | |||
| Rental units affordable at 80% AMI (% of recently available units) | 64.2% | 85.5% | 72.7% | |||
| Rental units affordable at 120% AMI (% of recently available units) | 96.9% | 99.1% | 98.1% | |||
| Rent Burden | ||||||
| Moderately rent-burdened households | 23.9% | 23.6% | 30.3% | 25.4% | ||
| Moderately rent-burdened households, low income | 25.8% | 32.0% | 32.7% | |||
| Moderately rent-burdened households, moderate income | 19.4% | 12.9% | 5.8% | |||
| Severely rent-burdened households | 22.0% | 32.3% | 32.5% | 30.5% | ||
| Severely rent-burdened households, low income | 45.4% | 38.3% | 40.2% | |||
| Severely rent-burdened households, moderate income | 0.3% | 0.0% | 0.8% | |||
| Rental Subsidy | ||||||
| Housing choice vouchers (% of occupied, privately owned rental units) | 8.2% | 9.0% | ||||
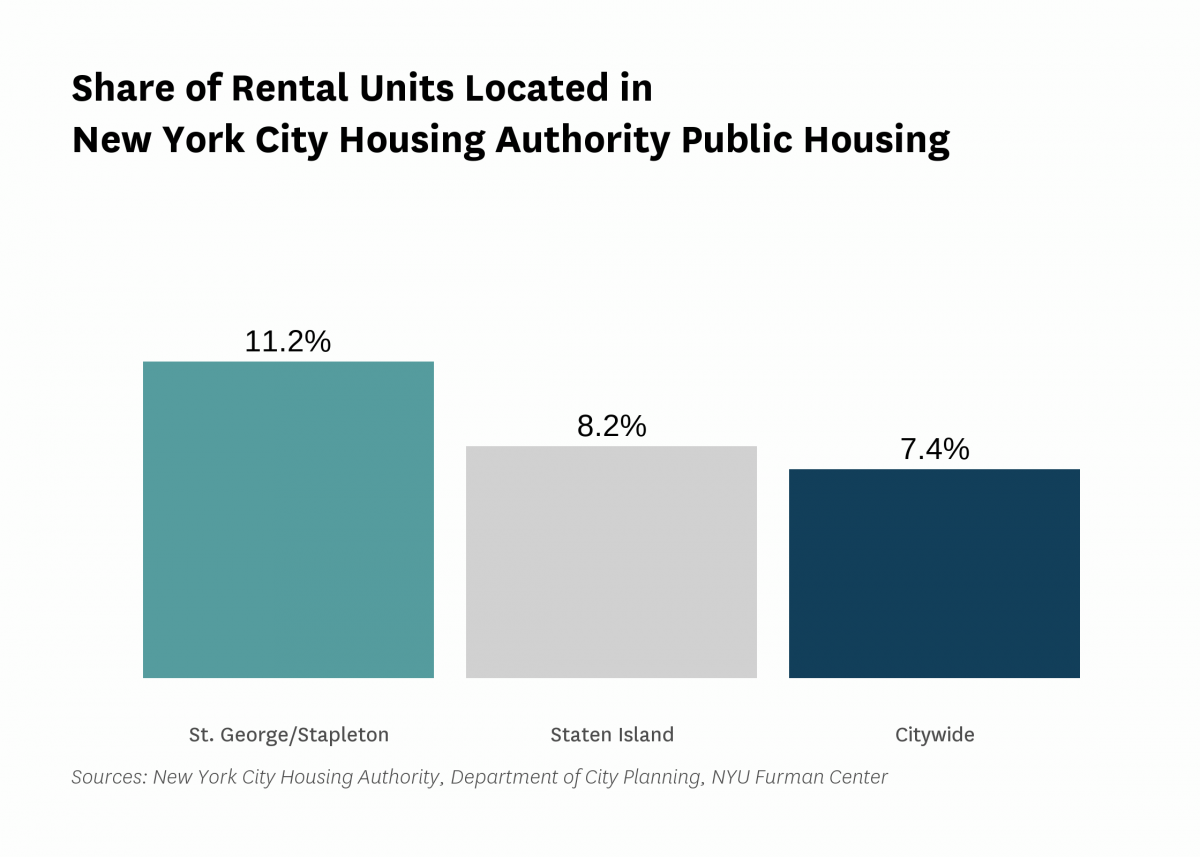
| Public housing (% of rental units) | 11.2% | |||||

Data Notes: See CoreData User Guide for more information about indicator definitions and methods.
Indicators: The rental vacancy rate, severe crowding rate, and the severely rent-burdened households indicators use five-year American Community Survey (ACS) estimates. Data under the 2010 heading comes from the 2006 – 2010 ACS, data under the 2019 heading comes from the 2015 – 2019 ACS and data under the 2021 heading comes from 2017 – 2021 ACS .
All content © 2005 – 2024 Furman Center for Real Estate and Urban Policy | Top of page | Contact Us