| Indicator | 2000 | 2006 | 2010 | 2019 | 2021 | 2022 |
|---|---|---|---|---|---|---|
| Population | ||||||
| Born in New York State | 43.6% | 45.6% | 47.2% | 43.2% | ||
| Disabled population | 7.0% | 4.5% | 7.5% | |||
| Foreign-born population | 47.9% | 46.5% | 44.4% | 35.0% | 36.5% | |
| Population | 112,670 | 110,333 | 107,419 | 106,258 | 109,967 | |
| Population aged 65+ | 9.7% | 10.2% | 11.1% | 14.0% | 18.3% | |
| Households | ||||||
| Households with children under 18 years old | 42.2% | 34.7% | 34.4% | 21.9% | 20.1% | |
| Single-person households | 31.5% | 32.9% | 35.3% | 32.5% | ||
| Race and Ethnicity | ||||||
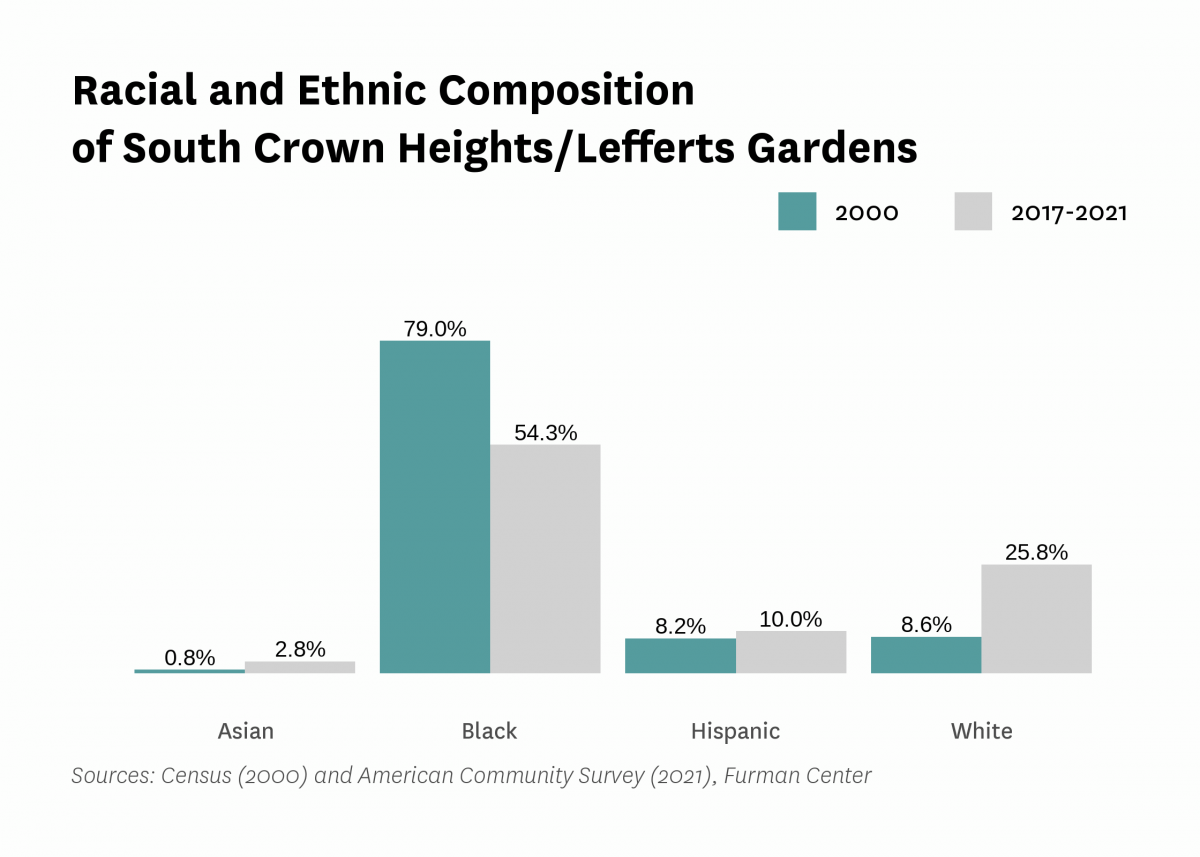
| Percent Asian | 0.8% | 0.9% | 1.8% | 2.1% | 2.8% | |
| Percent Black | 79.0% | 74.8% | 75.2% | 57.2% | 54.3% | |
| Percent Hispanic | 8.2% | 8.4% | 6.5% | 12.2% | 10.0% | |
| Percent white | 8.6% | 14.0% | 14.9% | 25.3% | 25.8% | |
| Racial diversity index | 0.36 | 0.41 | 0.41 | 0.59 | 0.63 | |
| Income and Poverty | ||||||
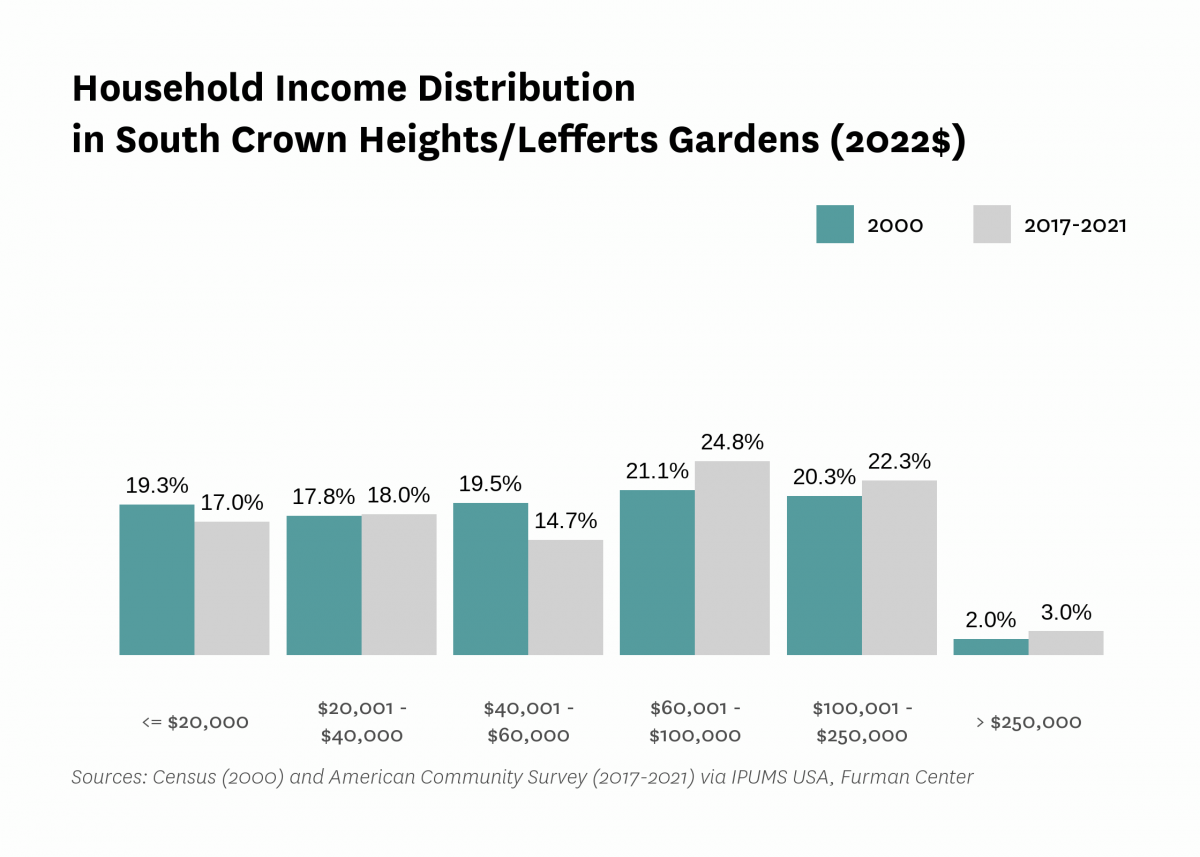
| Income diversity ratio | 4.6 | 5.0 | 4.4 | 6.7 | ||
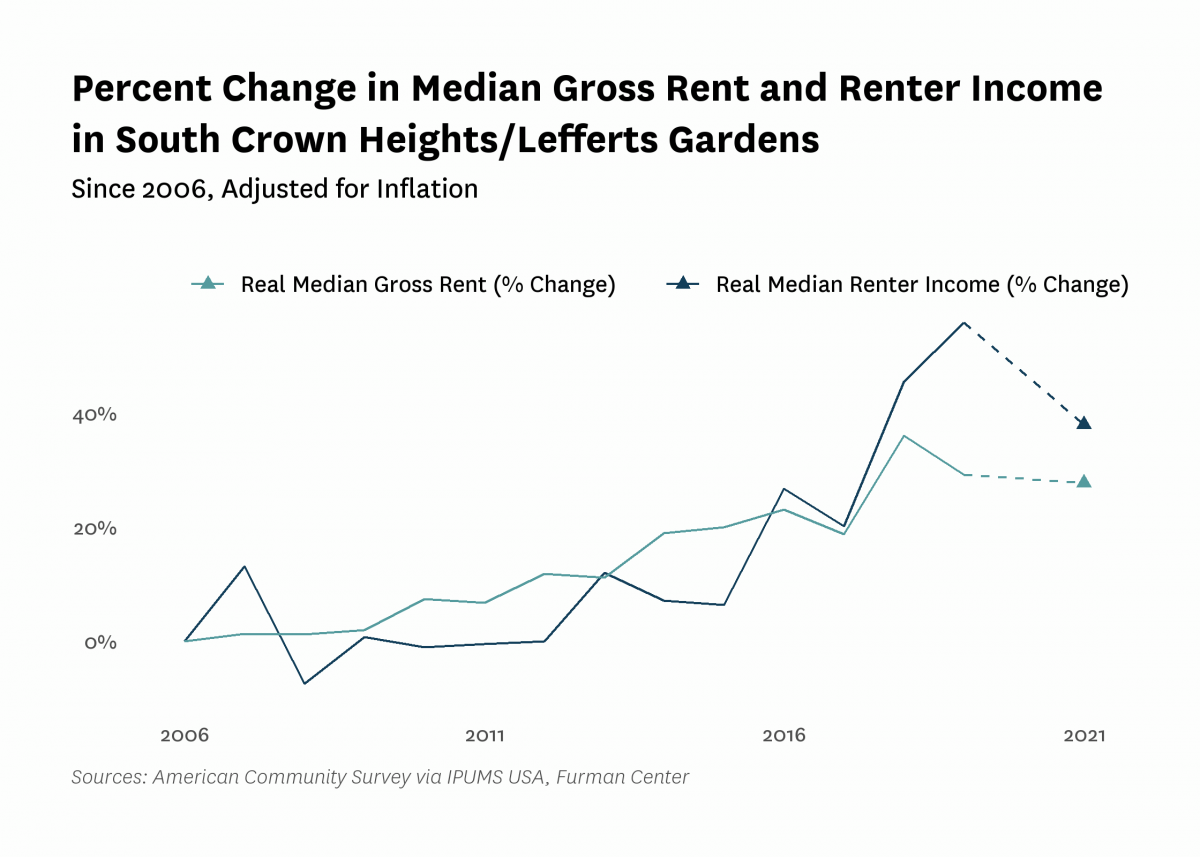
| Median household income (2022$) | $53,090 | $47,990 | $49,950 | $74,370 | $66,800 | |
| Median household income, homeowners (2022$) | $80,190 | $83,960 | $108,390 | $114,570 | ||
| Median household income, renters (2022$) | $43,700 | $43,260 | $68,160 | $60,360 | ||
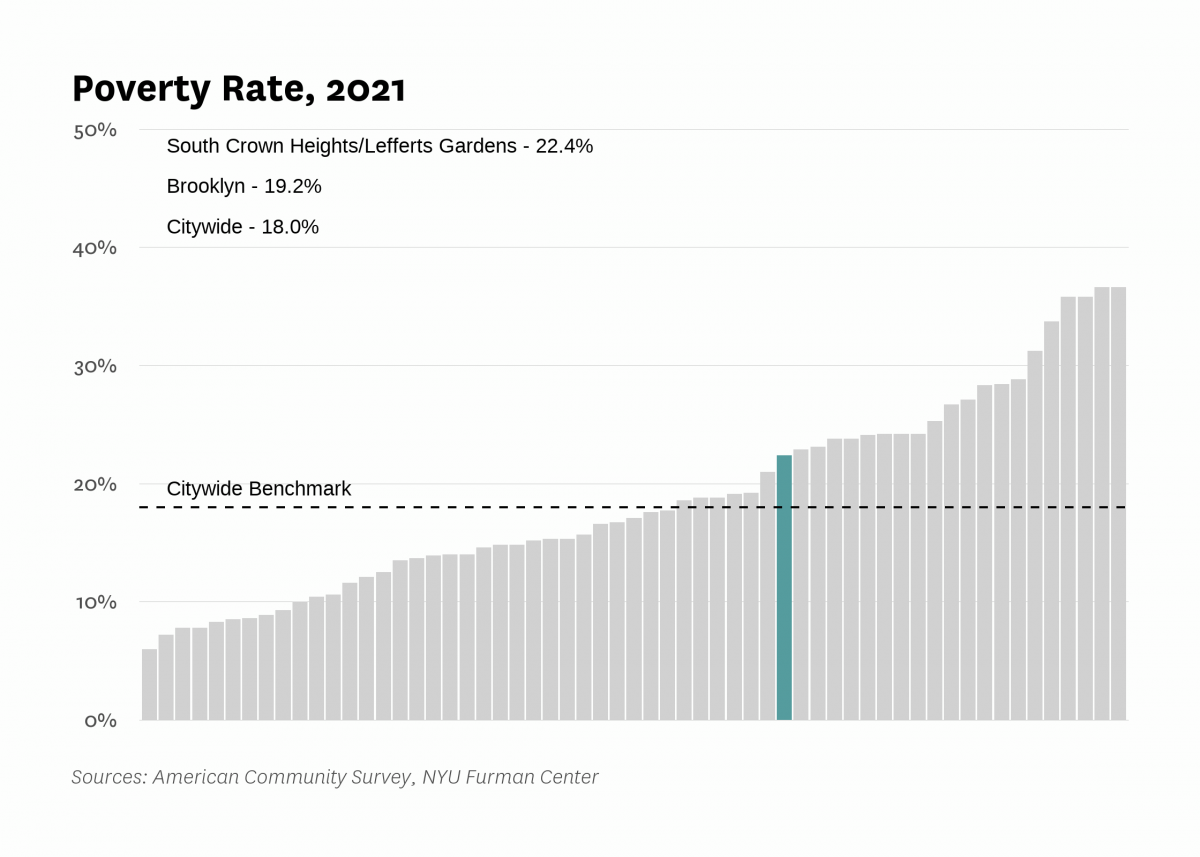
| Poverty rate | 24.0% | 22.3% | 25.6% | 17.9% | 22.4% | |
| Poverty rate, population aged 65+ | 18.4% | 19.2% | 20.6% | 23.8% | ||
| Poverty rate, population under 18 years old | 32.3% | 36.7% | 30.1% | 26.3% | ||
| Labor Market | ||||||
| Labor force participation rate | 63.6% | 66.6% | 66.3% | 65.9% | ||
| Population aged 25+ without a high school diploma | 21.5% | 18.3% | 11.1% | 12.6% | ||
| Unemployment rate | 13.59% | 11.31% | 20.20% | 4.46% | 13.16% | |
| Indicator | 2000 | 2006 | 2010 | 2019 | 2021 | 2022 |
|---|---|---|---|---|---|---|
| Housing Stock | ||||||
| Homeownership rate | 15.0% | 17.4% | 15.1% | 17.0% | 18.1% | |
| Housing units | 42,414 | 41,681 | 48,952 | 48,945 | ||
| Rental vacancy rate | 2.8% | 3.2% | 2.7% | |||
| Serious housing code violations (per 1,000 privately owned rental units) | 125.2 | 119.3 | 170.5 | 193.0 | 203.5 | |
| Severe crowding rate (% of renter households) | 4.4% | 4.0% | 4.2% | |||
| Total housing code violations (per 1,000 privately owned rental units) | 623.4 | 550.2 | 663.4 | 678.1 | 637.7 | |
| Finance - Distress | ||||||
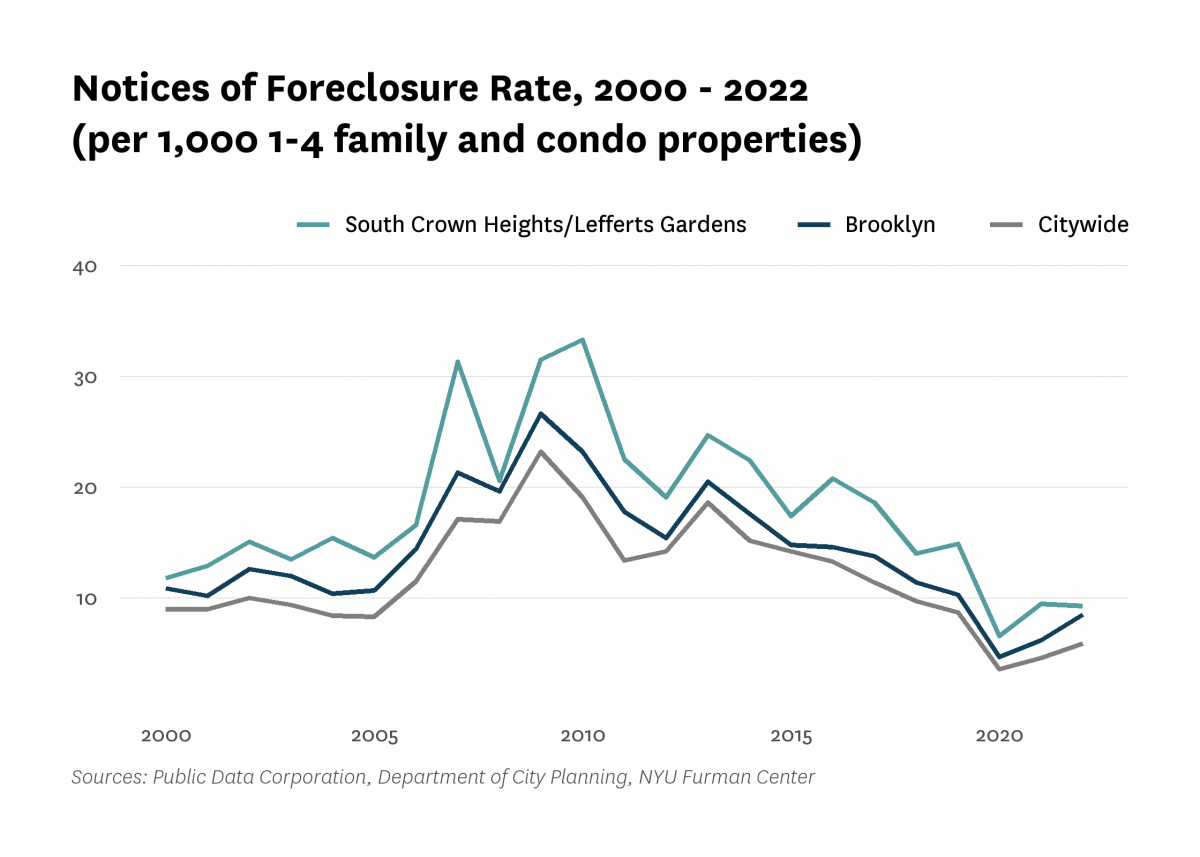
| Notices of foreclosure rate (per 1,000 1-4 family and condo properties) | 11.8 | 16.6 | 33.3 | 14.9 | 9.5 | 9.3 |
| Notices of foreclosure, all residential properties | 88 | 106 | 215 | 97 | 73 | 72 |
| Notices of foreclosure, initial, 1-4 family and condo properties | 45 | 77 | 123 | 37 | 18 | 21 |
| Notices of foreclosure, repeat, 1-4 family and condo properties | 16 | 14 | 65 | 50 | 40 | 37 |
| Pre-foreclosure notice rate (per 1,000 1-4 family and condo properties) | 66.4 | 26.1 | 56.9 | |||
| Pre-foreclosure notices, 1-4 family and condo properties | 389 | 162 | 354 | |||
| Properties entering REO, 1-4 family | 7 | 2 | 1 | |||
| Finance - Lending | ||||||
| FHA/VA-backed home purchase loans (% of home purchase loans) | 2.2% | 29.3% | 1.1% | 1.0% | ||
| Higher-cost home purchase loans (% of home purchase loans) | 36.4% | 3.3% | 1.1% | 0.3% | ||
| Higher-cost refinance loans (% of refinance loans) | 39.8% | 5.0% | 3.5% | 0.7% | ||
| Home purchase loan rate (per 1,000 properties) | 35.2 | 15.7 | 22.7 | 34.8 | ||
| Home purchase loans in LMI tracts (% of home purchase loans) | 76.6% | 8.9% | 70.3% | 65.0% | ||
| Home purchase loans to LMI borrowers (% of home purchase loans) | 6.6% | 59.3% | 4.9% | 2.0% | ||
| Refinance loan rate (per 1,000 properties) | 66.4 | 15.2 | 20.9 | 51.2 | ||
| Sales - Volume | ||||||
| Sales volume, 1 family building | 56 | 68 | 37 | 21 | 36 | 47 |
| Sales volume, 2-4 family building | 79 | 148 | 41 | 51 | 56 | 74 |
| Sales volume, 5+ family building | 17 | 51 | 19 | 10 | 10 | 16 |
| Sales volume, condominium | 19 | 60 | 26 | 24 | 109 | 102 |
| Sales volume, all property types | 171 | 327 | 123 | 106 | 211 | 239 |
| Sales - Median Prices | ||||||
| Median sales price per unit, 1 family building (2022$) | $380,670 | $895,850 | $791,890 | $1,449,440 | $1,729,470 | $1,397,500 |
| Median sales price per unit, 2-4 family building (2022$) | $197,980 | $351,570 | $229,630 | $543,540 | $513,710 | $543,750 |
| Median sales price per unit, 5+ family building (2022$) | $67,480 | $119,630 | $135,200 | $298,480 | $245,920 | $173,960 |
| Median sales price per unit, condominium (2022$) | $560,800 | $534,350 | $539,060 | $691,270 | $741,660 | $752,740 |
| Sales - Housing Price Index | ||||||
| Index of housing price appreciation, 1 family building | 100.0 | 241.8 | 197.5 | 437.1 | 518.0 | 553.5 |
| Index of housing price appreciation, 2-4 family building | 100.0 | 229.6 | 191.9 | 489.9 | 442.6 | 561.8 |
| Index of housing price appreciation, 5+ family building | 100.0 | 221.7 | 255.3 | 614.8 | 483.3 | 396.4 |
| Index of housing price appreciation, condominium | 100.0 | 126.5 | 101.0 | 156.1 | 192.6 | 163.9 |
| Index of housing price appreciation, all property types | 100.0 | 213.1 | 193.9 | 402.6 | 419.6 | 453.9 |
| Subsidized Housing | ||||||
| Total number of subsidized properties (properties) | 157 | |||||
| HUD Financing or Insurance (properties) | 14 | |||||
| HUD Financing or Insurance (units) | 232 | |||||
| HUD Project-based Rental Assistance Program (properties) | 30 | |||||
| HUD Project-based Rental Assistance Program (units) | 769 | |||||
| Low Income Housing Tax Credit (properties) | 22 | |||||
| Low Income Housing Tax Credit (units) | 1,162 | |||||
| Public Housing (properties) | 1 | |||||
| Public Housing (units) | 230 | |||||
| Mitchell-Lama (properties) | 4 | |||||
| Mitchell-Lama (units) | 1,016 | |||||
| 421-a Tax Exemption (properties) | 106 | |||||
| 421-a Tax Exemption (units) | 2,292 | |||||
| 420-c Tax Exemption (properties) | 6 | |||||
| 420-c Tax Exemption (units) | 281 | |||||
| NYC Housing Production Programs and Zoning Incentives or Requirements (properties) | 76 | |||||
| Eligible to expire from housing programs between 2023 and 2028 (properties) | 15 | |||||
| Eligible to expire from housing programs between 2023 and 2028 (units) | 454 | |||||
| Eligible to expire from housing programs between 2029 and 2038 (properties) | 4 | |||||
| Eligible to expire from housing programs between 2029 and 2038 (units) | 272 | |||||
| Eligible to expire from housing programs in 2039 and later (properties) | 23 | |||||
| Eligible to expire from housing programs in 2039 and later (units) | 1,379 | |||||
| Indicator | 2000 | 2006 | 2010 | 2019 | 2021 | 2022 |
|---|---|---|---|---|---|---|
| Density | ||||||
| Population density (1,000 persons per square mile) | 64.6 | 62.9 | 62.2 | 64.4 | ||
| Development | ||||||
| Units authorized by new residential building permits | 24 | 3 | 104 | 517 | 147 | 806 |
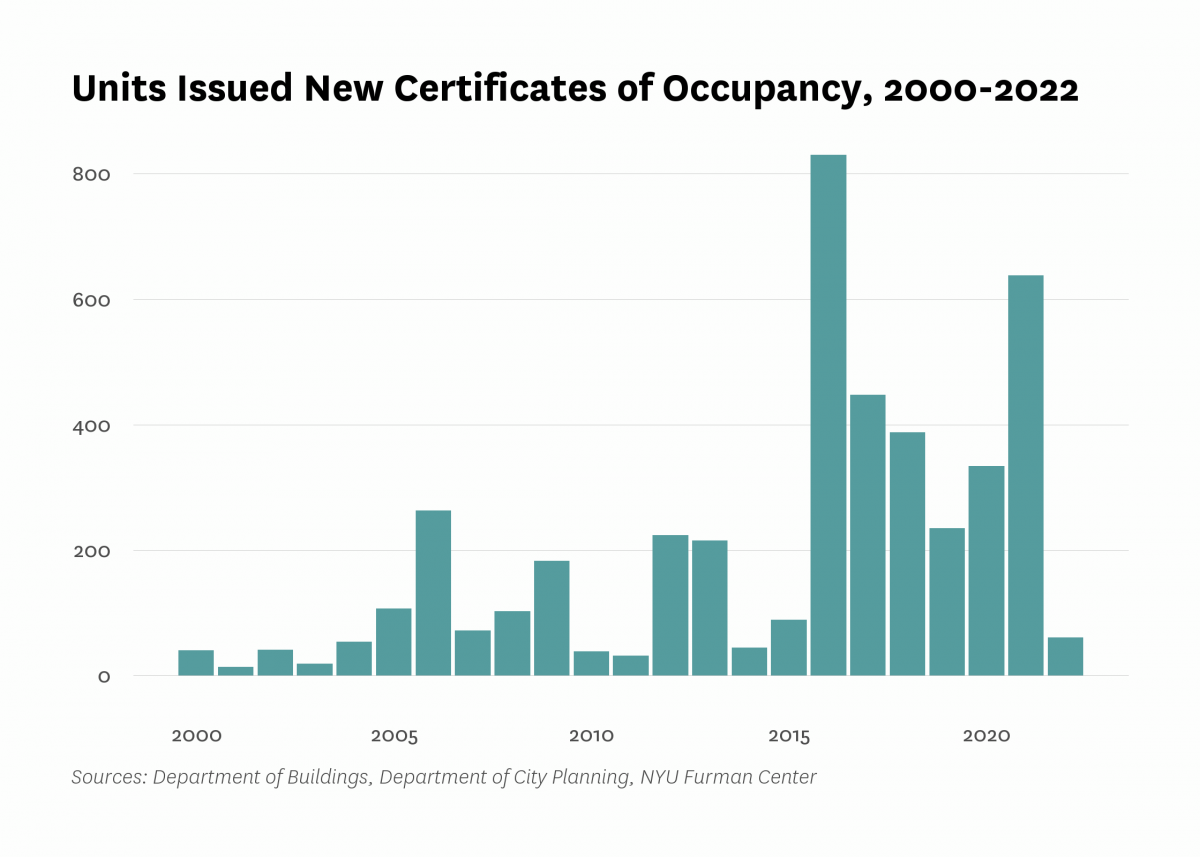
| Units issued new certificates of occupancy | 40 | 263 | 39 | 235 | 638 | 61 |
| Indicator | 2000 | 2006 | 2010 | 2019 | 2021 | 2022 |
|---|---|---|---|---|---|---|
| Commute | ||||||
| Car-free commute (% of commuters) | 76.5% | 78.5% | 79.4% | 86.4% | 71.3% | |
| Mean travel time to work (minutes) | 46.4 | 42.3 | 41.9 | 46.7 | 40.2 | |
| Crime and Incarceration | ||||||
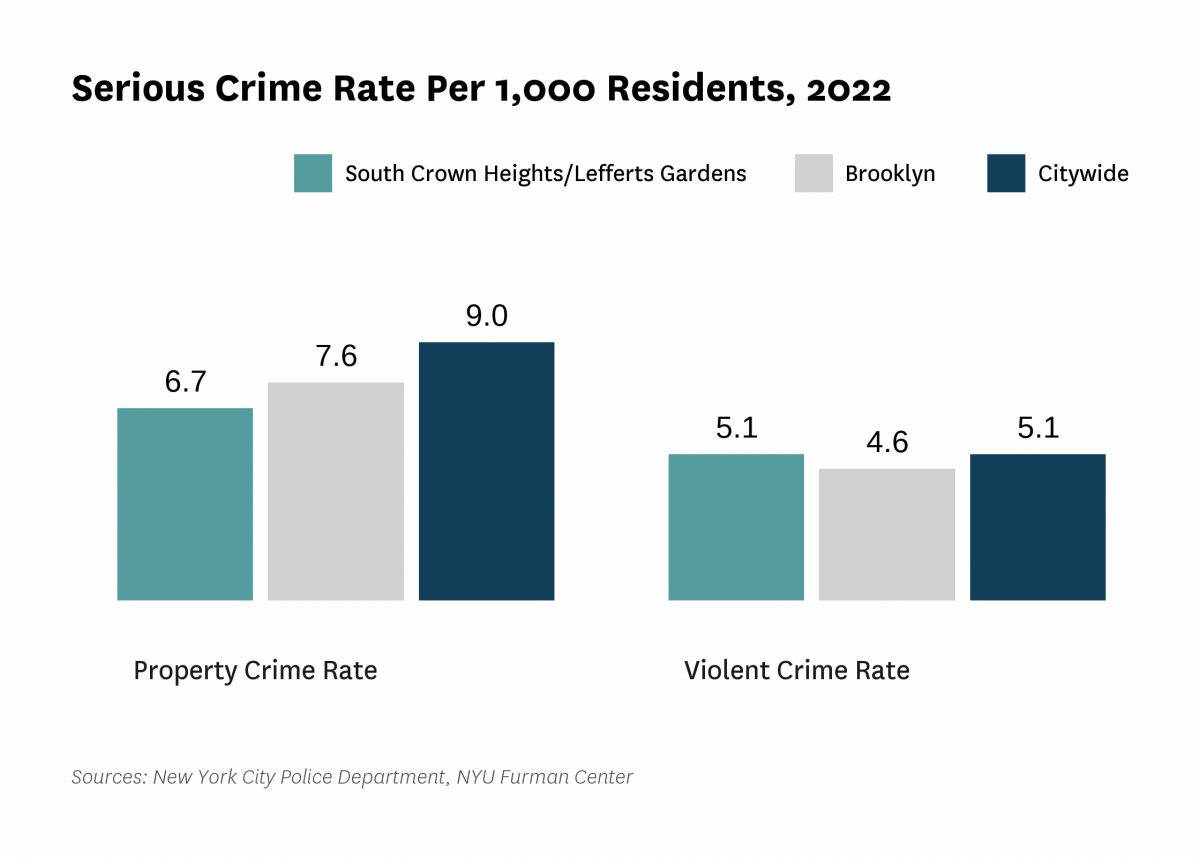
| Serious crime rate (per 1,000 residents) | 16.7 | 14.7 | 11.2 | 9.3 | 11.8 | |
| Serious crime rate, property (per 1,000 residents) | 9.5 | 8.7 | 6.3 | 5.0 | 6.7 | |
| Serious crime rate, violent (per 1,000 residents) | 7.2 | 5.9 | 4.9 | 4.3 | 5.1 | |
| Schools | ||||||
| Students performing at grade level in English language arts, 4th grade | 42.7% | 32.8% | ||||
| Students performing at grade level in math, 4th grade | 42.6% | 20.2% | ||||
| Indicator | 2000 | 2006 | 2010 | 2019 | 2021 | 2022 |
|---|---|---|---|---|---|---|
| Median Rent | ||||||
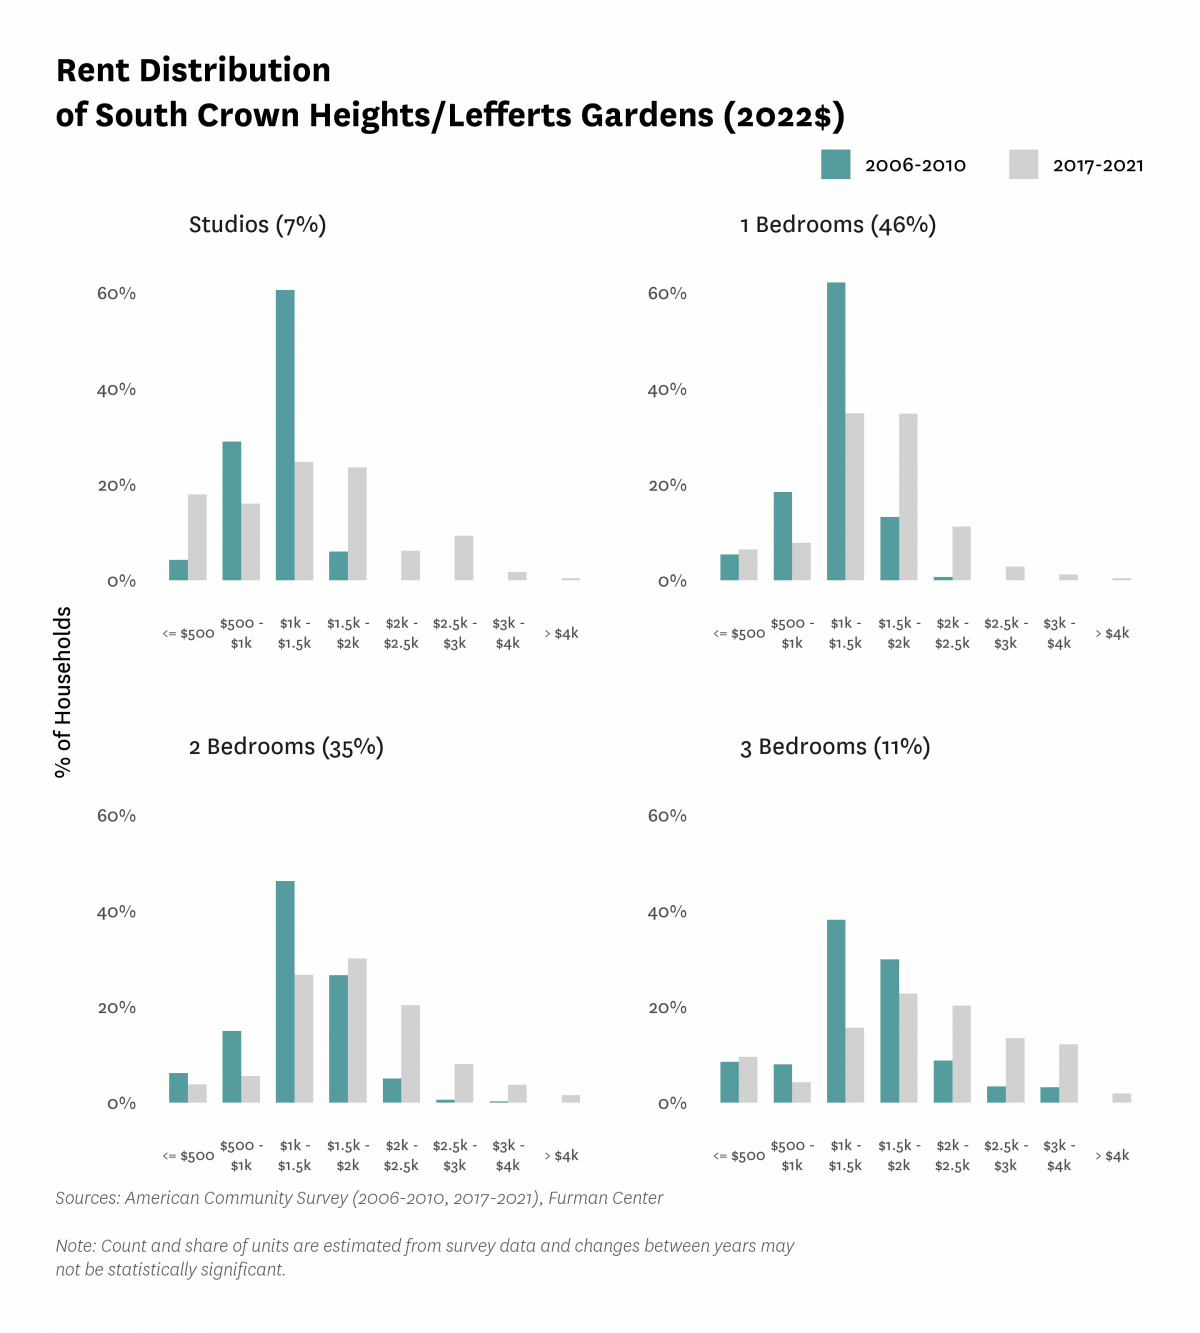
| Median rent, 2- and 3-bedrooms (2022$) | $1,350 | $1,650 | $1,790 | |||
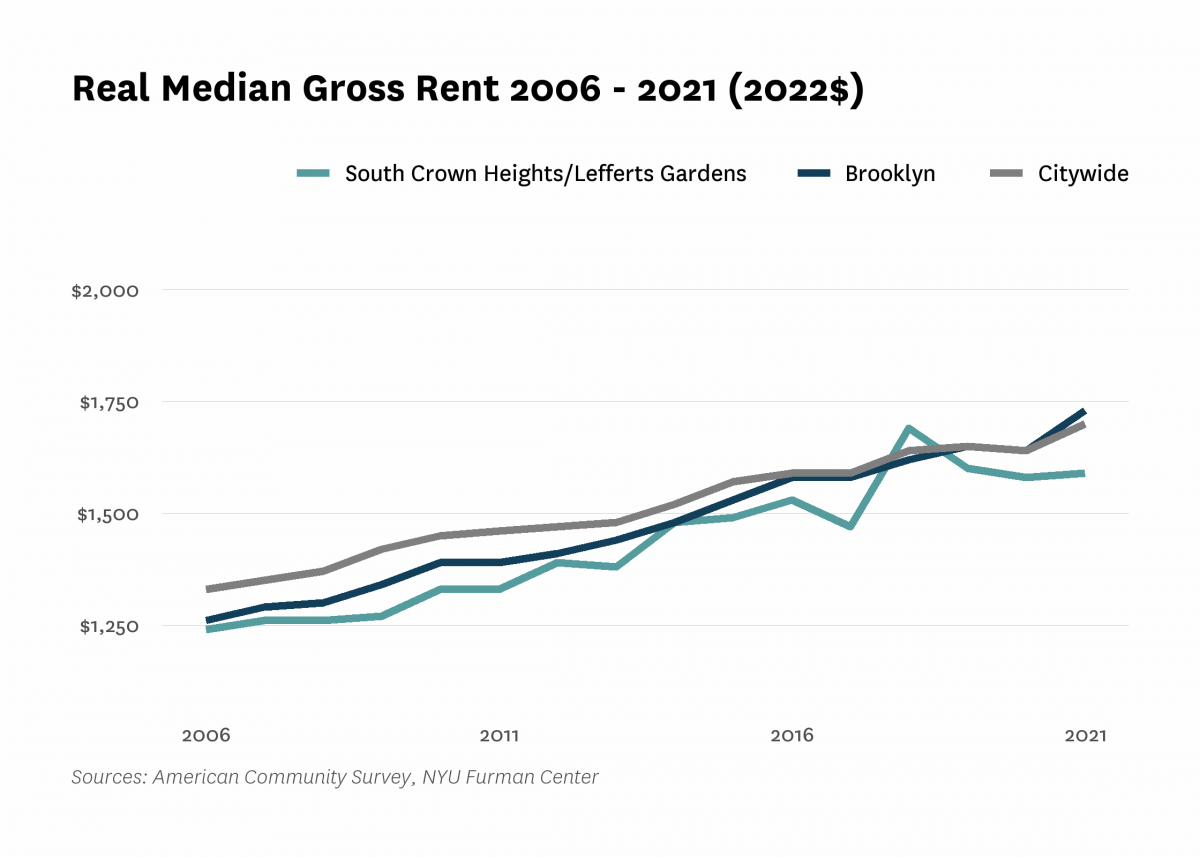
| Median rent, all (2022$) | $1,130 | $1,240 | $1,330 | $1,600 | $1,590 | |
| Median rent, recent movers (2022$) | $1,400 | $1,900 | $2,080 | |||
| Median rent, studios and 1-bedrooms (2022$) | $1,200 | $1,380 | $1,500 | |||
| Change in collected rent (2019-2020) | 2.0% | |||||
| Affordability | ||||||
| Rental units affordable at 30% AMI (% of recently available units) | 5.0% | 9.1% | 7.1% | |||
| Rental units affordable at 80% AMI (% of recently available units) | 70.9% | 60.1% | 50.8% | |||
| Rental units affordable at 120% AMI (% of recently available units) | 97.8% | 92.5% | 91.8% | |||
| Rent Burden | ||||||
| Moderately rent-burdened households | 26.0% | 23.6% | 25.1% | 18.5% | ||
| Moderately rent-burdened households, low income | 32.6% | 31.5% | 33.5% | |||
| Moderately rent-burdened households, moderate income | 6.3% | 15.0% | 13.9% | |||
| Severely rent-burdened households | 25.2% | 30.0% | 30.3% | 28.7% | ||
| Severely rent-burdened households, low income | 45.1% | 45.9% | 44.9% | |||
| Severely rent-burdened households, moderate income | 0.0% | 0.0% | 0.0% | |||
| Rental Subsidy | ||||||
| Housing choice vouchers (% of occupied, privately owned rental units) | 3.4% | 3.2% | ||||
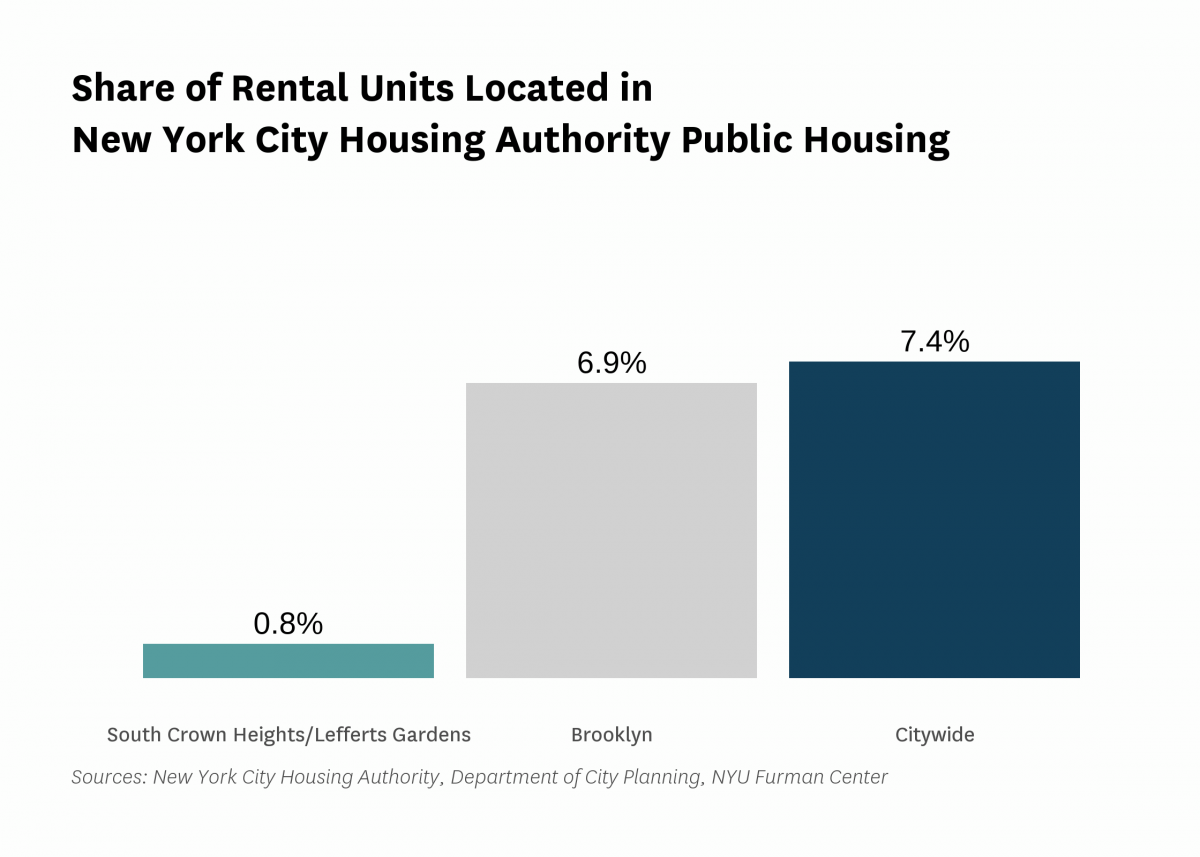
| Public housing (% of rental units) | 0.8% | |||||
Data Notes: See CoreData User Guide for more information about indicator definitions and methods.
Indicators: The rental vacancy rate, severe crowding rate, and the severely rent-burdened households indicators use five-year American Community Survey (ACS) estimates. Data under the 2010 heading comes from the 2006 – 2010 ACS, data under the 2019 heading comes from the 2015 – 2019 ACS and data under the 2021 heading comes from 2017 – 2021 ACS .
All content © 2005 – 2024 Furman Center for Real Estate and Urban Policy | Top of page | Contact Us