| Indicator | 2000 | 2006 | 2010 | 2019 | 2021 | 2022 |
|---|---|---|---|---|---|---|
| Population | ||||||
| Born in New York State | 55.2% | 50.8% | 54.2% | 51.2% | ||
| Disabled population | 7.1% | 7.9% | 12.3% | |||
| Foreign-born population | 31.5% | 32.1% | 32.6% | 31.4% | 36.7% | |
| Population | 113,003 | 111,199 | 109,153 | 104,149 | 109,361 | |
| Population aged 65+ | 16.6% | 15.9% | 14.8% | 21.8% | 21.2% | |
| Households | ||||||
| Households with children under 18 years old | 32.1% | 30.2% | 28.3% | 26.3% | 29.1% | |
| Single-person households | 35.8% | 32.9% | 39.6% | 34.9% | ||
| Race and Ethnicity | ||||||
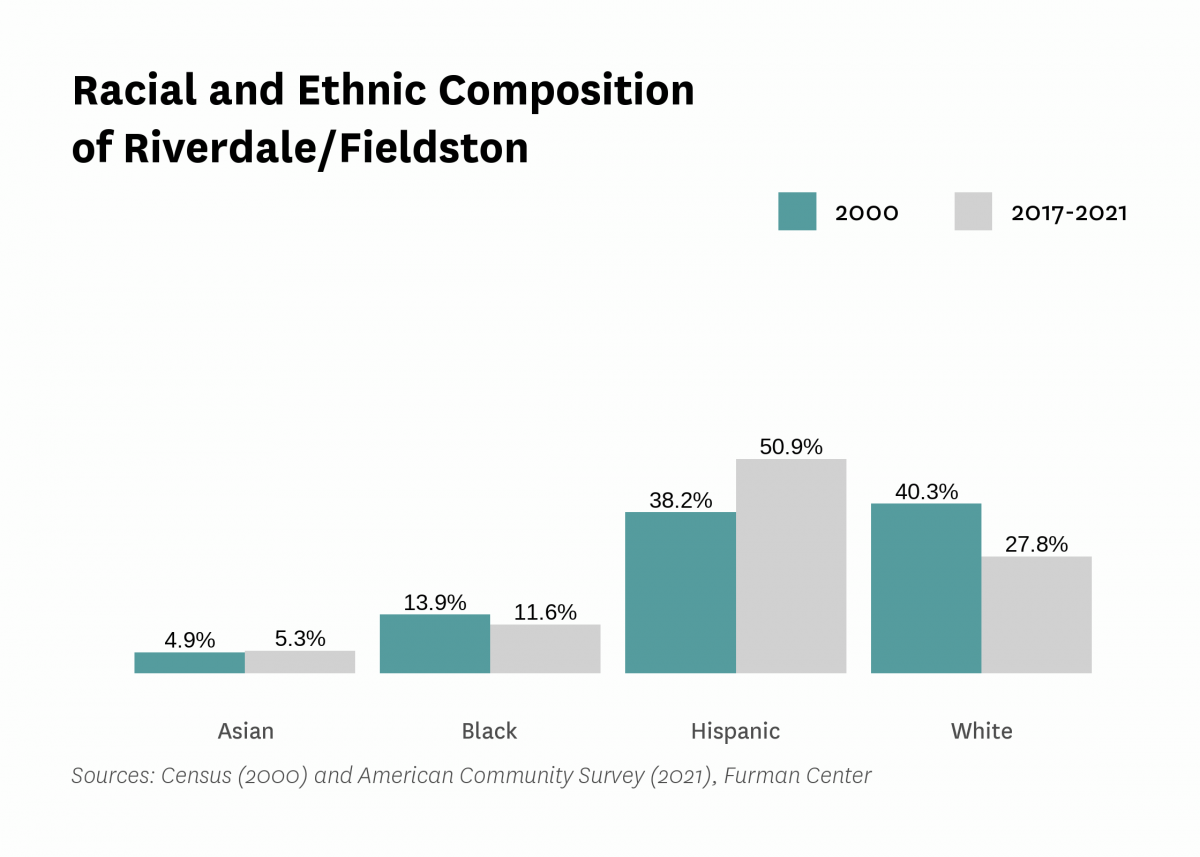
| Percent Asian | 4.9% | 5.5% | 5.2% | 4.4% | 5.3% | |
| Percent Black | 13.9% | 13.7% | 13.3% | 9.1% | 11.6% | |
| Percent Hispanic | 38.2% | 39.2% | 42.3% | 51.3% | 50.9% | |
| Percent white | 40.3% | 39.7% | 37.7% | 31.2% | 27.8% | |
| Racial diversity index | 0.67 | 0.67 | 0.66 | 0.63 | 0.65 | |
| Income and Poverty | ||||||
| Income diversity ratio | 4.4 | 5.3 | 5.9 | 5.1 | ||
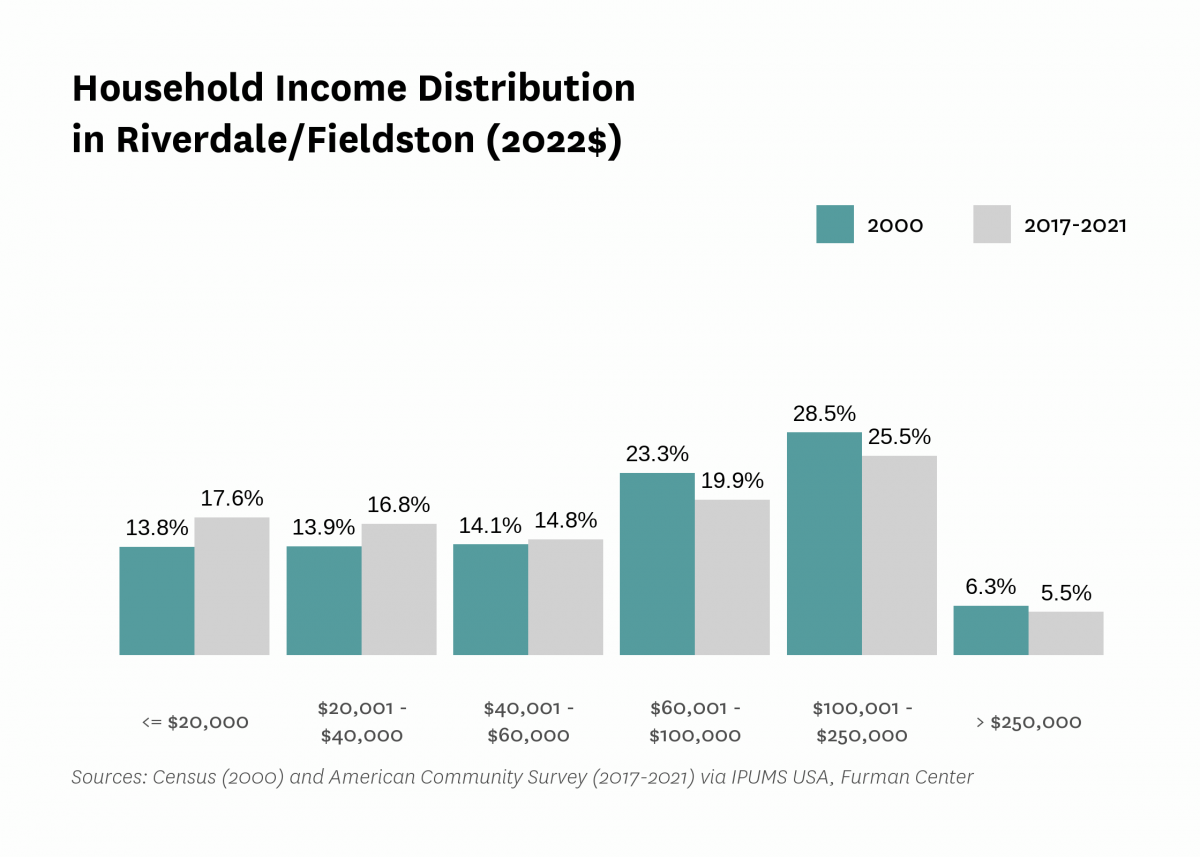
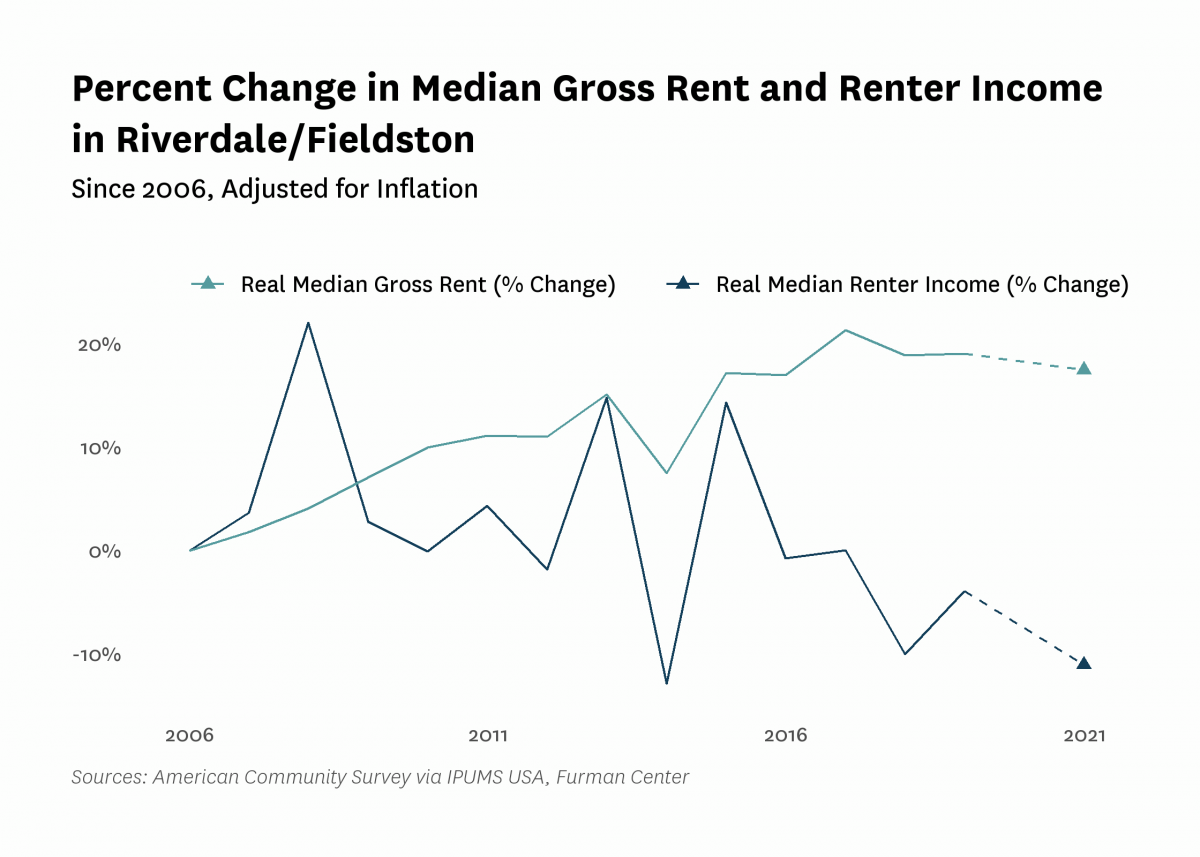
| Median household income (2022$) | $73,590 | $69,090 | $64,440 | $68,290 | $66,040 | |
| Median household income, homeowners (2022$) | $101,650 | $103,580 | $113,330 | $120,580 | ||
| Median household income, renters (2022$) | $54,300 | $54,270 | $52,190 | $48,310 | ||
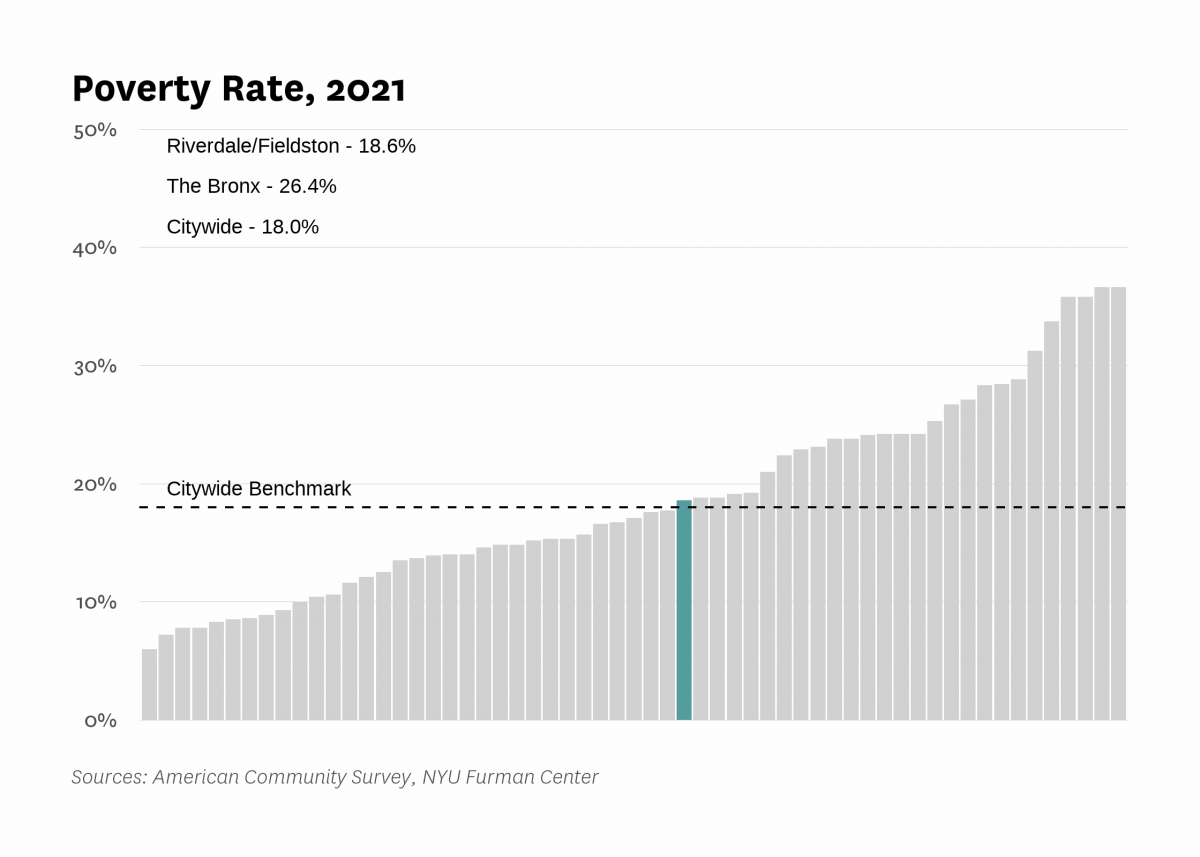
| Poverty rate | 18.7% | 15.0% | 18.5% | 16.5% | 18.6% | |
| Poverty rate, population aged 65+ | 15.6% | 12.1% | 10.7% | 12.9% | ||
| Poverty rate, population under 18 years old | 24.8% | 28.5% | 27.4% | 21.4% | ||
| Labor Market | ||||||
| Labor force participation rate | 62.6% | 63.2% | 57.1% | 56.4% | ||
| Population aged 25+ without a high school diploma | 17.4% | 15.2% | 18.9% | 13.2% | ||
| Unemployment rate | 10.42% | 12.24% | 13.96% | 5.62% | 12.77% | |
| Indicator | 2000 | 2006 | 2010 | 2019 | 2021 | 2022 |
|---|---|---|---|---|---|---|
| Housing Stock | ||||||
| Homeownership rate | 26.4% | 30.2% | 30.1% | 28.1% | 33.8% | |
| Housing units | 46,275 | 46,190 | 43,681 | 44,995 | ||
| Rental vacancy rate | 3.6% | 2.3% | 1.6% | |||
| Serious housing code violations (per 1,000 privately owned rental units) | 78.1 | 83.6 | 109.0 | 121.6 | 134.2 | |
| Severe crowding rate (% of renter households) | 3.4% | 4.7% | 4.5% | |||
| Total housing code violations (per 1,000 privately owned rental units) | 355.4 | 421.6 | 376.1 | 416.7 | 390.3 | |
| Finance - Distress | ||||||
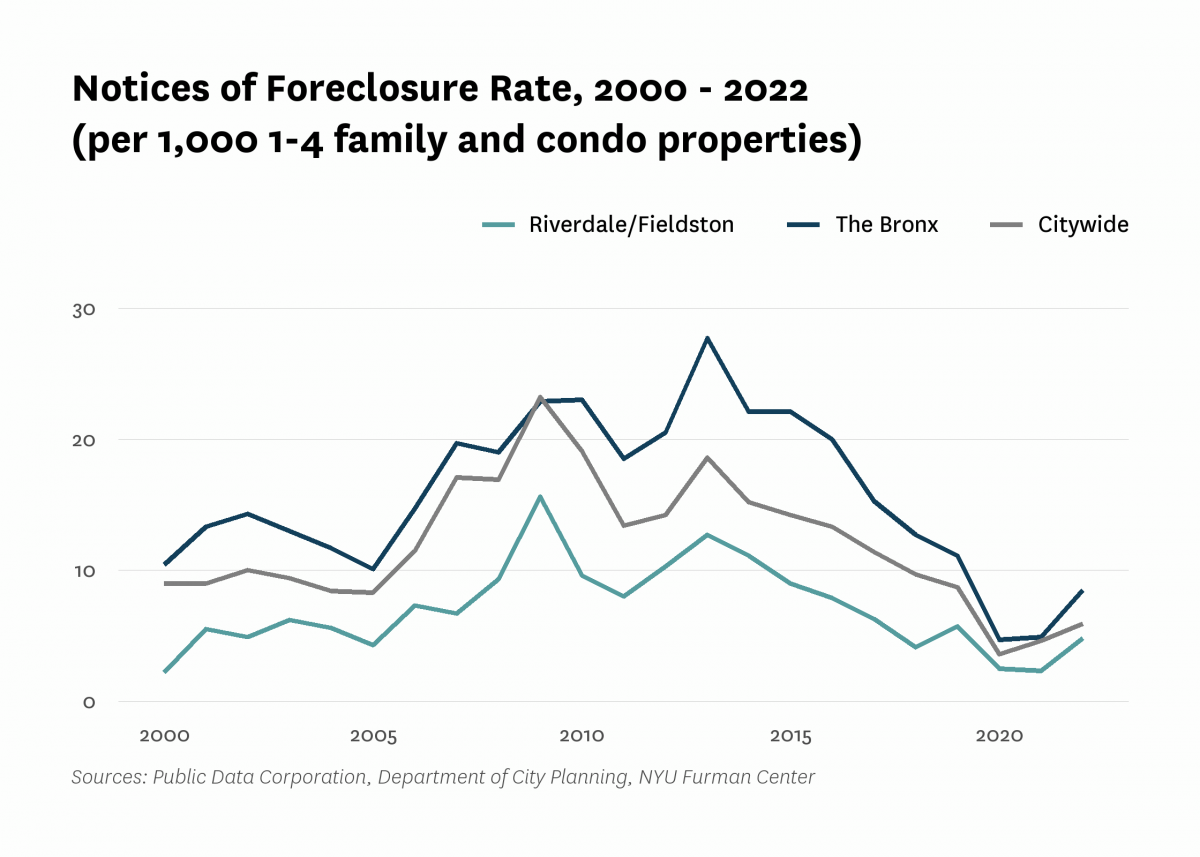
| Notices of foreclosure rate (per 1,000 1-4 family and condo properties) | 2.2 | 7.3 | 9.6 | 5.7 | 2.3 | 4.8 |
| Notices of foreclosure, all residential properties | 11 | 32 | 48 | 26 | 10 | 22 |
| Notices of foreclosure, initial, 1-4 family and condo properties | 5 | 22 | 35 | 13 | 4 | 8 |
| Notices of foreclosure, repeat, 1-4 family and condo properties | 3 | 8 | 7 | 12 | 6 | 13 |
| Pre-foreclosure notice rate (per 1,000 1-4 family and condo properties) | 39.9 | 19.0 | 36.0 | |||
| Pre-foreclosure notices, 1-4 family and condo properties | 176 | 84 | 159 | |||
| Properties entering REO, 1-4 family | 2 | 0 | 4 | |||
| Finance - Lending | ||||||
| FHA/VA-backed home purchase loans (% of home purchase loans) | 0.0% | 5.9% | 1.4% | 1.6% | ||
| Higher-cost home purchase loans (% of home purchase loans) | 7.8% | 0.5% | 1.2% | 1.1% | ||
| Higher-cost refinance loans (% of refinance loans) | 18.0% | 1.4% | 4.3% | 0.0% | ||
| Home purchase loan rate (per 1,000 properties) | 32.3 | 18.3 | 21.0 | 30.9 | ||
| Home purchase loans in LMI tracts (% of home purchase loans) | 17.5% | 7.0% | 5.3% | 4.3% | ||
| Home purchase loans to LMI borrowers (% of home purchase loans) | 10.6% | 4.8% | 11.3% | 10.8% | ||
| Refinance loan rate (per 1,000 properties) | 18.5 | 20.4 | 9.0 | 28.2 | ||
| Sales - Volume | ||||||
| Sales volume, 1 family building | 55 | 87 | 50 | 36 | 60 | 74 |
| Sales volume, 2-4 family building | 33 | 89 | 23 | 34 | 25 | 46 |
| Sales volume, 5+ family building | 5 | 26 | 12 | 7 | 4 | 6 |
| Sales volume, condominium | 19 | 26 | 43 | 23 | 41 | 28 |
| Sales volume, all property types | 112 | 228 | 128 | 100 | 130 | 154 |
| Sales - Median Prices | ||||||
| Median sales price per unit, 1 family building (2022$) | $591,390 | $824,890 | $788,670 | $959,980 | $954,920 | $959,750 |
| Median sales price per unit, 2-4 family building (2022$) | $220,920 | $379,420 | $331,560 | $413,460 | $464,200 | $411,670 |
| Median sales price per unit, 5+ family building (2022$) | $124,060 | $107,360 | $104,040 | $215,950 | $218,180 | $197,120 |
| Median sales price per unit, condominium (2022$) | $382,370 | $790,460 | $633,240 | $752,600 | $657,840 | $656,500 |
| Sales - Housing Price Index | ||||||
| Index of housing price appreciation, 1 family building | 100.0 | 191.7 | 183.8 | 229.1 | 281.8 | 267.2 |
| Index of housing price appreciation, 2-4 family building | 100.0 | 180.3 | 171.4 | 264.4 | 303.3 | 254.8 |
| Index of housing price appreciation, 5+ family building | 100.0 | 189.4 | 139.3 | 221.8 | 300.2 | |
| Index of housing price appreciation, condominium | 100.0 | 222.8 | 236.5 | 236.0 | 238.7 | 283.4 |
| Index of housing price appreciation, all property types | 100.0 | 196.3 | 184.7 | 236.6 | 266.5 | 270.0 |
| Subsidized Housing | ||||||
| Total number of subsidized properties (properties) | 58 | |||||
| HUD Financing or Insurance (properties) | 4 | |||||
| HUD Financing or Insurance (units) | 224 | |||||
| HUD Project-based Rental Assistance Program (properties) | 3 | |||||
| HUD Project-based Rental Assistance Program (units) | 281 | |||||
| Low Income Housing Tax Credit (properties) | 5 | |||||
| Low Income Housing Tax Credit (units) | 326 | |||||
| Public Housing (properties) | 5 | |||||
| Public Housing (units) | 2,040 | |||||
| Mitchell-Lama (properties) | 16 | |||||
| Mitchell-Lama (units) | 2,344 | |||||
| 421-a Tax Exemption (properties) | 42 | |||||
| 421-a Tax Exemption (units) | 1,524 | |||||
| 420-c Tax Exemption (properties) | 3 | |||||
| 420-c Tax Exemption (units) | 104 | |||||
| NYC Housing Production Programs and Zoning Incentives or Requirements (properties) | 19 | |||||
| Eligible to expire from housing programs between 2023 and 2028 (properties) | 2 | |||||
| Eligible to expire from housing programs between 2023 and 2028 (units) | 176 | |||||
| Eligible to expire from housing programs between 2029 and 2038 (properties) | 2 | |||||
| Eligible to expire from housing programs between 2029 and 2038 (units) | 138 | |||||
| Eligible to expire from housing programs in 2039 and later (properties) | 9 | |||||
| Eligible to expire from housing programs in 2039 and later (units) | 430 | |||||
| Indicator | 2000 | 2006 | 2010 | 2019 | 2021 | 2022 |
|---|---|---|---|---|---|---|
| Density | ||||||
| Population density (1,000 persons per square mile) | 32.5 | 31.9 | 30.4 | 31.9 | ||
| Development | ||||||
| Units authorized by new residential building permits | 97 | 0 | 76 | 91 | 111 | 332 |
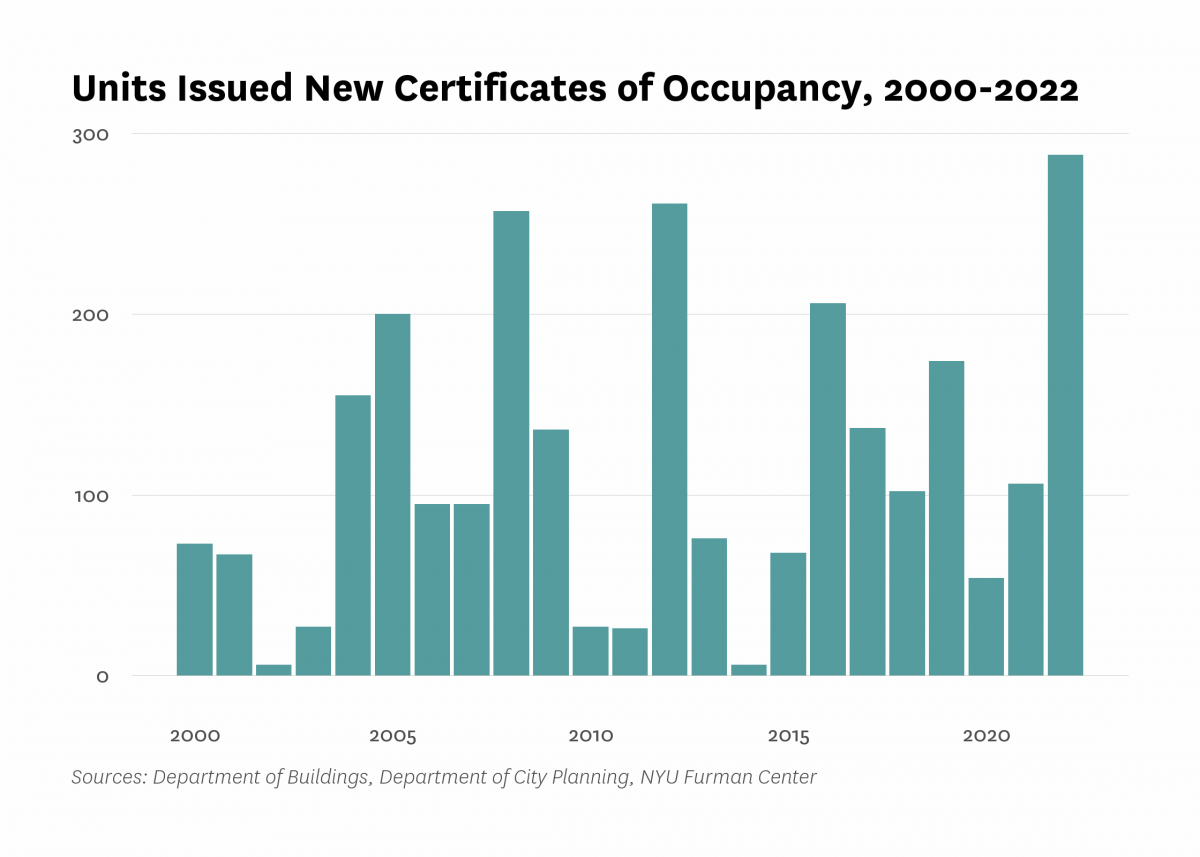
| Units issued new certificates of occupancy | 73 | 95 | 27 | 174 | 106 | 288 |
| Indicator | 2000 | 2006 | 2010 | 2019 | 2021 | 2022 |
|---|---|---|---|---|---|---|
| Commute | ||||||
| Car-free commute (% of commuters) | 55.0% | 58.5% | 67.0% | 68.4% | 60.3% | |
| Mean travel time to work (minutes) | 41.0 | 42.6 | 44.6 | 45.0 | 37.8 | |
| Crime and Incarceration | ||||||
| Serious crime rate (per 1,000 residents) | 10.7 | 9.4 | 9.4 | 9.6 | 13.7 | |
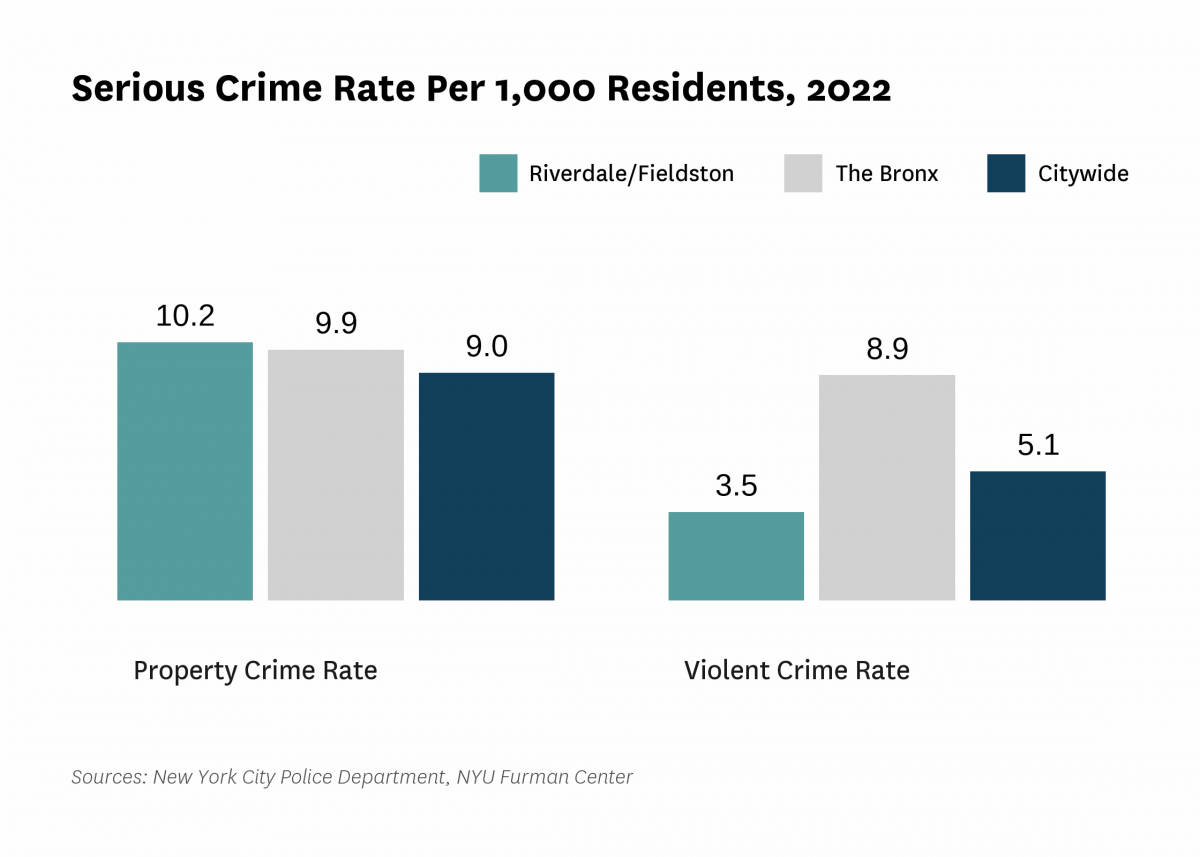
| Serious crime rate, property (per 1,000 residents) | 7.5 | 6.5 | 6.9 | 7.1 | 10.2 | |
| Serious crime rate, violent (per 1,000 residents) | 3.2 | 2.9 | 2.4 | 2.5 | 3.5 | |
| Schools | ||||||
| Students performing at grade level in English language arts, 4th grade | 53.9% | 43.1% | ||||
| Students performing at grade level in math, 4th grade | 51.8% | 41.8% | ||||
| Indicator | 2000 | 2006 | 2010 | 2019 | 2021 | 2022 |
|---|---|---|---|---|---|---|
| Median Rent | ||||||
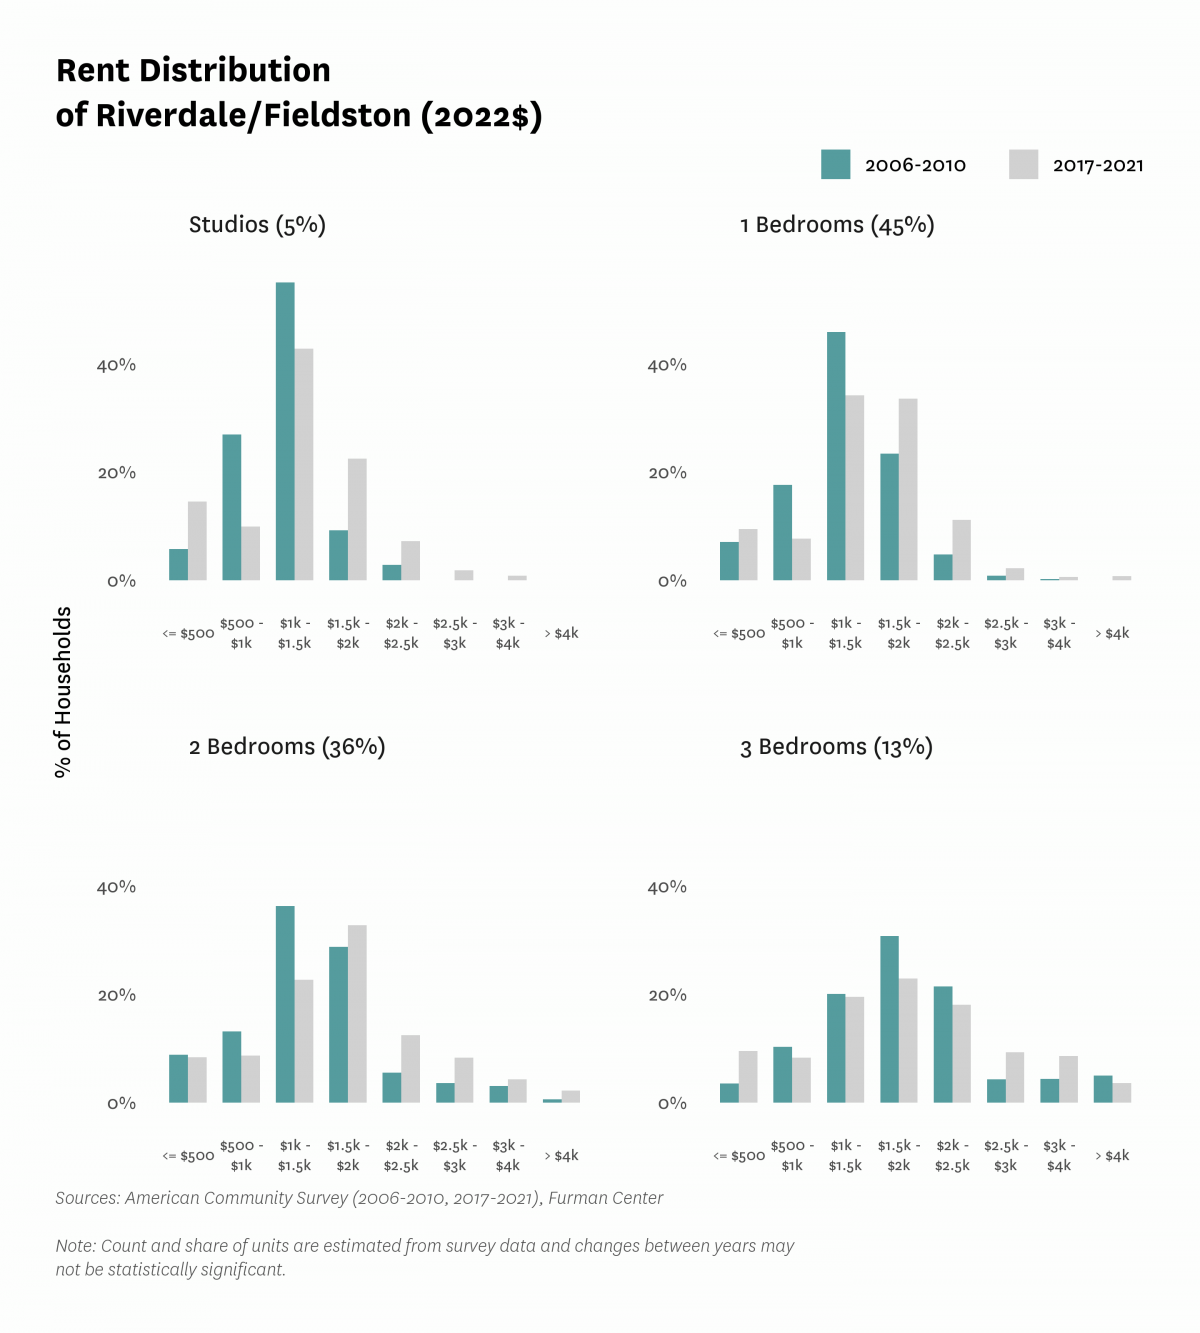
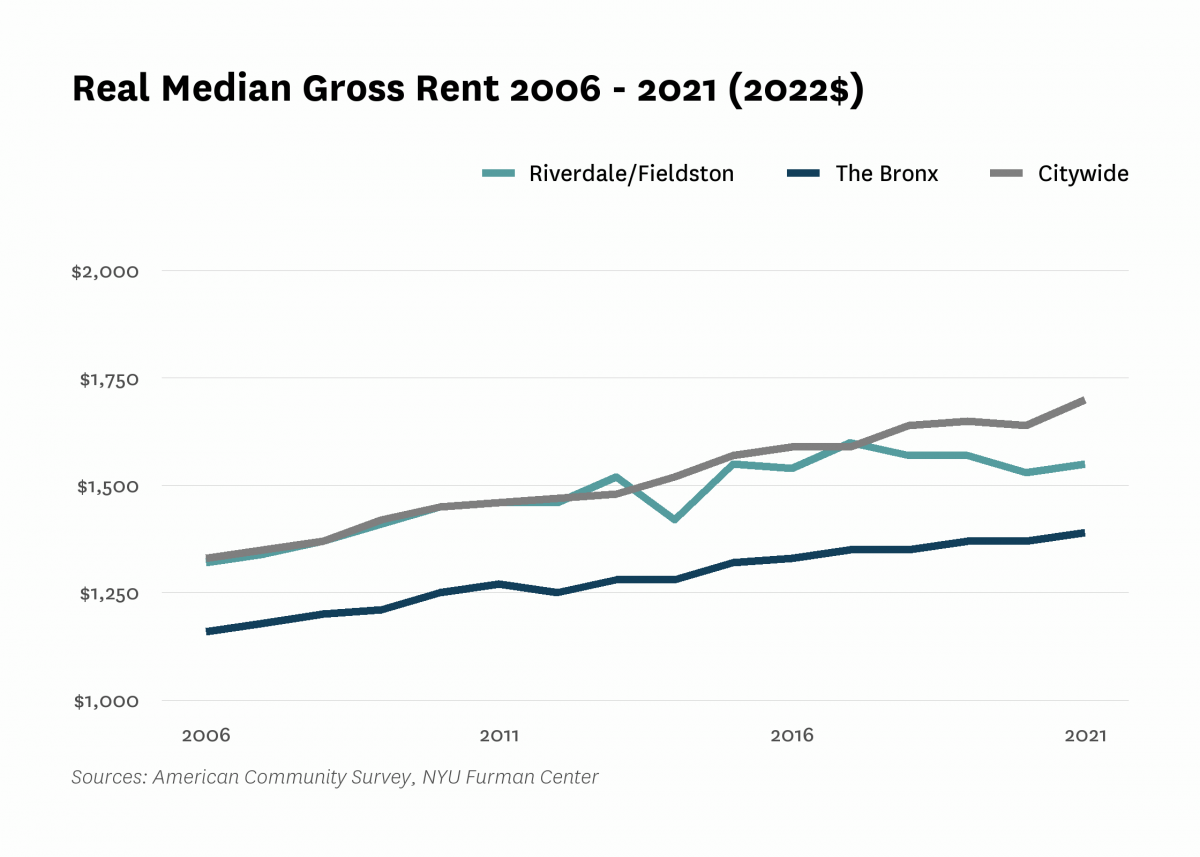
| Median rent, 2- and 3-bedrooms (2022$) | $1,490 | $1,620 | $1,720 | |||
| Median rent, all (2022$) | $1,240 | $1,320 | $1,450 | $1,570 | $1,550 | |
| Median rent, recent movers (2022$) | $1,450 | $1,840 | $1,890 | |||
| Median rent, studios and 1-bedrooms (2022$) | $1,300 | $1,430 | $1,480 | |||
| Change in collected rent (2019-2020) | 2.0% | |||||
| Affordability | ||||||
| Rental units affordable at 30% AMI (% of recently available units) | 9.1% | 6.0% | 5.1% | |||
| Rental units affordable at 80% AMI (% of recently available units) | 65.1% | 61.2% | 64.4% | |||
| Rental units affordable at 120% AMI (% of recently available units) | 92.4% | 91.7% | 90.6% | |||
| Rent Burden | ||||||
| Moderately rent-burdened households | 23.4% | 23.5% | 24.0% | 23.4% | ||
| Moderately rent-burdened households, low income | 31.6% | 33.3% | 32.9% | |||
| Moderately rent-burdened households, moderate income | 10.9% | 12.4% | 8.1% | |||
| Severely rent-burdened households | 21.6% | 25.0% | 29.9% | 30.4% | ||
| Severely rent-burdened households, low income | 41.0% | 43.3% | 44.2% | |||
| Severely rent-burdened households, moderate income | 1.5% | 0.6% | 3.0% | |||
| Rental Subsidy | ||||||
| Housing choice vouchers (% of occupied, privately owned rental units) | 8.0% | 8.5% | ||||
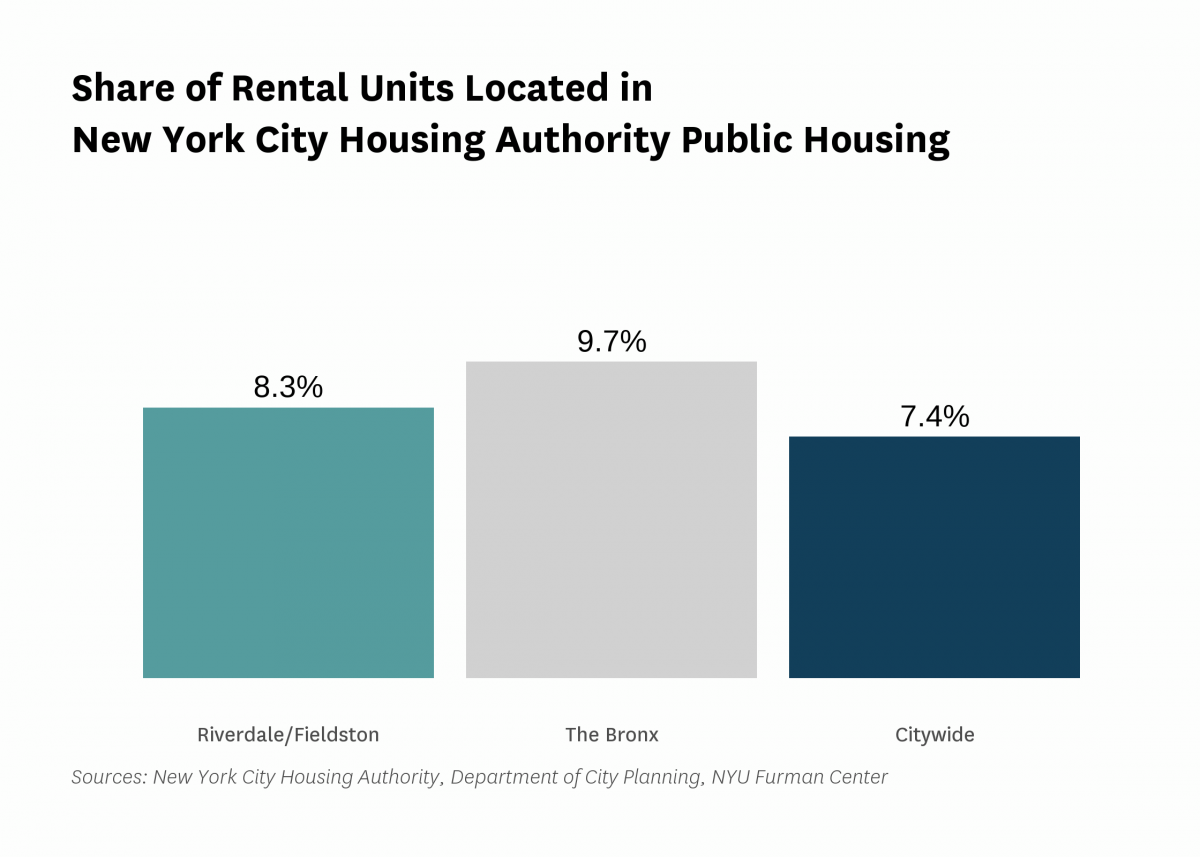
| Public housing (% of rental units) | 8.3% | |||||
Data Notes: See CoreData User Guide for more information about indicator definitions and methods.
Indicators: The rental vacancy rate, severe crowding rate, and the severely rent-burdened households indicators use five-year American Community Survey (ACS) estimates. Data under the 2010 heading comes from the 2006 – 2010 ACS, data under the 2019 heading comes from the 2015 – 2019 ACS and data under the 2021 heading comes from 2017 – 2021 ACS .
All content © 2005 – 2024 Furman Center for Real Estate and Urban Policy | Top of page | Contact Us