| Indicator | 2000 | 2006 | 2010 | 2019 | 2021 | 2022 |
|---|---|---|---|---|---|---|
| Population | ||||||
| Born in New York State | 54.6% | 55.7% | 53.4% | 50.5% | ||
| Disabled population | 5.9% | 5.7% | 5.5% | |||
| Foreign-born population | 35.9% | 40.0% | 39.0% | 36.0% | 39.8% | |
| Population | 167,201 | 179,768 | 180,932 | 165,895 | 168,184 | |
| Population aged 65+ | 13.8% | 12.5% | 12.7% | 14.1% | 14.6% | |
| Households | ||||||
| Households with children under 18 years old | 35.0% | 37.8% | 36.4% | 29.2% | 25.3% | |
| Single-person households | 23.9% | 22.9% | 26.2% | 24.9% | ||
| Race and Ethnicity | ||||||
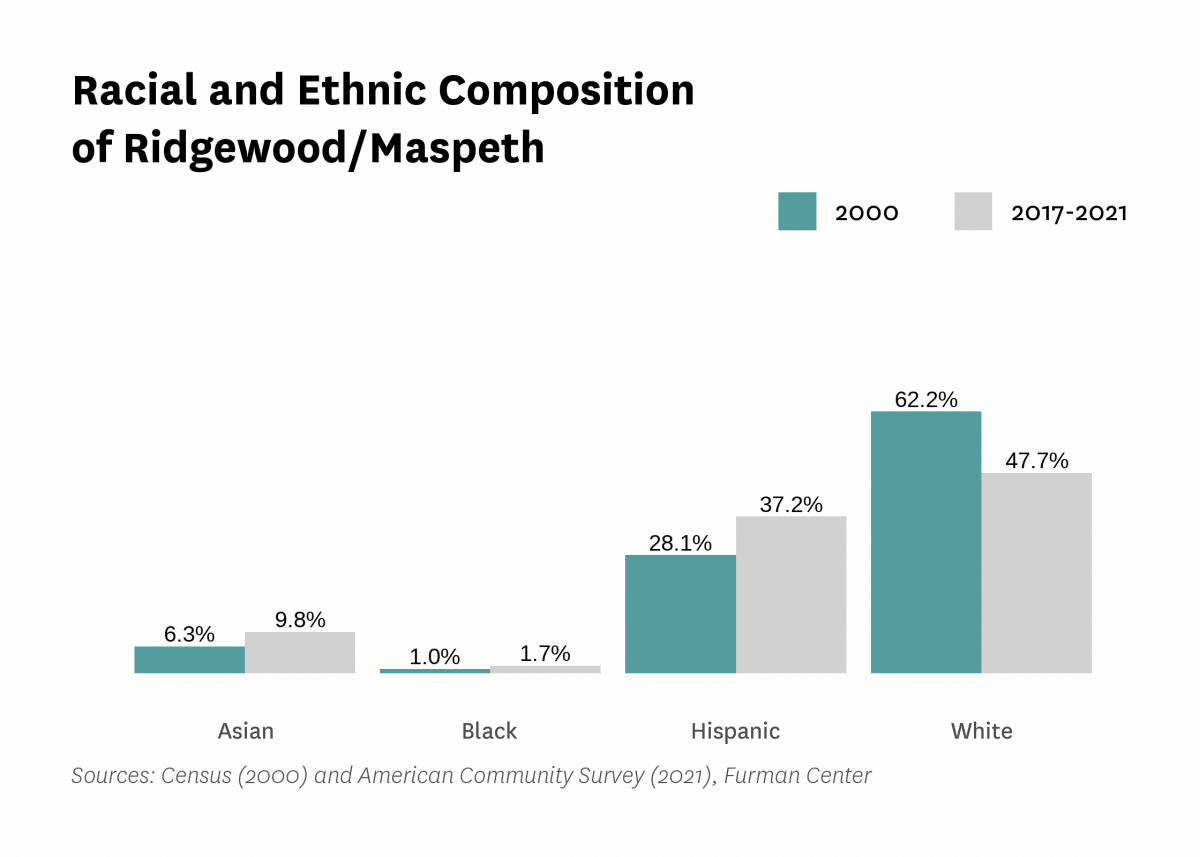
| Percent Asian | 6.3% | 6.4% | 8.9% | 8.8% | 9.8% | |
| Percent Black | 1.0% | 1.0% | 1.1% | 2.2% | 1.7% | |
| Percent Hispanic | 28.1% | 32.5% | 37.1% | 35.6% | 37.2% | |
| Percent white | 62.2% | 59.0% | 51.7% | 52.0% | 47.7% | |
| Racial diversity index | 0.53 | 0.54 | 0.59 | 0.59 | 0.62 | |
| Income and Poverty | ||||||
| Income diversity ratio | 4.3 | 4.0 | 4.4 | 3.8 | ||
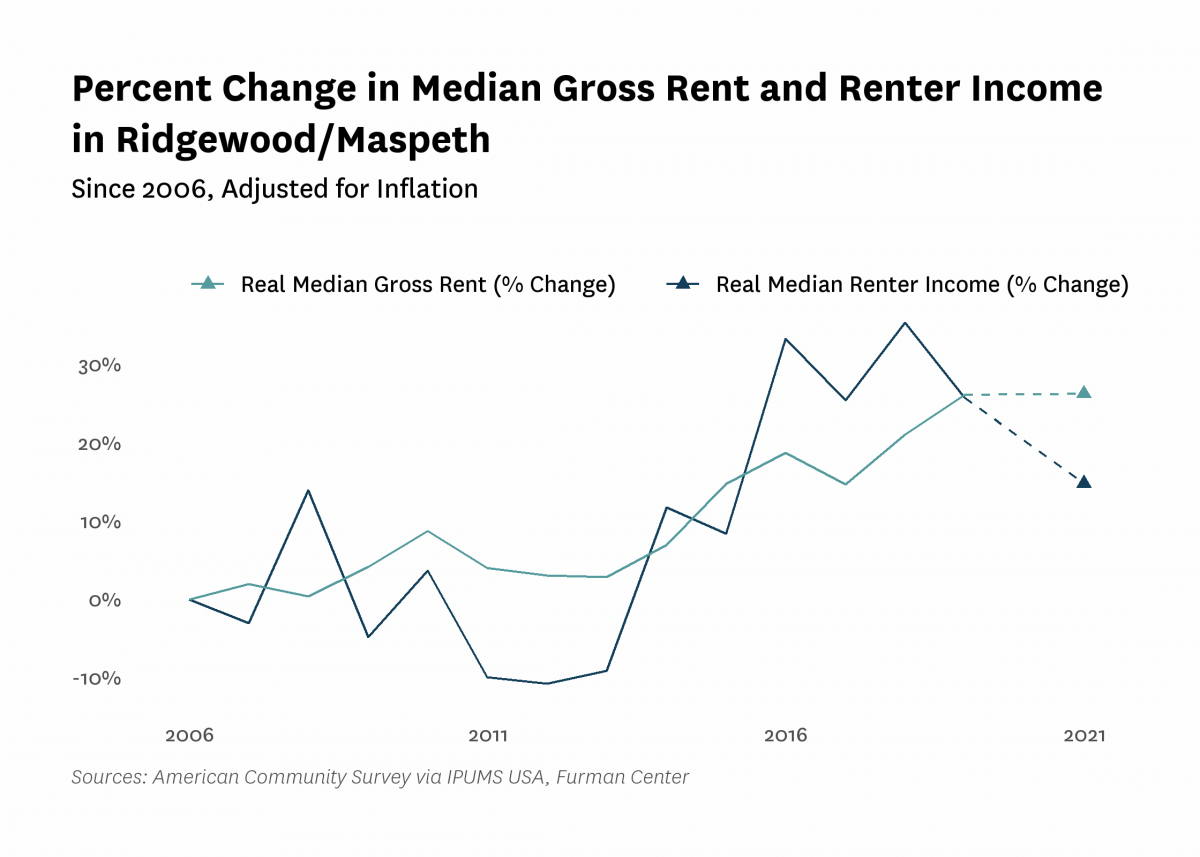
| Median household income (2022$) | $71,840 | $70,930 | $68,580 | $81,150 | $73,980 | |
| Median household income, homeowners (2022$) | $92,770 | $84,420 | $101,710 | $90,690 | ||
| Median household income, renters (2022$) | $58,020 | $60,170 | $72,980 | $66,610 | ||
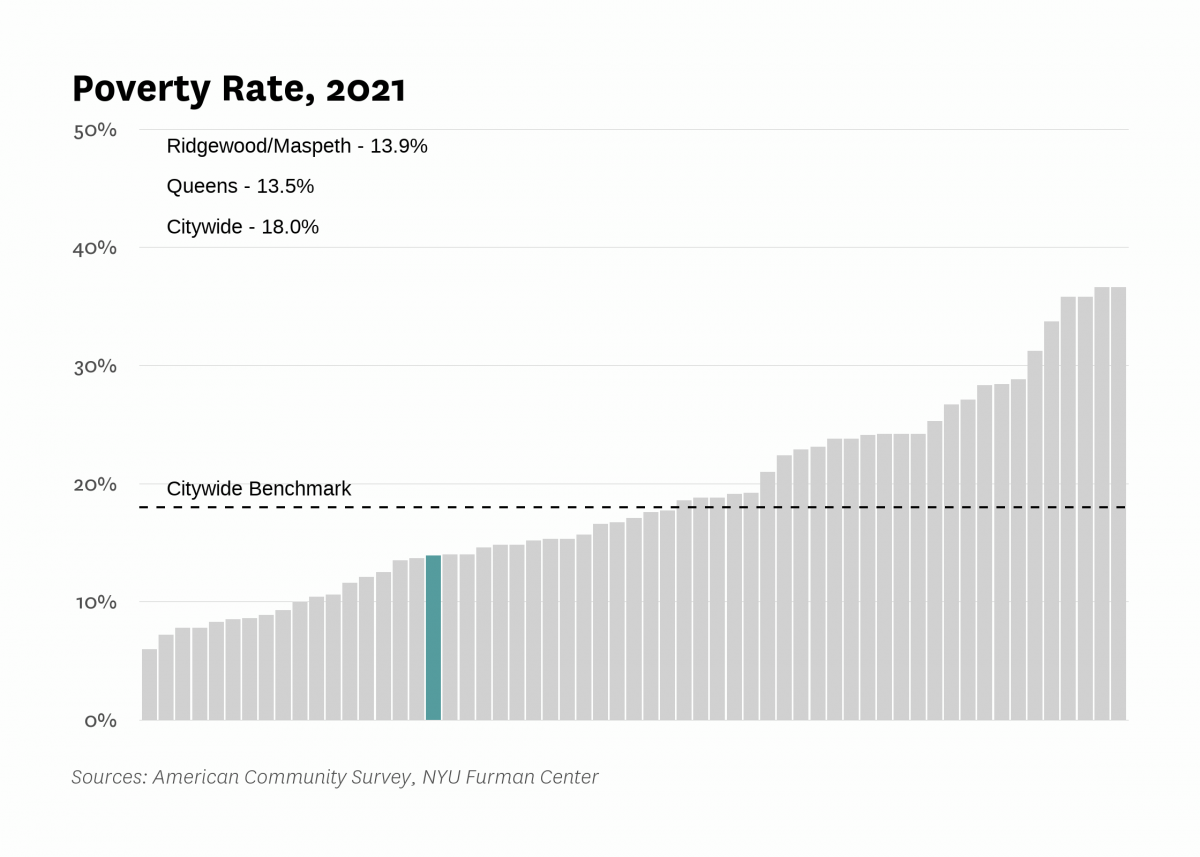
| Poverty rate | 13.8% | 10.6% | 17.1% | 8.4% | 13.9% | |
| Poverty rate, population aged 65+ | 9.4% | 12.9% | 12.7% | 14.5% | ||
| Poverty rate, population under 18 years old | 13.3% | 26.5% | 9.8% | 21.9% | ||
| Labor Market | ||||||
| Labor force participation rate | 61.3% | 60.2% | 65.5% | 63.3% | ||
| Population aged 25+ without a high school diploma | 20.6% | 22.1% | 13.7% | 16.9% | ||
| Unemployment rate | 7.26% | 6.54% | 7.95% | 3.14% | 11.41% | |
| Indicator | 2000 | 2006 | 2010 | 2019 | 2021 | 2022 |
|---|---|---|---|---|---|---|
| Housing Stock | ||||||
| Homeownership rate | 40.5% | 45.1% | 40.4% | 40.7% | 39.8% | |
| Housing units | 67,306 | 67,649 | 64,322 | 68,588 | ||
| Rental vacancy rate | 3.7% | 3.5% | 3.7% | |||
| Serious housing code violations (per 1,000 privately owned rental units) | 22.7 | 17.3 | 42.1 | 54.3 | 48.2 | |
| Severe crowding rate (% of renter households) | 2.1% | 2.5% | 2.3% | |||
| Total housing code violations (per 1,000 privately owned rental units) | 127.7 | 93.1 | 146.6 | 260.0 | 237.1 | |
| Finance - Distress | ||||||
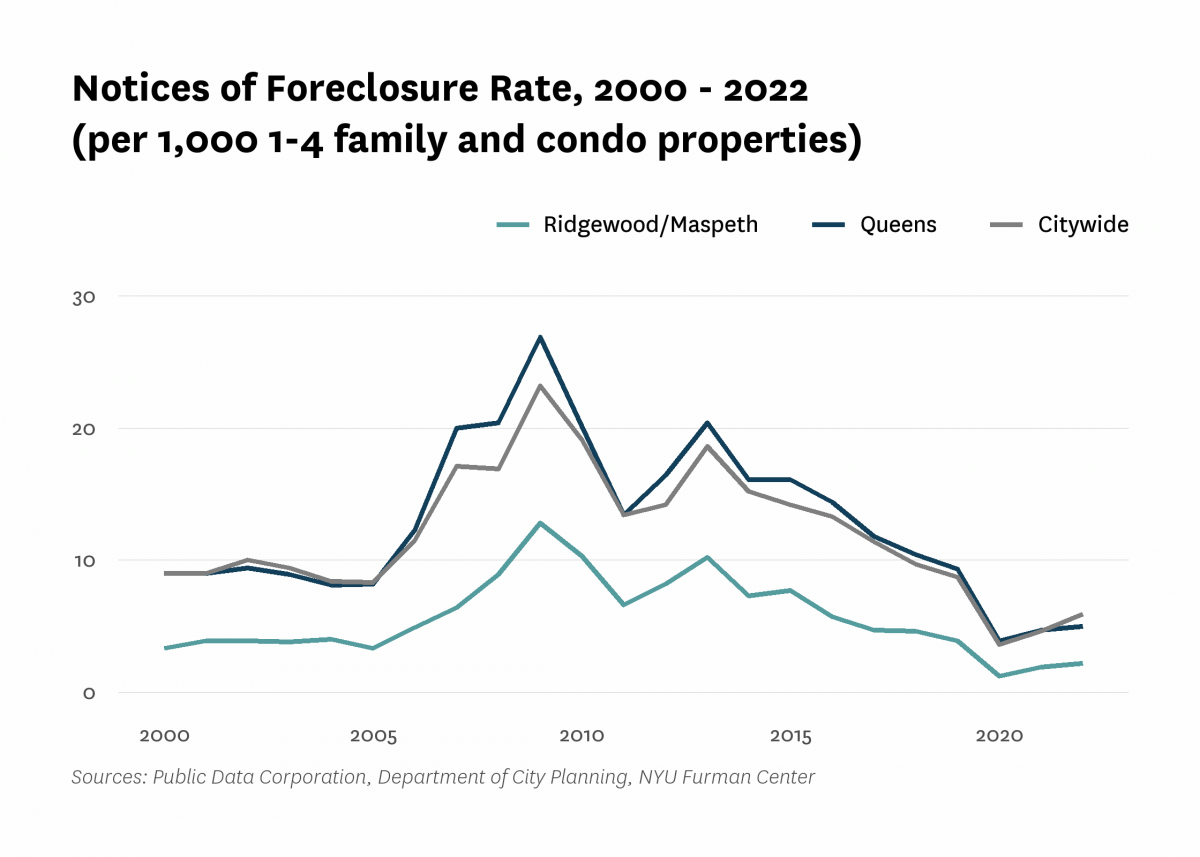
| Notices of foreclosure rate (per 1,000 1-4 family and condo properties) | 3.3 | 4.9 | 10.3 | 3.9 | 1.9 | 2.2 |
| Notices of foreclosure, all residential properties | 92 | 141 | 299 | 109 | 62 | 68 |
| Notices of foreclosure, initial, 1-4 family and condo properties | 67 | 92 | 225 | 54 | 22 | 29 |
| Notices of foreclosure, repeat, 1-4 family and condo properties | 17 | 37 | 49 | 51 | 29 | 29 |
| Pre-foreclosure notice rate (per 1,000 1-4 family and condo properties) | 28.8 | 14.5 | 25.1 | |||
| Pre-foreclosure notices, 1-4 family and condo properties | 766 | 387 | 670 | |||
| Properties entering REO, 1-4 family | 14 | 4 | 13 | |||
| Finance - Lending | ||||||
| FHA/VA-backed home purchase loans (% of home purchase loans) | 0.4% | 25.9% | 8.0% | 10.0% | ||
| Higher-cost home purchase loans (% of home purchase loans) | 21.8% | 0.5% | 6.9% | 5.6% | ||
| Higher-cost refinance loans (% of refinance loans) | 24.4% | 1.9% | 2.6% | 0.8% | ||
| Home purchase loan rate (per 1,000 properties) | 36.4 | 20.7 | 18.5 | 28.6 | ||
| Home purchase loans in LMI tracts (% of home purchase loans) | 15.6% | 8.0% | 4.5% | 4.6% | ||
| Home purchase loans to LMI borrowers (% of home purchase loans) | 1.5% | 14.3% | 4.7% | 6.4% | ||
| Refinance loan rate (per 1,000 properties) | 41.0 | 19.2 | 19.5 | 48.1 | ||
| Sales - Volume | ||||||
| Sales volume, 1 family building | 352 | 382 | 207 | 229 | 311 | 308 |
| Sales volume, 2-4 family building | 638 | 690 | 342 | 338 | 390 | 551 |
| Sales volume, 5+ family building | 74 | 62 | 32 | 27 | 45 | 58 |
| Sales volume, condominium | 15 | 68 | 38 | 23 | 49 | 48 |
| Sales volume, all property types | 1,079 | 1,202 | 619 | 617 | 795 | 965 |
| Sales - Median Prices | ||||||
| Median sales price per unit, 1 family building (2022$) | $405,310 | $708,600 | $630,930 | $812,800 | $816,990 | $814,000 |
| Median sales price per unit, 2-4 family building (2022$) | $208,180 | $396,990 | $304,840 | $469,950 | $465,970 | $460,000 |
| Median sales price per unit, 5+ family building (2022$) | $70,100 | $158,680 | $140,030 | $271,770 | $224,580 | $211,460 |
| Median sales price per unit, condominium (2022$) | $237,920 | $520,810 | $439,920 | $545,210 | $525,210 | $499,600 |
| Sales - Housing Price Index | ||||||
| Index of housing price appreciation, 1 family building | 100.0 | 198.9 | 190.9 | 316.0 | 322.7 | 332.6 |
| Index of housing price appreciation, 2-4 family building | 100.0 | 234.1 | 190.9 | 348.0 | 372.4 | 373.7 |
| Index of housing price appreciation, 5+ family building | 100.0 | 235.3 | 221.0 | 524.2 | 555.6 | 522.7 |
| Index of housing price appreciation, condominium | 100.0 | 243.8 | 186.3 | 319.7 | 344.7 | 343.1 |
| Index of housing price appreciation, all property types | 100.0 | 223.5 | 194.2 | 344.2 | 357.1 | 369.9 |
| Subsidized Housing | ||||||
| Total number of subsidized properties (properties) | 11 | |||||
| HUD Financing or Insurance (properties) | 1 | |||||
| HUD Financing or Insurance (units) | 0 | |||||
| HUD Project-based Rental Assistance Program (properties) | 0 | |||||
| HUD Project-based Rental Assistance Program (units) | 0 | |||||
| Low Income Housing Tax Credit (properties) | 0 | |||||
| Low Income Housing Tax Credit (units) | 0 | |||||
| Public Housing (properties) | 0 | |||||
| Public Housing (units) | 0 | |||||
| Mitchell-Lama (properties) | 0 | |||||
| Mitchell-Lama (units) | 0 | |||||
| 421-a Tax Exemption (properties) | 41 | |||||
| 421-a Tax Exemption (units) | 826 | |||||
| 420-c Tax Exemption (properties) | 0 | |||||
| 420-c Tax Exemption (units) | 0 | |||||
| NYC Housing Production Programs and Zoning Incentives or Requirements (properties) | 9 | |||||
| Eligible to expire from housing programs between 2023 and 2028 (properties) | 0 | |||||
| Eligible to expire from housing programs between 2023 and 2028 (units) | 0 | |||||
| Eligible to expire from housing programs between 2029 and 2038 (properties) | 0 | |||||
| Eligible to expire from housing programs between 2029 and 2038 (units) | 0 | |||||
| Eligible to expire from housing programs in 2039 and later (properties) | 1 | |||||
| Eligible to expire from housing programs in 2039 and later (units) | 0 | |||||
| Indicator | 2000 | 2006 | 2010 | 2019 | 2021 | 2022 |
|---|---|---|---|---|---|---|
| Density | ||||||
| Population density (1,000 persons per square mile) | 24.5 | 24.7 | 22.6 | 22.9 | ||
| Development | ||||||
| Units authorized by new residential building permits | 101 | 2 | 28 | 100 | 207 | 12 |
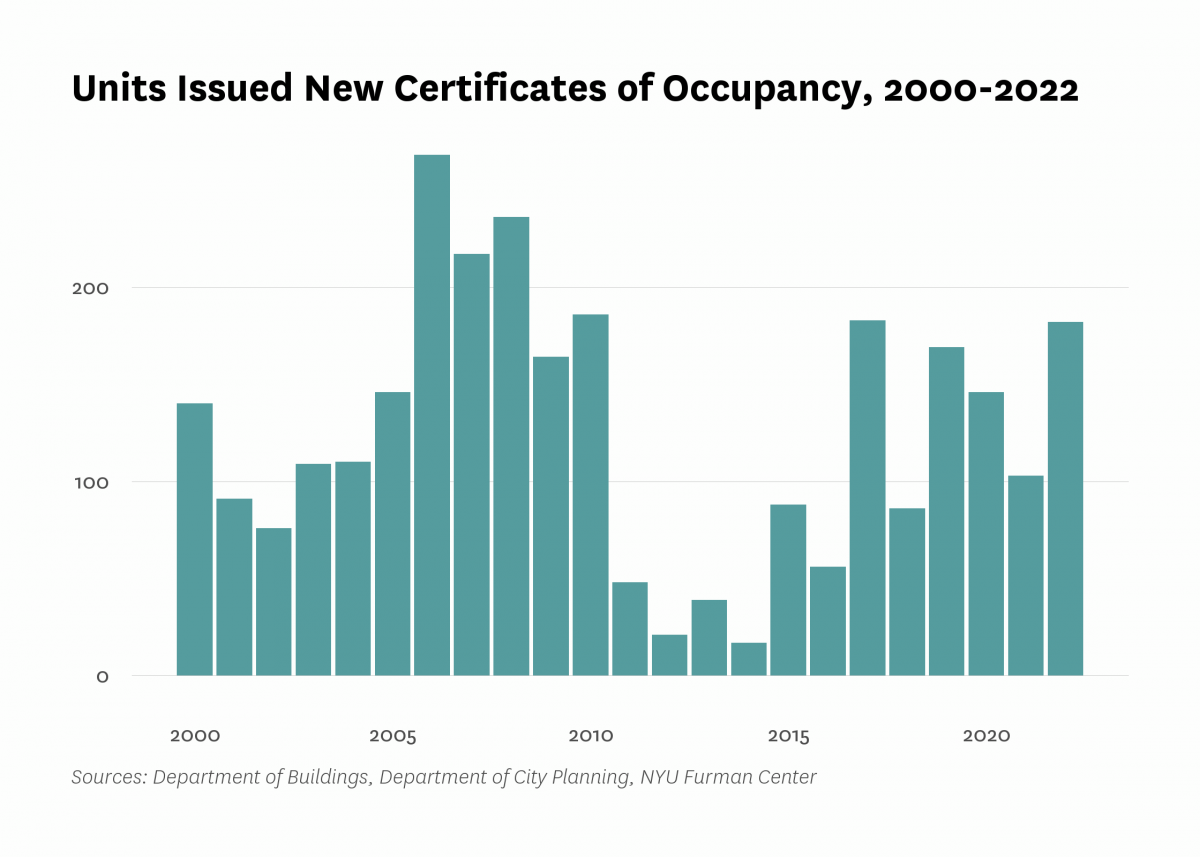
| Units issued new certificates of occupancy | 140 | 268 | 186 | 169 | 103 | 182 |
| Indicator | 2000 | 2006 | 2010 | 2019 | 2021 | 2022 |
|---|---|---|---|---|---|---|
| Commute | ||||||
| Car-free commute (% of commuters) | 51.0% | 60.3% | 58.5% | 58.2% | 51.6% | |
| Mean travel time to work (minutes) | 38.4 | 40.1 | 37.8 | 43.2 | 42.9 | |
| Crime and Incarceration | ||||||
| Serious crime rate (per 1,000 residents) | 10.8 | 10.1 | 7.7 | 8.1 | 9.8 | |
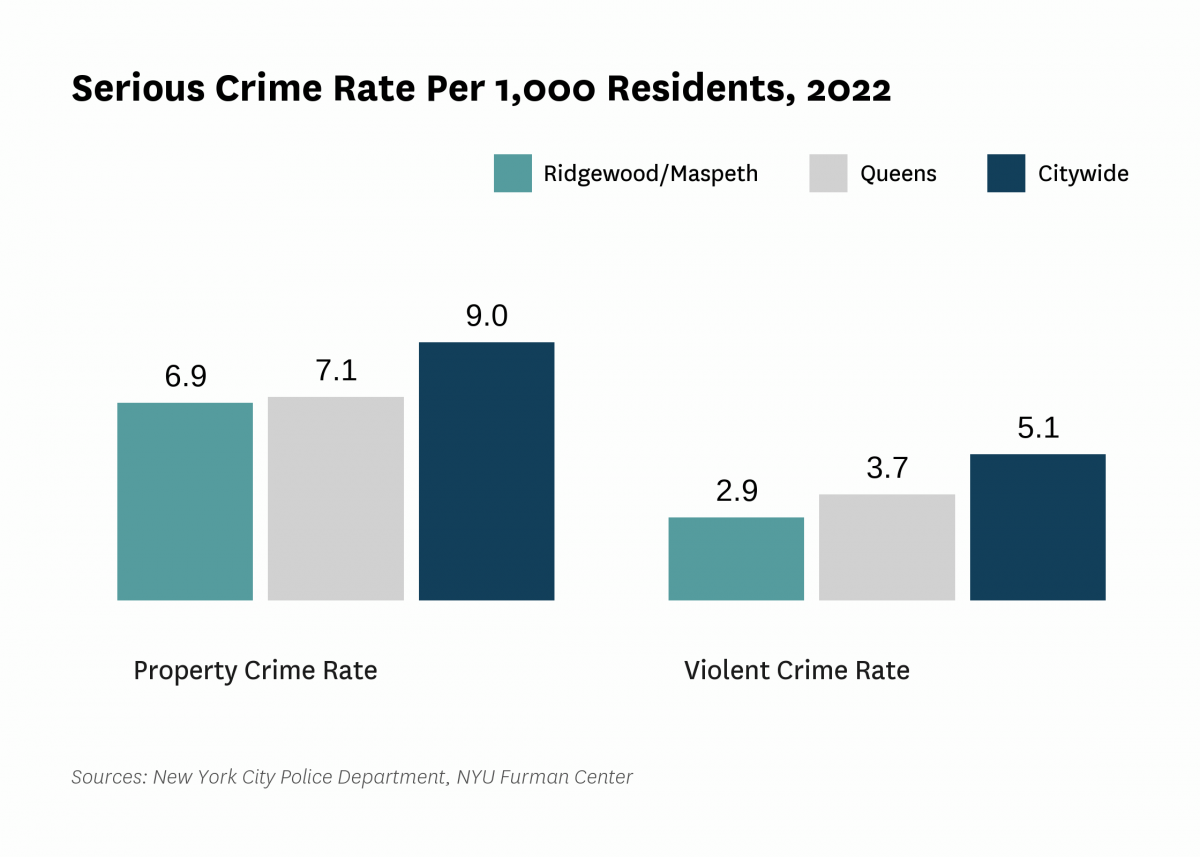
| Serious crime rate, property (per 1,000 residents) | 8.3 | 7.3 | 5.4 | 5.9 | 6.9 | |
| Serious crime rate, violent (per 1,000 residents) | 2.5 | 2.9 | 2.3 | 2.2 | 2.9 | |
| Schools | ||||||
| Students performing at grade level in English language arts, 4th grade | 55.0% | 50.3% | ||||
| Students performing at grade level in math, 4th grade | 58.2% | 48.8% | ||||
| Indicator | 2000 | 2006 | 2010 | 2019 | 2021 | 2022 |
|---|---|---|---|---|---|---|
| Median Rent | ||||||
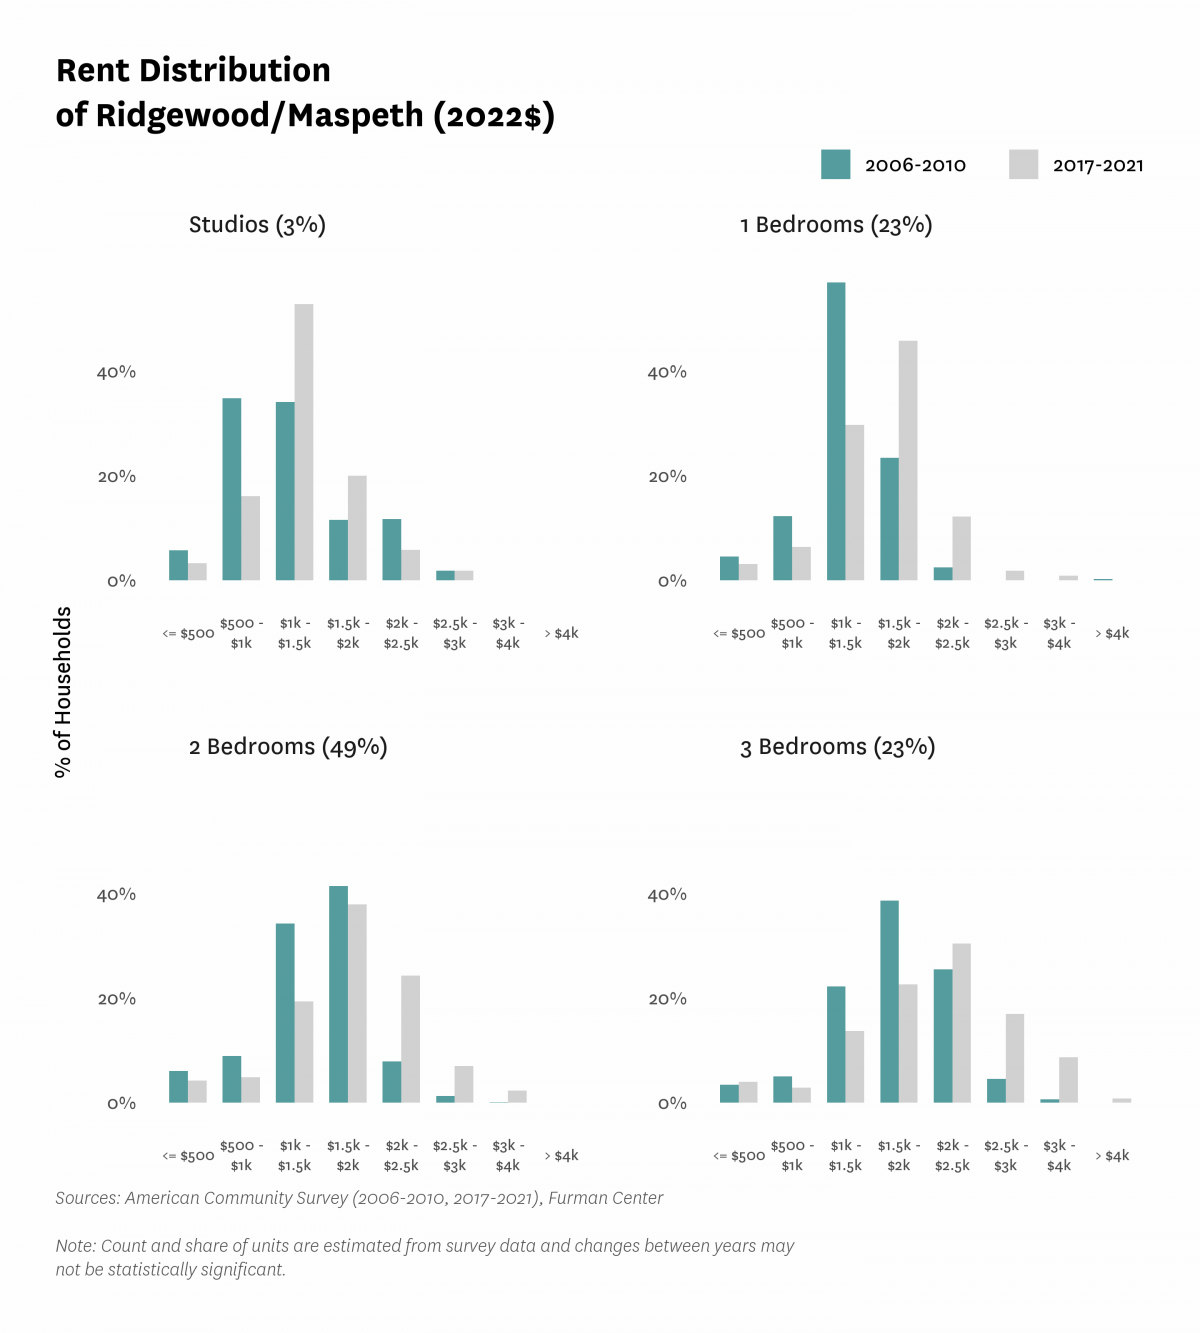
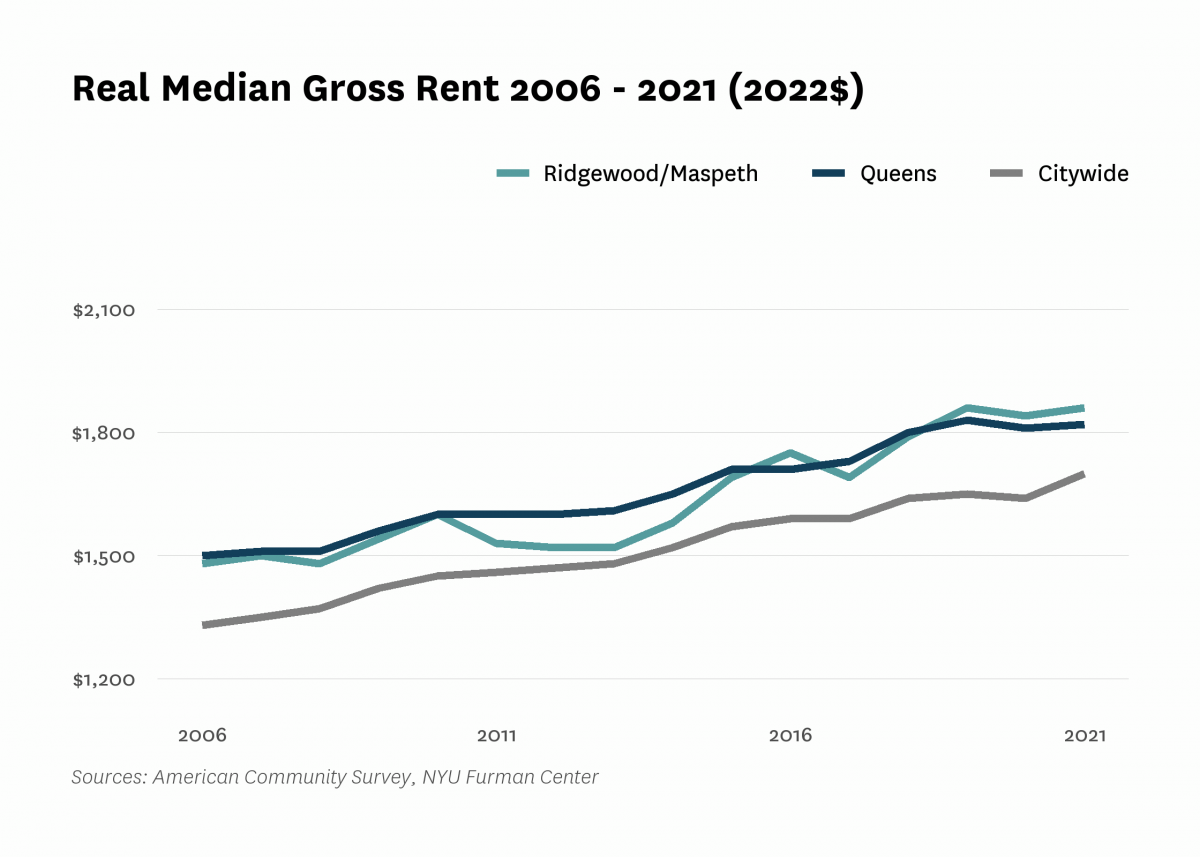
| Median rent, 2- and 3-bedrooms (2022$) | $1,580 | $1,760 | $1,920 | |||
| Median rent, all (2022$) | $1,250 | $1,480 | $1,600 | $1,860 | $1,860 | |
| Median rent, recent movers (2022$) | $1,640 | $1,960 | $2,200 | |||
| Median rent, studios and 1-bedrooms (2022$) | $1,310 | $1,470 | $1,560 | |||
| Change in collected rent (2019-2020) | -1.4% | |||||
| Affordability | ||||||
| Rental units affordable at 30% AMI (% of recently available units) | 1.4% | 2.1% | 2.6% | |||
| Rental units affordable at 80% AMI (% of recently available units) | 72.7% | 59.0% | 62.0% | |||
| Rental units affordable at 120% AMI (% of recently available units) | 99.7% | 93.7% | 95.7% | |||
| Rent Burden | ||||||
| Moderately rent-burdened households | 24.2% | 23.0% | 23.7% | 29.4% | ||
| Moderately rent-burdened households, low income | 38.7% | 33.4% | 35.5% | |||
| Moderately rent-burdened households, moderate income | 9.1% | 11.4% | 11.9% | |||
| Severely rent-burdened households | 22.0% | 27.3% | 23.8% | 23.7% | ||
| Severely rent-burdened households, low income | 44.0% | 43.5% | 41.8% | |||
| Severely rent-burdened households, moderate income | 0.4% | 0.4% | 0.1% | |||
| Rental Subsidy | ||||||
| Housing choice vouchers (% of occupied, privately owned rental units) | 2.6% | 1.4% | ||||
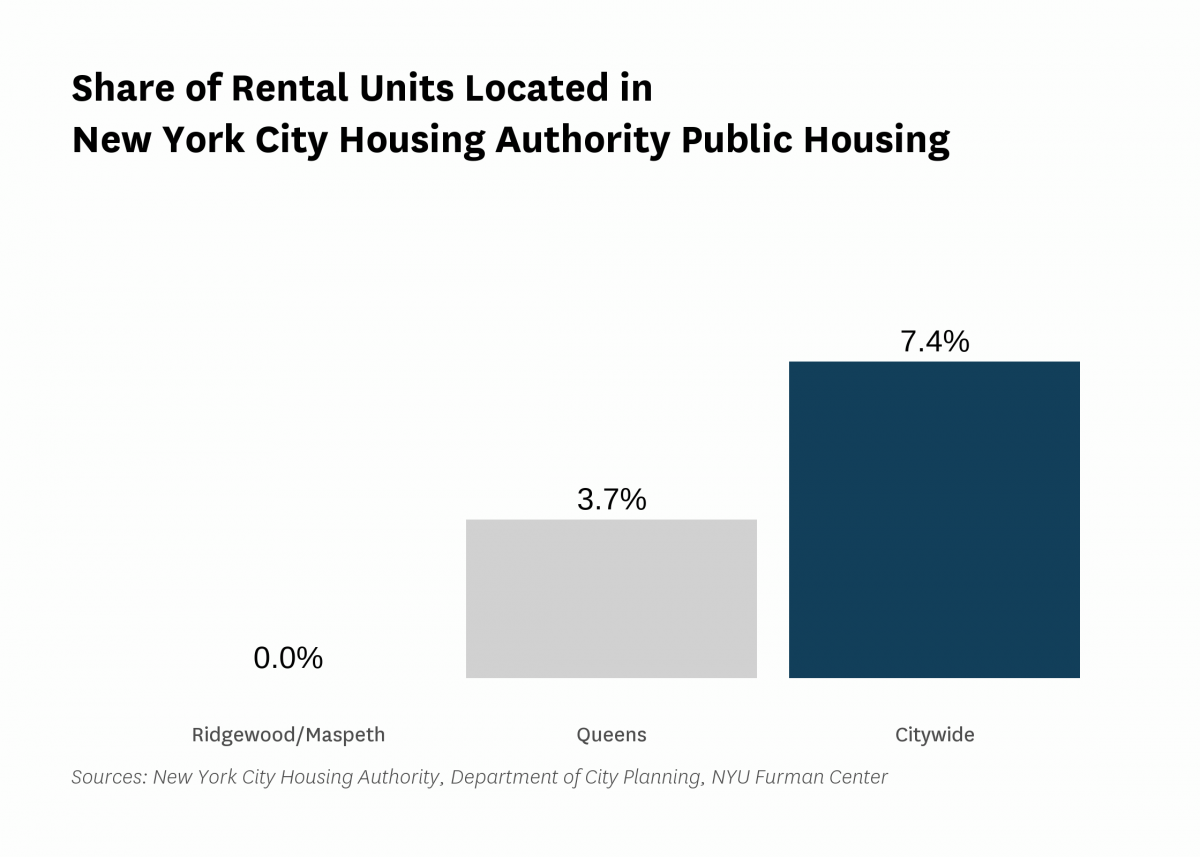
| Public housing (% of rental units) | 0.0% | |||||
Data Notes: See CoreData User Guide for more information about indicator definitions and methods.
Indicators: The rental vacancy rate, severe crowding rate, and the severely rent-burdened households indicators use five-year American Community Survey (ACS) estimates. Data under the 2010 heading comes from the 2006 – 2010 ACS, data under the 2019 heading comes from the 2015 – 2019 ACS and data under the 2021 heading comes from 2017 – 2021 ACS .
All content © 2005 – 2024 Furman Center for Real Estate and Urban Policy | Top of page | Contact Us