| Indicator | 2000 | 2006 | 2010 | 2019 | 2021 | 2022 |
|---|---|---|---|---|---|---|
| Population | ||||||
| Born in New York State | 39.4% | 41.4% | 41.0% | 44.9% | ||
| Disabled population | 5.3% | 7.9% | 7.7% | |||
| Foreign-born population | 52.1% | 53.3% | 49.6% | 49.7% | 45.6% | |
| Population | 113,422 | 116,418 | 114,462 | 105,586 | 126,028 | |
| Population aged 65+ | 18.8% | 17.0% | 16.5% | 19.0% | 22.4% | |
| Households | ||||||
| Households with children under 18 years old | 21.9% | 24.3% | 24.6% | 22.9% | 20.6% | |
| Single-person households | 37.9% | 36.9% | 37.7% | 32.5% | ||
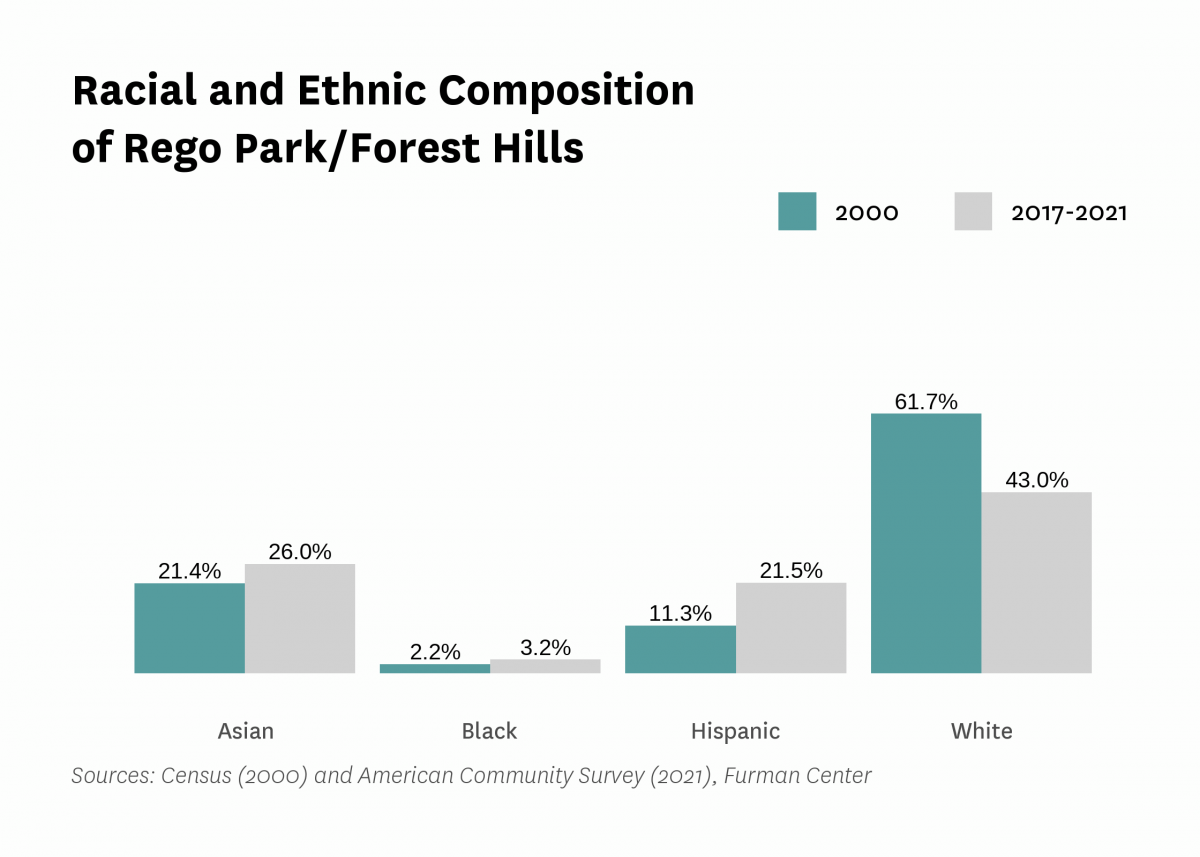
| Race and Ethnicity | ||||||
| Percent Asian | 21.4% | 23.1% | 26.8% | 30.0% | 26.0% | |
| Percent Black | 2.2% | 2.6% | 1.2% | 2.0% | 3.2% | |
| Percent Hispanic | 11.3% | 13.0% | 14.0% | 14.3% | 21.5% | |
| Percent white | 61.7% | 59.1% | 56.3% | 50.7% | 43.0% | |
| Racial diversity index | 0.56 | 0.58 | 0.59 | 0.63 | 0.70 | |
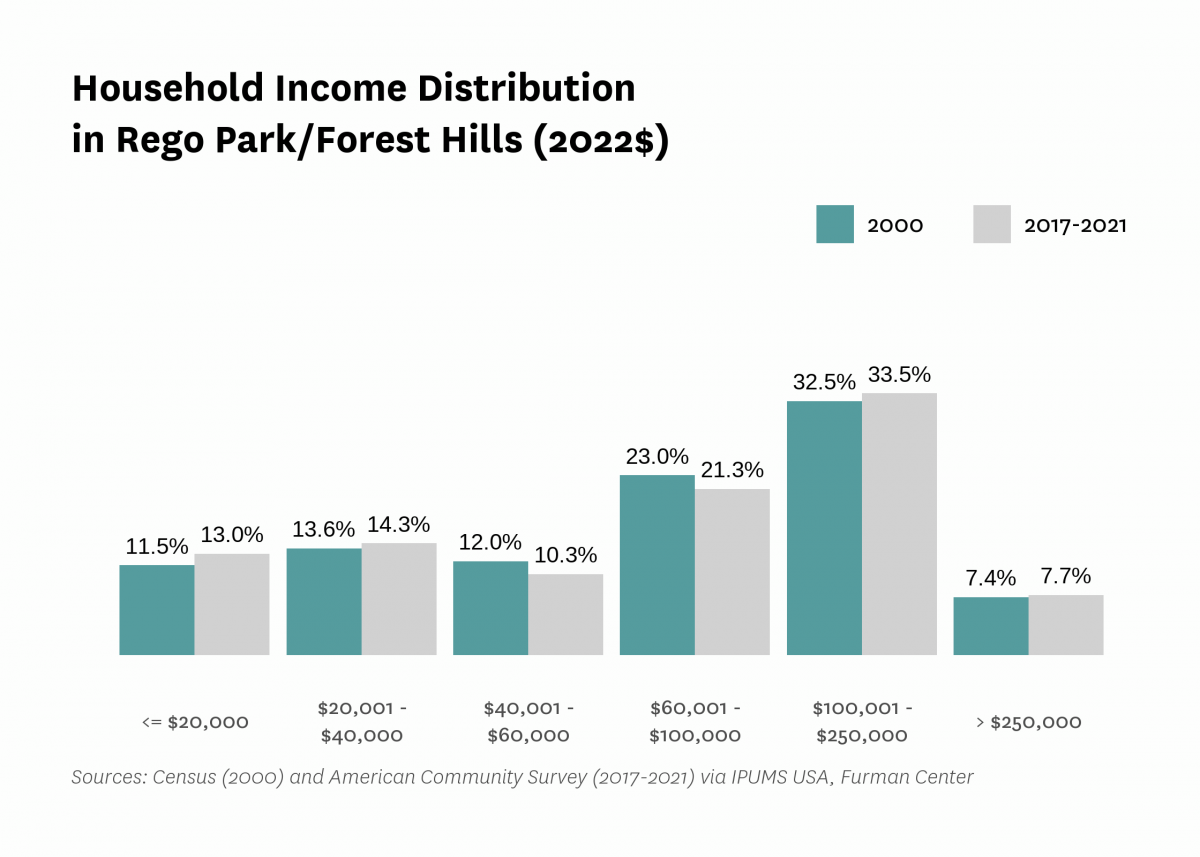
| Income and Poverty | ||||||
| Income diversity ratio | 5.5 | 4.8 | 5.6 | 4.3 | ||
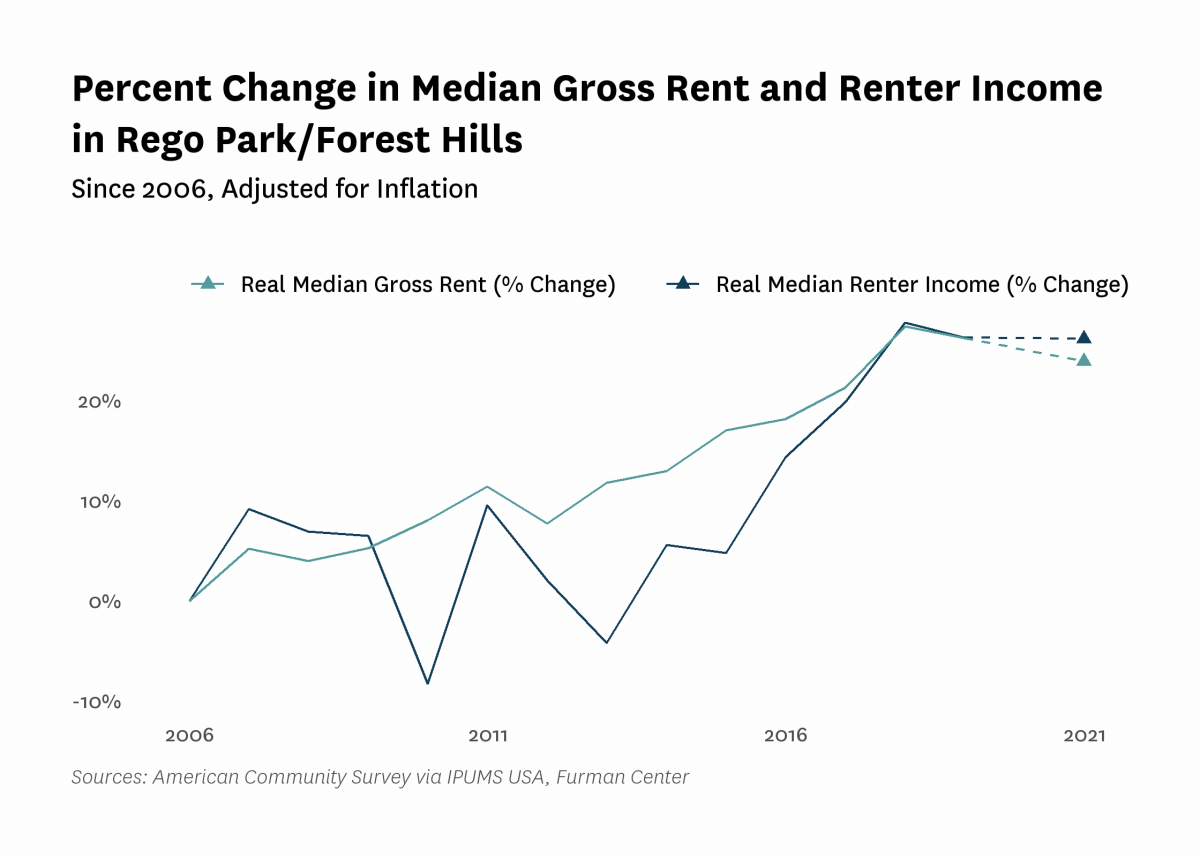
| Median household income (2022$) | $84,110 | $84,440 | $71,000 | $99,410 | $94,340 | |
| Median household income, homeowners (2022$) | $105,220 | $103,150 | $116,950 | $110,380 | ||
| Median household income, renters (2022$) | $63,760 | $58,510 | $80,520 | $80,460 | ||
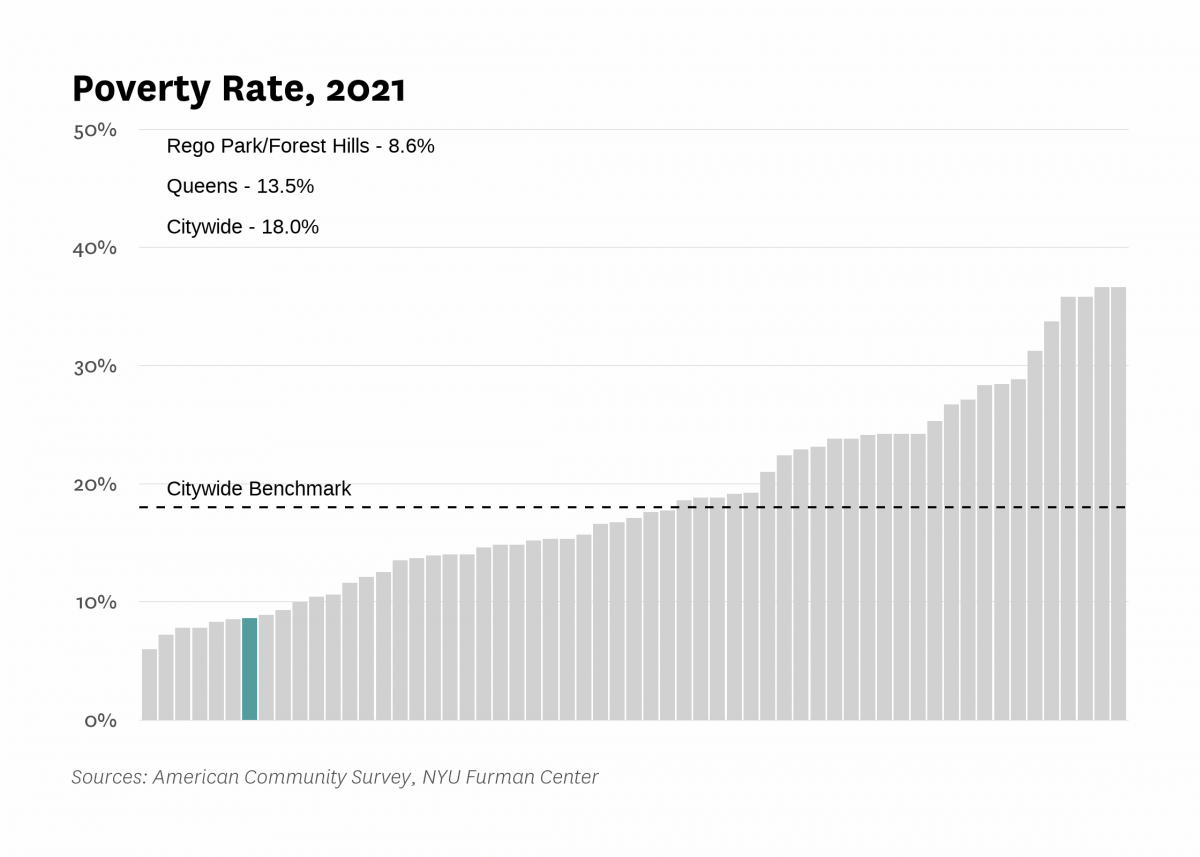
| Poverty rate | 11.2% | 9.5% | 9.7% | 11.1% | 8.6% | |
| Poverty rate, population aged 65+ | 12.1% | 13.6% | 20.3% | 11.2% | ||
| Poverty rate, population under 18 years old | 12.8% | 12.3% | 9.3% | 3.7% | ||
| Labor Market | ||||||
| Labor force participation rate | 63.6% | 62.4% | 65.5% | 60.9% | ||
| Population aged 25+ without a high school diploma | 9.3% | 8.6% | 5.6% | 9.2% | ||
| Unemployment rate | 5.22% | 6.20% | 8.86% | 3.81% | 8.88% | |
| Indicator | 2000 | 2006 | 2010 | 2019 | 2021 | 2022 |
|---|---|---|---|---|---|---|
| Housing Stock | ||||||
| Homeownership rate | 38.3% | 42.8% | 42.0% | 51.0% | 47.9% | |
| Housing units | 54,459 | 54,436 | 53,881 | 58,689 | ||
| Rental vacancy rate | 1.9% | 2.7% | 2.0% | |||
| Serious housing code violations (per 1,000 privately owned rental units) | 9.9 | 9.3 | 24.6 | 31.7 | 41.5 | |
| Severe crowding rate (% of renter households) | 2.3% | 5.5% | 5.6% | |||
| Total housing code violations (per 1,000 privately owned rental units) | 79.8 | 79.4 | 115.3 | 153.0 | 146.8 | |
| Finance - Distress | ||||||
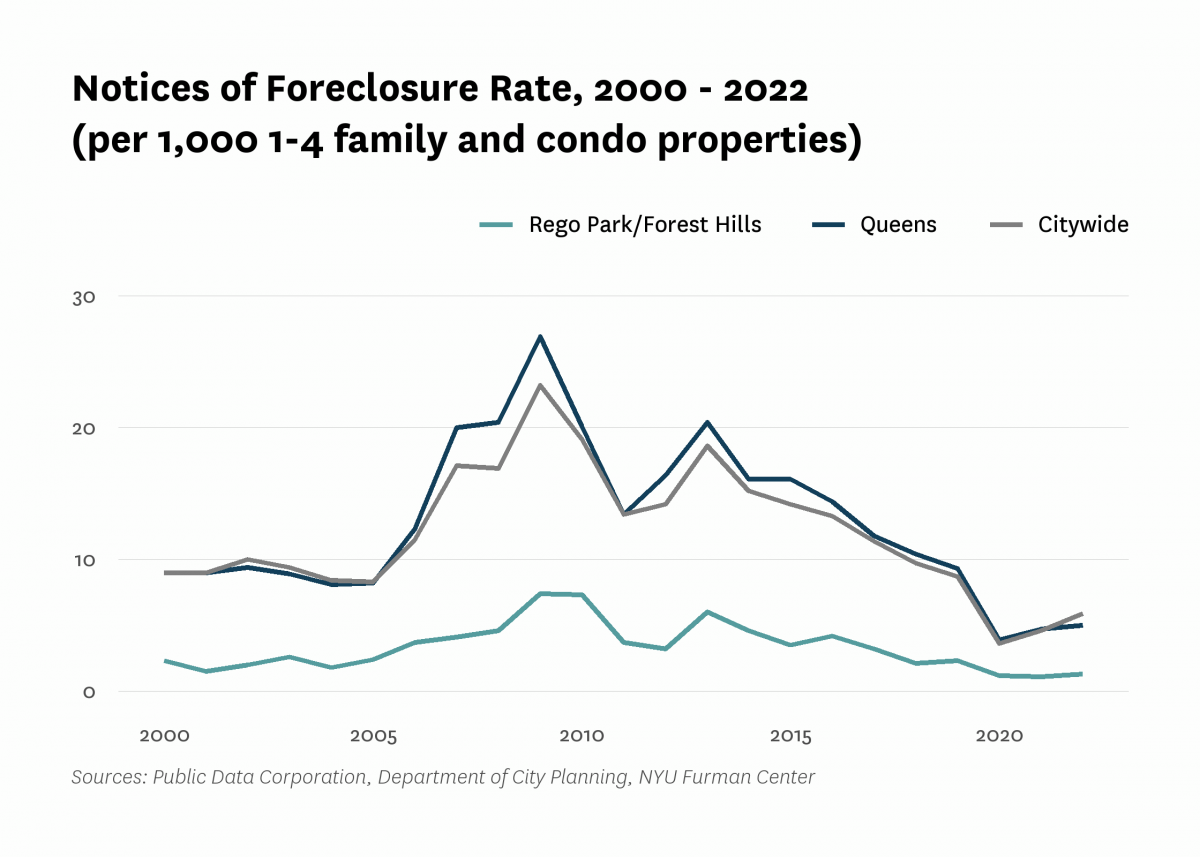
| Notices of foreclosure rate (per 1,000 1-4 family and condo properties) | 2.3 | 3.7 | 7.3 | 2.3 | 1.1 | 1.3 |
| Notices of foreclosure, all residential properties | 28 | 45 | 86 | 29 | 15 | 17 |
| Notices of foreclosure, initial, 1-4 family and condo properties | 17 | 30 | 76 | 13 | 8 | 7 |
| Notices of foreclosure, repeat, 1-4 family and condo properties | 8 | 11 | 8 | 15 | 5 | 9 |
| Pre-foreclosure notice rate (per 1,000 1-4 family and condo properties) | 14.8 | 7.8 | 16.4 | |||
| Pre-foreclosure notices, 1-4 family and condo properties | 179 | 95 | 200 | |||
| Properties entering REO, 1-4 family | 1 | 0 | 1 | |||
| Finance - Lending | ||||||
| FHA/VA-backed home purchase loans (% of home purchase loans) | 0.1% | 1.1% | 0.2% | 0.3% | ||
| Higher-cost home purchase loans (% of home purchase loans) | 4.5% | 0.4% | 1.6% | 1.3% | ||
| Higher-cost refinance loans (% of refinance loans) | 13.0% | 0.4% | 3.3% | 0.2% | ||
| Home purchase loan rate (per 1,000 properties) | 44.0 | 25.4 | 22.9 | 27.5 | ||
| Home purchase loans in LMI tracts (% of home purchase loans) | 4.1% | 13.0% | 7.0% | 5.6% | ||
| Home purchase loans to LMI borrowers (% of home purchase loans) | 9.9% | 3.5% | 11.0% | 11.6% | ||
| Refinance loan rate (per 1,000 properties) | 14.2 | 21.2 | 9.2 | 26.5 | ||
| Sales - Volume | ||||||
| Sales volume, 1 family building | 257 | 244 | 150 | 128 | 157 | 188 |
| Sales volume, 2-4 family building | 104 | 84 | 41 | 37 | 37 | 65 |
| Sales volume, 5+ family building | 4 | 7 | 3 | 3 | 1 | 8 |
| Sales volume, condominium | 75 | 180 | 99 | 128 | 88 | 92 |
| Sales volume, all property types | 440 | 515 | 293 | 296 | 283 | 353 |
| Sales - Median Prices | ||||||
| Median sales price per unit, 1 family building (2022$) | $577,800 | $933,090 | $847,900 | $1,059,210 | $1,058,900 | $1,066,500 |
| Median sales price per unit, 2-4 family building (2022$) | $269,360 | $456,710 | $429,160 | $599,290 | $466,850 | $496,670 |
| Median sales price per unit, 5+ family building (2022$) | $141,020 | $285,080 | $148,570 | $362,360 | $346,870 | $266,140 |
| Median sales price per unit, condominium (2022$) | $237,920 | $530,490 | $432,640 | $772,370 | $583,560 | $532,550 |
| Sales - Housing Price Index | ||||||
| Index of housing price appreciation, 1 family building | 100.0 | 199.9 | 195.0 | 293.8 | 313.8 | 314.7 |
| Index of housing price appreciation, 2-4 family building | 100.0 | 212.0 | 179.8 | 318.6 | 322.0 | 299.9 |
| Index of housing price appreciation, 5+ family building | 100.0 | 409.9 | 278.2 | 1,304.4 | 1,378.0 | |
| Index of housing price appreciation, condominium | 100.0 | 219.5 | 190.0 | 305.6 | 311.9 | 313.9 |
| Index of housing price appreciation, all property types | 100.0 | 207.5 | 190.8 | 302.7 | 312.4 | 314.7 |
| Subsidized Housing | ||||||
| Total number of subsidized properties (properties) | 5 | |||||
| HUD Financing or Insurance (properties) | 1 | |||||
| HUD Financing or Insurance (units) | 0 | |||||
| HUD Project-based Rental Assistance Program (properties) | 0 | |||||
| HUD Project-based Rental Assistance Program (units) | 0 | |||||
| Low Income Housing Tax Credit (properties) | 0 | |||||
| Low Income Housing Tax Credit (units) | 0 | |||||
| Public Housing (properties) | 0 | |||||
| Public Housing (units) | 0 | |||||
| Mitchell-Lama (properties) | 0 | |||||
| Mitchell-Lama (units) | 0 | |||||
| 421-a Tax Exemption (properties) | 37 | |||||
| 421-a Tax Exemption (units) | 1,422 | |||||
| 420-c Tax Exemption (properties) | 0 | |||||
| 420-c Tax Exemption (units) | 0 | |||||
| NYC Housing Production Programs and Zoning Incentives or Requirements (properties) | 3 | |||||
| Eligible to expire from housing programs between 2023 and 2028 (properties) | 0 | |||||
| Eligible to expire from housing programs between 2023 and 2028 (units) | 0 | |||||
| Eligible to expire from housing programs between 2029 and 2038 (properties) | 0 | |||||
| Eligible to expire from housing programs between 2029 and 2038 (units) | 0 | |||||
| Eligible to expire from housing programs in 2039 and later (properties) | 1 | |||||
| Eligible to expire from housing programs in 2039 and later (units) | 0 | |||||
| Indicator | 2000 | 2006 | 2010 | 2019 | 2021 | 2022 |
|---|---|---|---|---|---|---|
| Density | ||||||
| Population density (1,000 persons per square mile) | 41.5 | 40.8 | 37.7 | 45.0 | ||
| Development | ||||||
| Units authorized by new residential building permits | 81 | 0 | 11 | 603 | 167 | 1,417 |
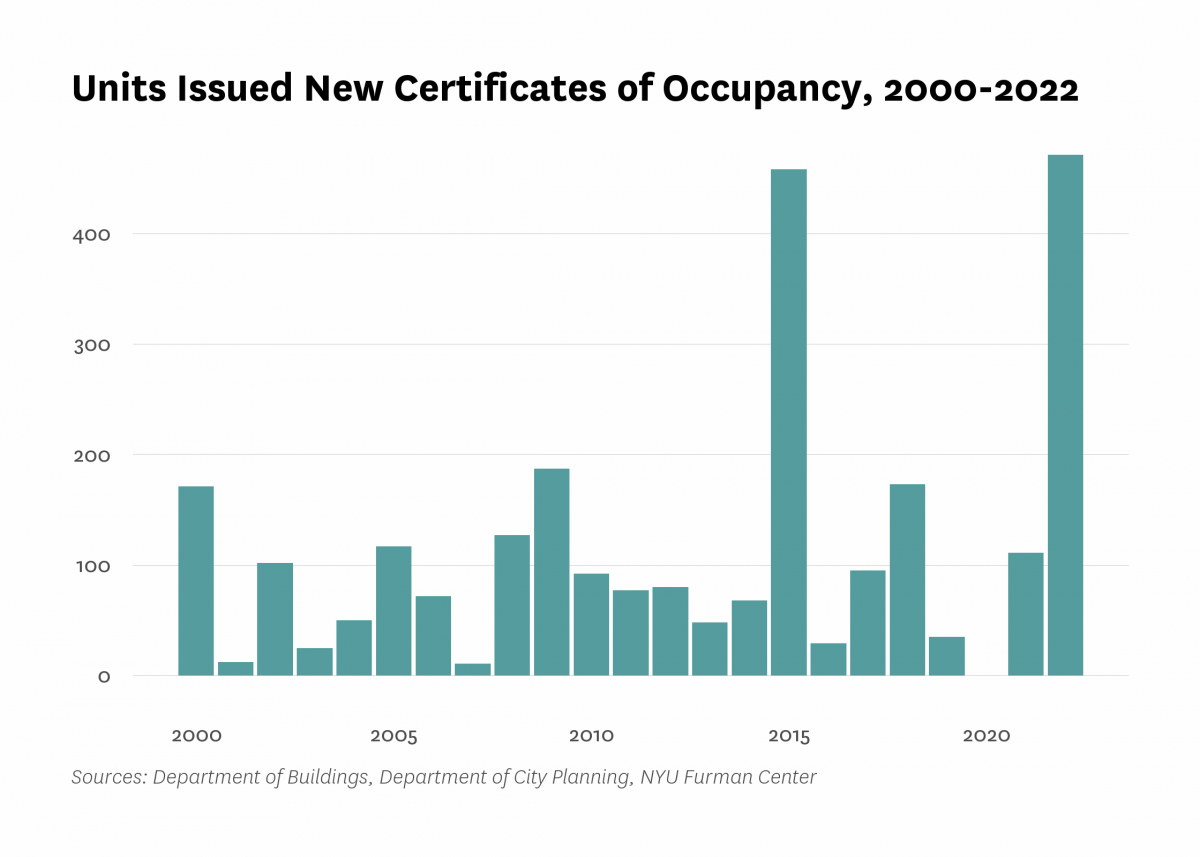
| Units issued new certificates of occupancy | 171 | 72 | 92 | 35 | 111 | 471 |
| Indicator | 2000 | 2006 | 2010 | 2019 | 2021 | 2022 |
|---|---|---|---|---|---|---|
| Commute | ||||||
| Car-free commute (% of commuters) | 65.7% | 70.0% | 71.5% | 67.7% | 59.0% | |
| Mean travel time to work (minutes) | 42.3 | 41.6 | 39.7 | 45.1 | 43.0 | |
| Crime and Incarceration | ||||||
| Serious crime rate (per 1,000 residents) | 11.6 | 7.1 | 4.6 | 5.7 | 6.8 | |
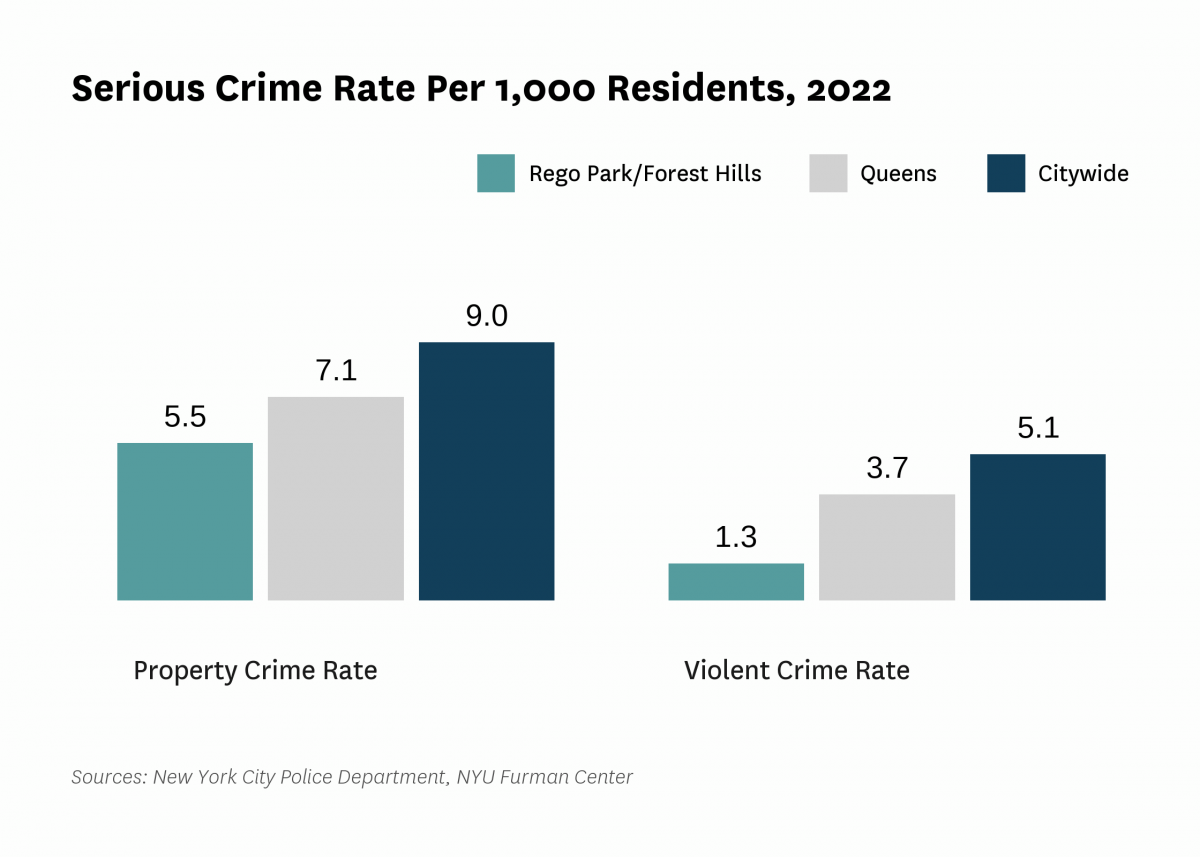
| Serious crime rate, property (per 1,000 residents) | 9.4 | 5.6 | 3.6 | 4.6 | 5.5 | |
| Serious crime rate, violent (per 1,000 residents) | 2.1 | 1.6 | 0.9 | 1.0 | 1.3 | |
| Schools | ||||||
| Students performing at grade level in English language arts, 4th grade | 63.9% | 66.7% | ||||
| Students performing at grade level in math, 4th grade | 70.4% | 67.9% | ||||
| Indicator | 2000 | 2006 | 2010 | 2019 | 2021 | 2022 |
|---|---|---|---|---|---|---|
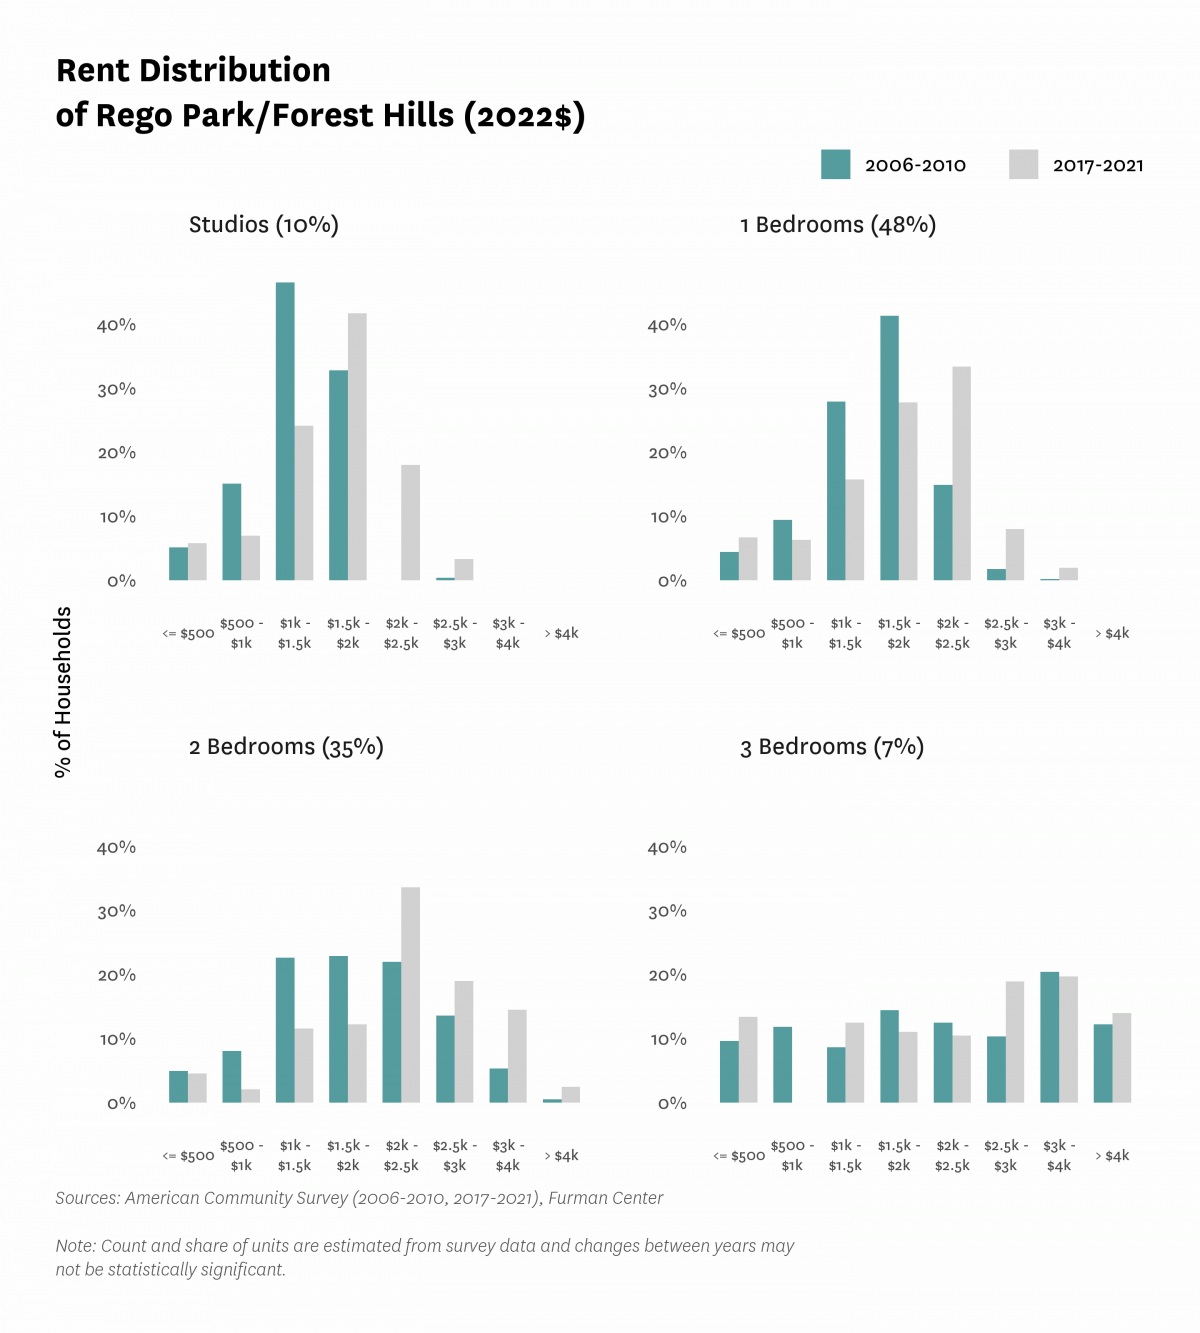
| Median Rent | ||||||
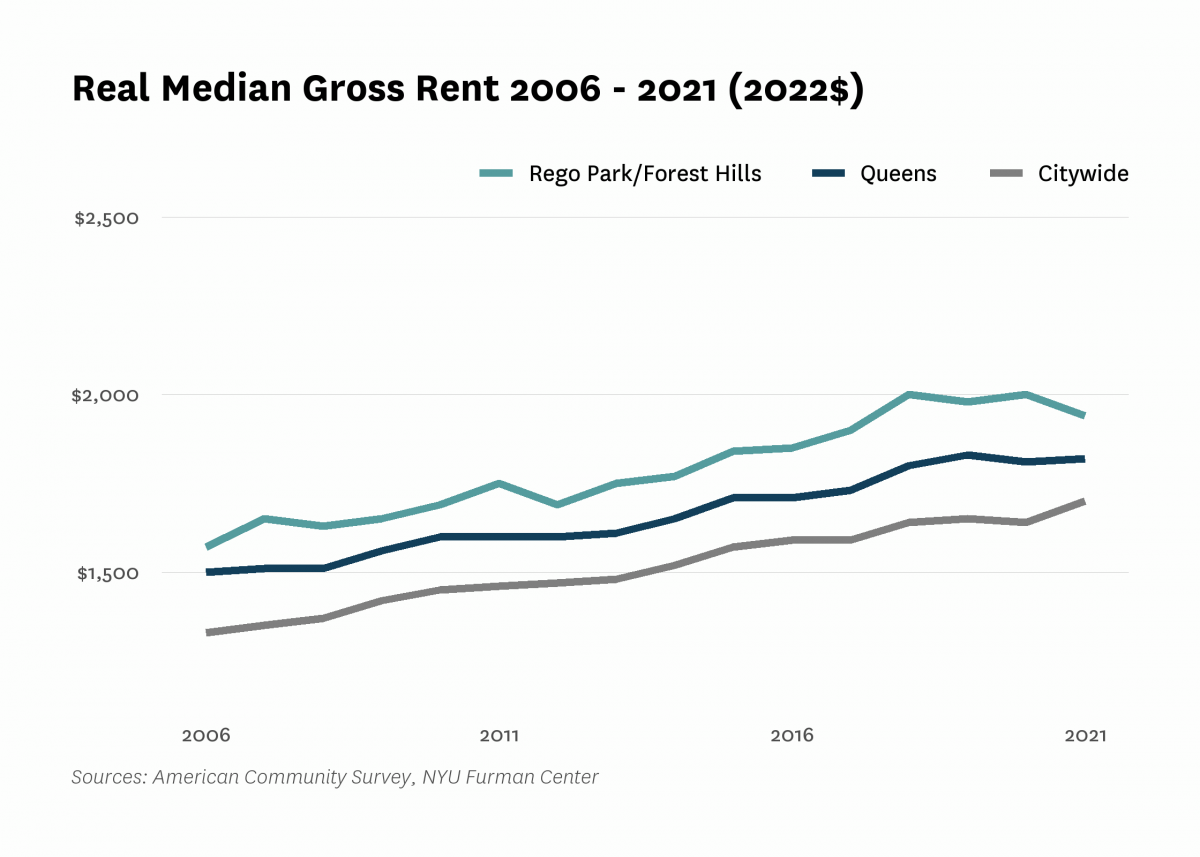
| Median rent, 2- and 3-bedrooms (2022$) | $1,900 | $2,150 | $2,300 | |||
| Median rent, all (2022$) | $1,440 | $1,570 | $1,690 | $1,980 | $1,940 | |
| Median rent, recent movers (2022$) | $1,990 | $2,100 | $2,320 | |||
| Median rent, studios and 1-bedrooms (2022$) | $1,550 | $1,750 | $1,880 | |||
| Change in collected rent (2019-2020) | -0.7% | |||||
| Affordability | ||||||
| Rental units affordable at 30% AMI (% of recently available units) | 1.2% | 3.6% | 0.9% | |||
| Rental units affordable at 80% AMI (% of recently available units) | 26.0% | 31.3% | 26.2% | |||
| Rental units affordable at 120% AMI (% of recently available units) | 85.2% | 93.4% | 95.6% | |||
| Rent Burden | ||||||
| Moderately rent-burdened households | 19.6% | 28.9% | 16.5% | 22.4% | ||
| Moderately rent-burdened households, low income | 29.5% | 28.3% | 31.6% | |||
| Moderately rent-burdened households, moderate income | 33.6% | 22.1% | 22.4% | |||
| Severely rent-burdened households | 22.0% | 28.6% | 28.9% | 26.5% | ||
| Severely rent-burdened households, low income | 56.5% | 57.8% | 51.5% | |||
| Severely rent-burdened households, moderate income | 2.0% | 1.5% | 0.8% | |||
| Rental Subsidy | ||||||
| Housing choice vouchers (% of occupied, privately owned rental units) | 1.7% | 1.6% | ||||
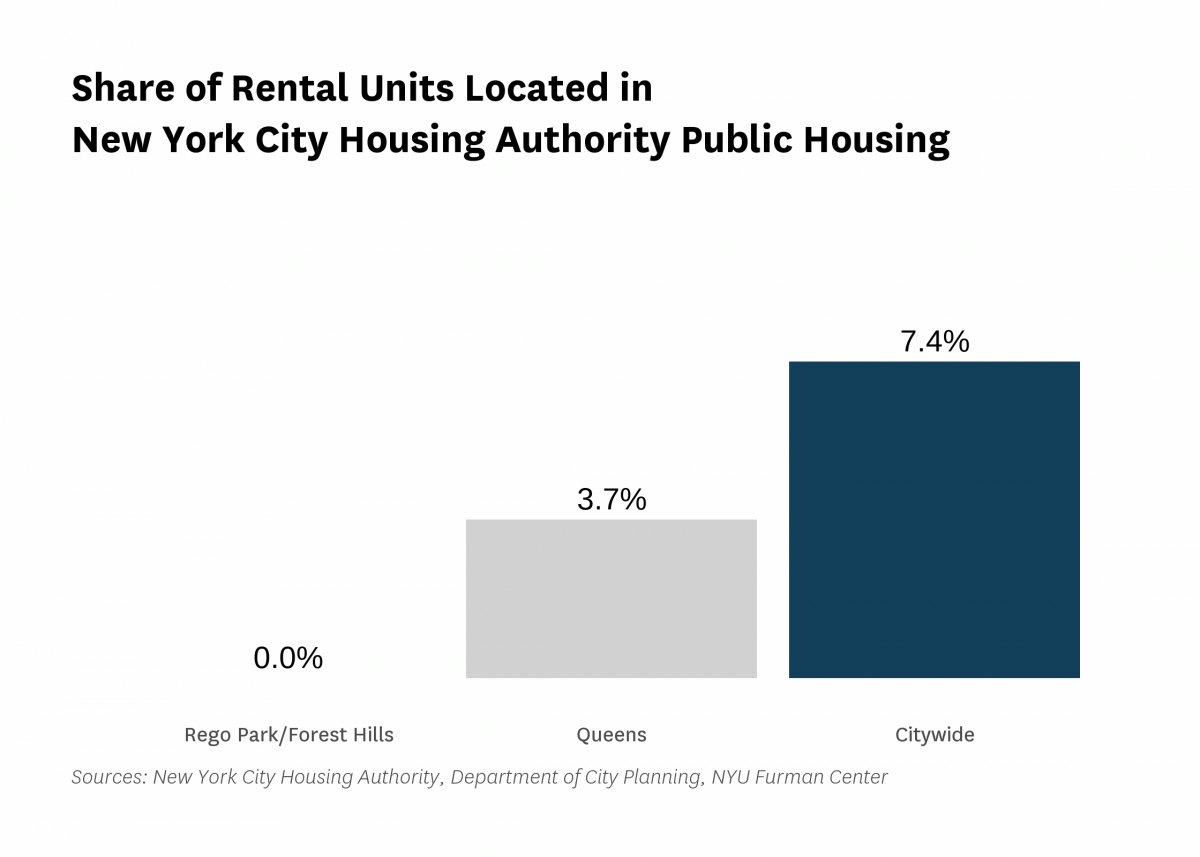
| Public housing (% of rental units) | 0.0% | |||||
Data Notes: See CoreData User Guide for more information about indicator definitions and methods.
Indicators: The rental vacancy rate, severe crowding rate, and the severely rent-burdened households indicators use five-year American Community Survey (ACS) estimates. Data under the 2010 heading comes from the 2006 – 2010 ACS, data under the 2019 heading comes from the 2015 – 2019 ACS and data under the 2021 heading comes from 2017 – 2021 ACS .
All content © 2005 – 2024 Furman Center for Real Estate and Urban Policy | Top of page | Contact Us