| Indicator | 2000 | 2006 | 2010 | 2019 | 2021 | 2022 |
|---|---|---|---|---|---|---|
| Population | ||||||
| Born in New York State | 44.6% | 44.4% | 44.0% | 45.3% | ||
| Disabled population | 6.5% | 7.0% | 6.8% | |||
| Foreign-born population | 45.9% | 48.5% | 47.7% | 47.6% | 46.8% | |
| Population | 2,242,159 | 2,255,175 | 2,233,841 | 2,253,858 | 2,331,143 | |
| Population aged 65+ | 12.6% | 13.0% | 12.9% | 16.3% | 17.3% | |
| Households | ||||||
| Households with children under 18 years old | 35.9% | 34.3% | 33.7% | 29.4% | 26.0% | |
| Single-person households | 26.3% | 25.7% | 25.4% | 28.2% | ||
| Race and Ethnicity | ||||||
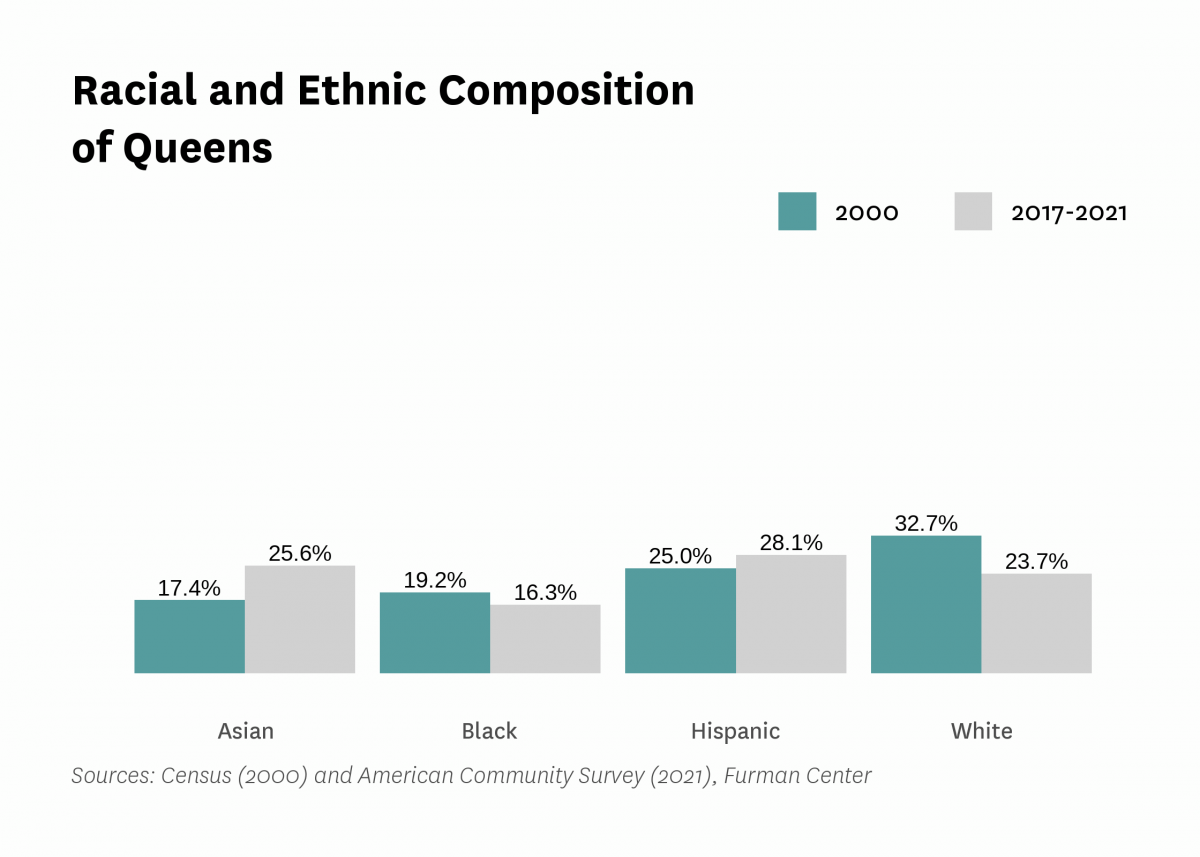
| Percent Asian | 17.4% | 21.1% | 23.1% | 26.0% | 25.6% | |
| Percent Black | 19.2% | 18.3% | 17.6% | 17.3% | 16.3% | |
| Percent Hispanic | 25.0% | 26.5% | 27.6% | 28.2% | 28.1% | |
| Percent white | 32.7% | 30.7% | 27.4% | 24.4% | 23.7% | |
| Racial diversity index | 0.76 | 0.76 | 0.76 | 0.76 | 0.77 | |
| Income and Poverty | ||||||
| Income diversity ratio | 4.3 | 4.5 | 4.9 | 4.8 | ||
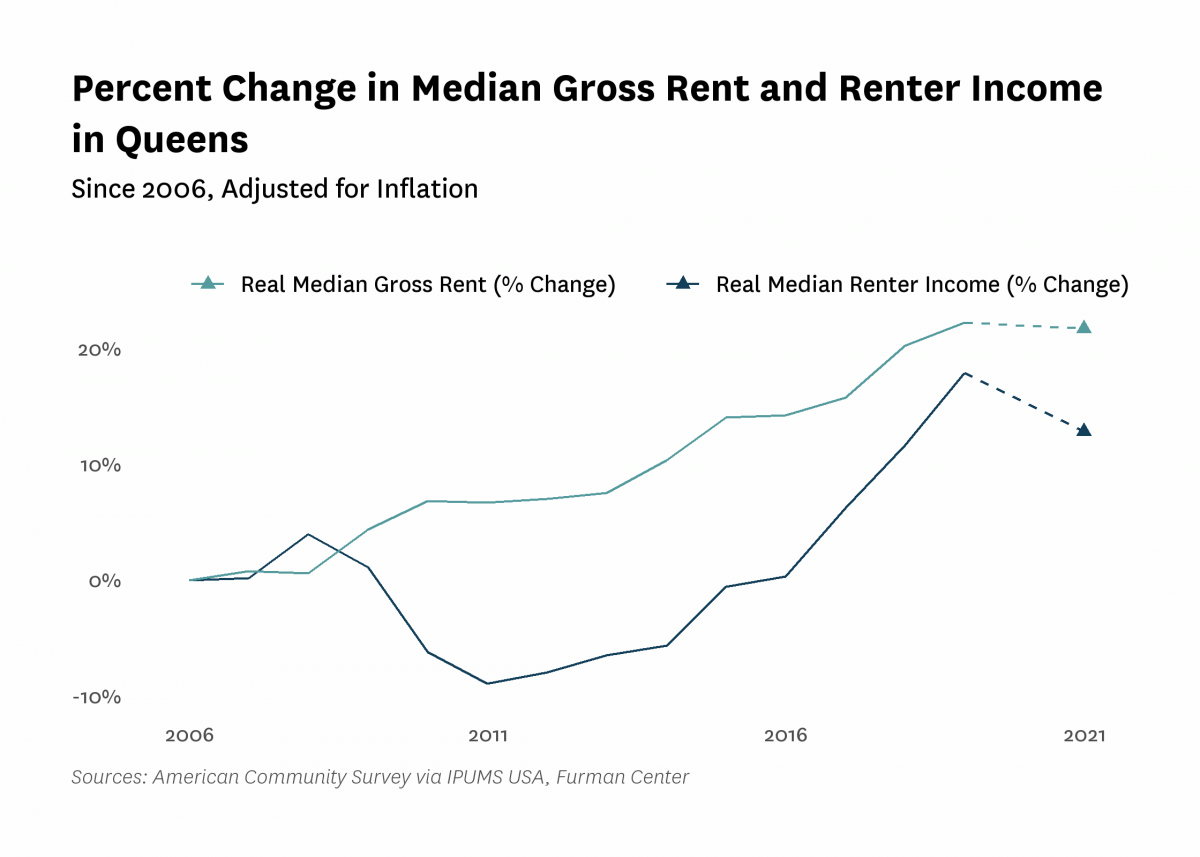
| Median household income (2022$) | $74,360 | $71,940 | $68,310 | $82,170 | $77,730 | |
| Median household income, homeowners (2022$) | $94,050 | $96,190 | $104,980 | $97,160 | ||
| Median household income, renters (2022$) | $57,030 | $53,510 | $67,240 | $64,370 | ||
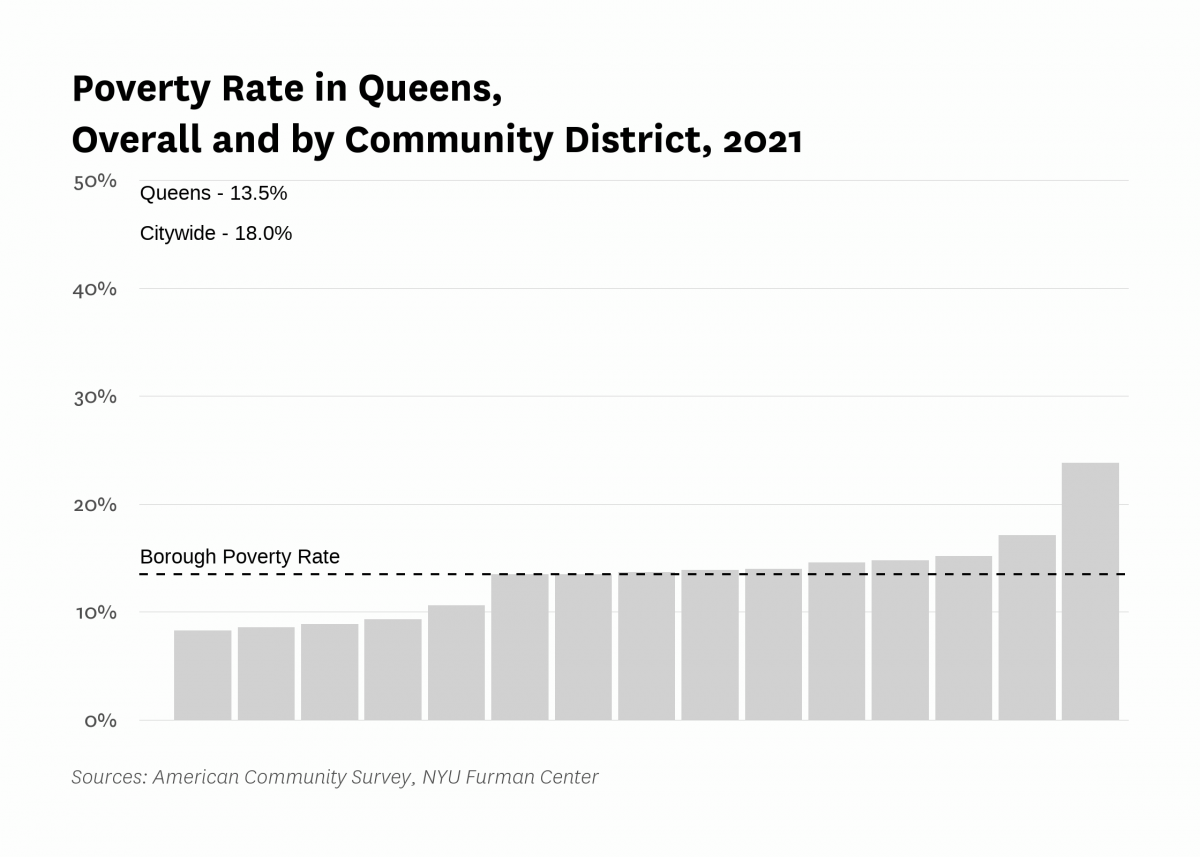
| Poverty rate | 14.6% | 12.2% | 15.0% | 10.8% | 13.5% | |
| Poverty rate, population aged 65+ | 12.5% | 12.3% | 14.6% | 14.1% | ||
| Poverty rate, population under 18 years old | 17.0% | 21.8% | 13.4% | 16.4% | ||
| Labor Market | ||||||
| Labor force participation rate | 63.8% | 64.5% | 64.2% | 61.9% | ||
| Population aged 25+ with a bachelor's degree or higher | 24.3% | 27.8% | 29.4% | 33.2% | 35.3% | |
| Population aged 25+ without a high school diploma | 20.4% | 19.6% | 17.0% | 17.8% | ||
| Unemployment rate | 7.73% | 7.50% | 11.10% | 4.62% | 11.79% | |
| Indicator | 2000 | 2006 | 2010 | 2019 | 2021 | 2022 |
|---|---|---|---|---|---|---|
| Housing Stock | ||||||
| Homeownership rate | 42.8% | 47.0% | 43.8% | 44.1% | 45.6% | |
| Housing units | 832,545 | 834,965 | 869,346 | 902,754 | ||
| Rental vacancy rate | 3.2% | 2.8% | 3.0% | |||
| Serious housing code violations (per 1,000 privately owned rental units) | 23.7 | 22.8 | 34.6 | 44.3 | 56.0 | |
| Severe crowding rate (% of renter households) | 4.5% | 5.1% | 5.5% | |||
| Total housing code violations (per 1,000 privately owned rental units) | 143.8 | 116.4 | 131.8 | 205.1 | 225.5 | |
| Finance - Distress | ||||||
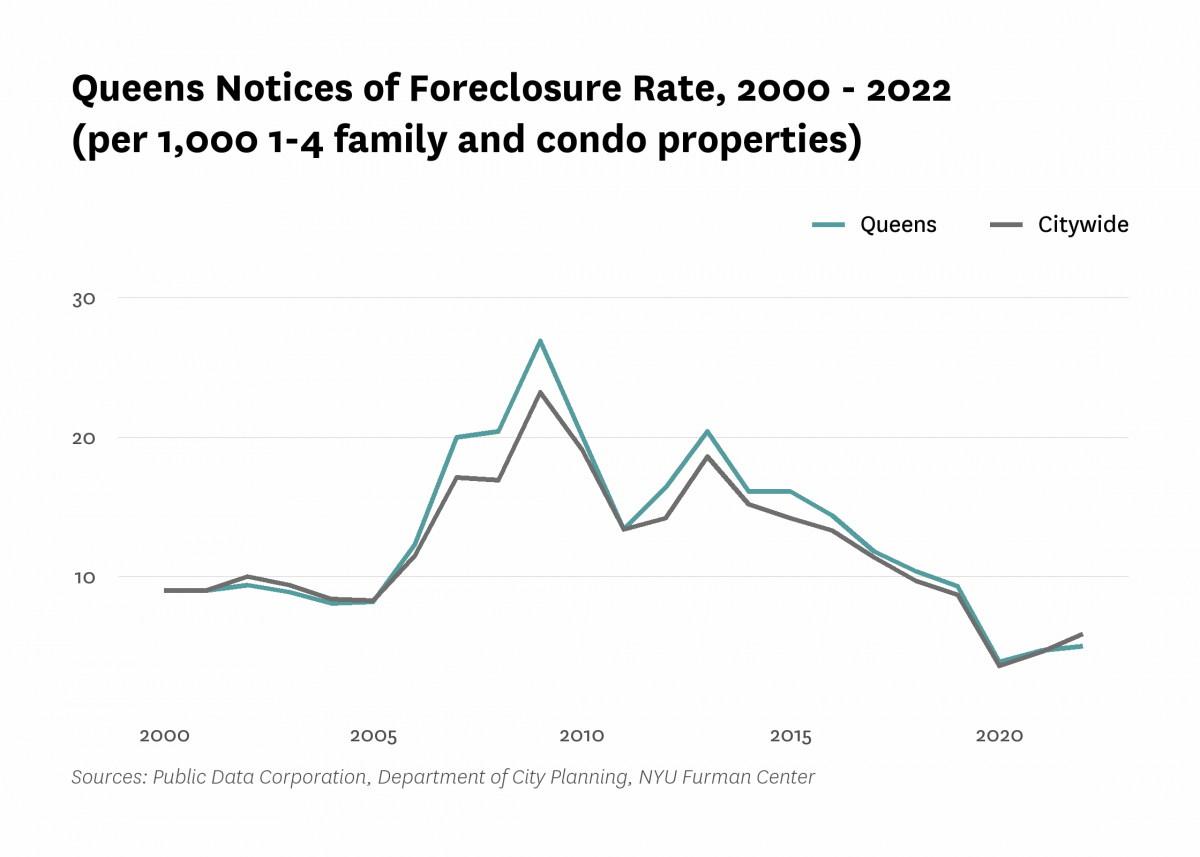
| Notices of foreclosure rate (per 1,000 1-4 family and condo properties) | 9.0 | 12.3 | 20.1 | 9.3 | 4.7 | 5.0 |
| Notices of foreclosure, all residential properties | 2,635 | 3,695 | 6,244 | 2,924 | 1,540 | 1,602 |
| Notices of foreclosure, initial, 1-4 family and condo properties | 1,948 | 2,975 | 4,763 | 1,277 | 521 | 664 |
| Notices of foreclosure, repeat, 1-4 family and condo properties | 598 | 632 | 1,302 | 1,577 | 946 | 887 |
| Pre-foreclosure notice rate (per 1,000 1-4 family and condo properties) | 53.5 | 22.0 | 47.8 | |||
| Pre-foreclosure notices, 1-4 family and condo properties | 16,484 | 6,877 | 14,937 | |||
| Properties entering REO, 1-4 family | 438 | 123 | 547 | |||
| Finance - Lending | ||||||
| FHA/VA-backed home purchase loans (% of home purchase loans) | 0.4% | 26.2% | 13.8% | 11.1% | ||
| Higher-cost home purchase loans (% of home purchase loans) | 27.9% | 1.1% | 8.7% | 6.7% | ||
| Higher-cost refinance loans (% of refinance loans) | 33.4% | 2.2% | 4.3% | 1.2% | ||
| Home purchase loan rate (per 1,000 properties) | 47.8 | 20.7 | 20.8 | 28.3 | ||
| Home purchase loans in LMI tracts (% of home purchase loans) | 20.2% | 13.6% | 14.0% | 15.9% | ||
| Home purchase loans to LMI borrowers (% of home purchase loans) | 5.0% | 14.4% | 9.4% | 11.5% | ||
| Refinance loan rate (per 1,000 properties) | 49.5 | 16.0 | 16.1 | 37.6 | ||
| Sales - Volume | ||||||
| Sales volume, 1 family building | 6,543 | 8,826 | 3,949 | 4,012 | 4,429 | 5,069 |
| Sales volume, 2-4 family building | 5,051 | 7,549 | 3,203 | 2,584 | 2,694 | 3,643 |
| Sales volume, 5+ family building | 262 | 340 | 153 | 179 | 190 | 227 |
| Sales volume, condominium | 823 | 1,515 | 1,451 | 1,138 | 2,266 | 1,894 |
| Sales volume, all property types | 12,679 | 18,230 | 8,756 | 7,913 | 9,579 | 10,833 |
| Sales - Median Prices | ||||||
| Median sales price per unit, 1 family building (2022$) | $382,370 | $668,900 | $533,070 | $724,720 | $805,320 | $786,180 |
| Median sales price per unit, 2-4 family building (2022$) | $219,220 | $411,040 | $286,500 | $445,980 | $466,850 | $458,330 |
| Median sales price per unit, 5+ family building (2022$) | $84,970 | $171,870 | $157,340 | $262,940 | $233,430 | $221,130 |
| Median sales price per unit, condominium (2022$) | $280,400 | $491,840 | $474,010 | $641,100 | $708,200 | $630,000 |
| Sales - Housing Price Index | ||||||
| Index of housing price appreciation, 1 family building | 100.0 | 217.3 | 168.1 | 274.4 | 308.7 | 313.4 |
| Index of housing price appreciation, 2-4 family building | 100.0 | 232.8 | 165.1 | 301.6 | 336.6 | 335.2 |
| Index of housing price appreciation, 5+ family building | 100.0 | 237.2 | 218.4 | 418.9 | 449.8 | 488.8 |
| Index of housing price appreciation, condominium | 100.0 | 224.9 | 201.9 | 316.5 | 316.9 | 328.5 |
| Index of housing price appreciation, all property types | 100.0 | 224.0 | 171.2 | 288.8 | 316.2 | 322.7 |
| Subsidized Housing | ||||||
| Total number of subsidized properties (properties) | 499 | |||||
| HUD Financing or Insurance (properties) | 40 | |||||
| HUD Financing or Insurance (units) | 6,220 | |||||
| HUD Project-based Rental Assistance Program (properties) | 54 | |||||
| HUD Project-based Rental Assistance Program (units) | 7,520 | |||||
| Low Income Housing Tax Credit (properties) | 70 | |||||
| Low Income Housing Tax Credit (units) | 11,616 | |||||
| Public Housing (properties) | 36 | |||||
| Public Housing (units) | 15,743 | |||||
| Mitchell-Lama (properties) | 21 | |||||
| Mitchell-Lama (units) | 14,464 | |||||
| 421-a Tax Exemption (properties) | 1,142 | |||||
| 421-a Tax Exemption (units) | 39,581 | |||||
| 420-c Tax Exemption (properties) | 48 | |||||
| 420-c Tax Exemption (units) | 5,453 | |||||
| NYC Housing Production Programs and Zoning Incentives or Requirements (properties) | 207 | |||||
| Eligible to expire from housing programs between 2023 and 2028 (properties) | 16 | |||||
| Eligible to expire from housing programs between 2023 and 2028 (units) | 1,572 | |||||
| Eligible to expire from housing programs between 2029 and 2038 (properties) | 20 | |||||
| Eligible to expire from housing programs between 2029 and 2038 (units) | 8,514 | |||||
| Eligible to expire from housing programs in 2039 and later (properties) | 88 | |||||
| Eligible to expire from housing programs in 2039 and later (units) | 13,961 | |||||
| Indicator | 2000 | 2006 | 2010 | 2019 | 2021 | 2022 |
|---|---|---|---|---|---|---|
| Density | ||||||
| Population density (1,000 persons per square mile) | 20.7 | 20.5 | 20.7 | 21.4 | ||
| Development | ||||||
| Units authorized by new residential building permits | 3,207 | 9 | 2,499 | 6,752 | 5,280 | 14,720 |
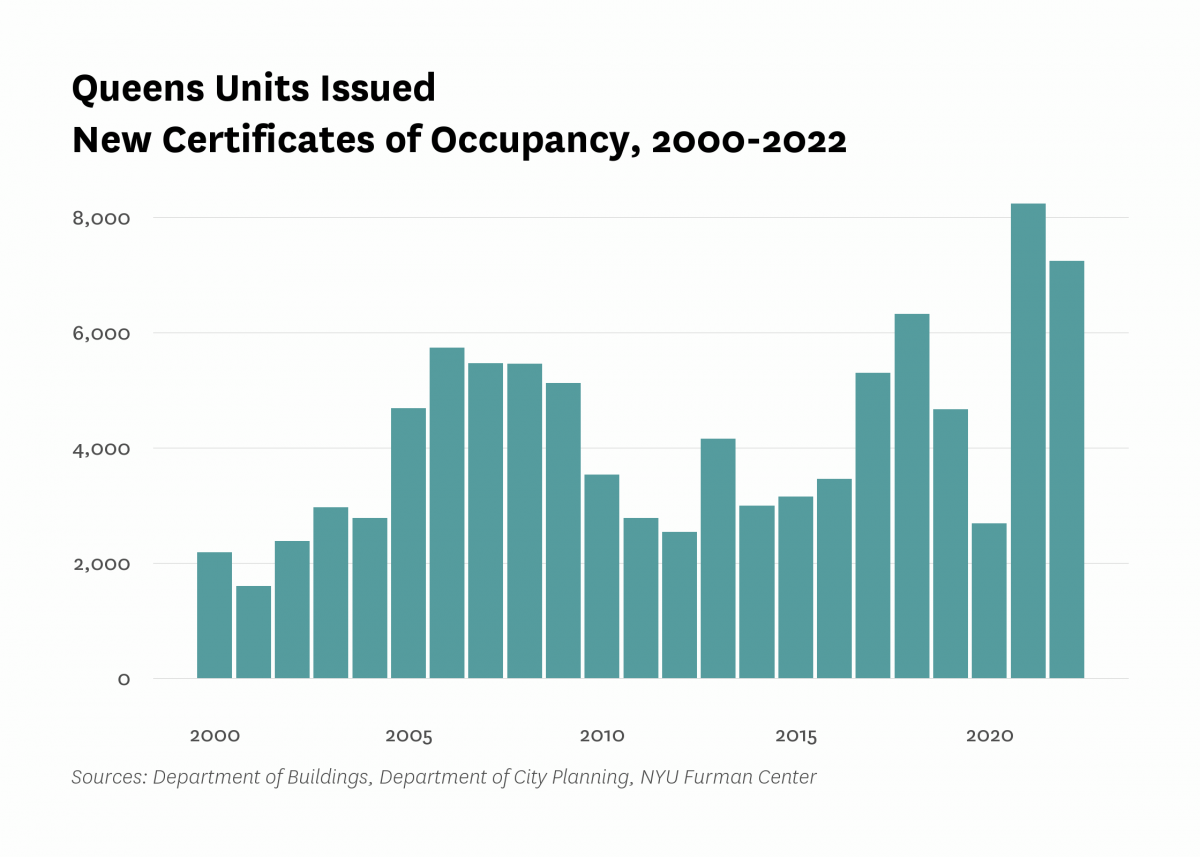
| Units issued new certificates of occupancy | 2,181 | 5,743 | 3,532 | 4,671 | 8,243 | 7,251 |
| Indicator | 2000 | 2006 | 2010 | 2019 | 2021 | 2022 |
|---|---|---|---|---|---|---|
| Commute | ||||||
| Car-free commute (% of commuters) | 53.6% | 57.9% | 57.8% | 58.9% | 50.9% | |
| Mean travel time to work (minutes) | 42.2 | 41.8 | 41.1 | 44.2 | 41.0 | |
| Crime and Incarceration | ||||||
| Serious crime rate (per 1,000 residents) | 19.1 | 12.4 | 10.3 | 8.4 | 9.0 | 10.8 |
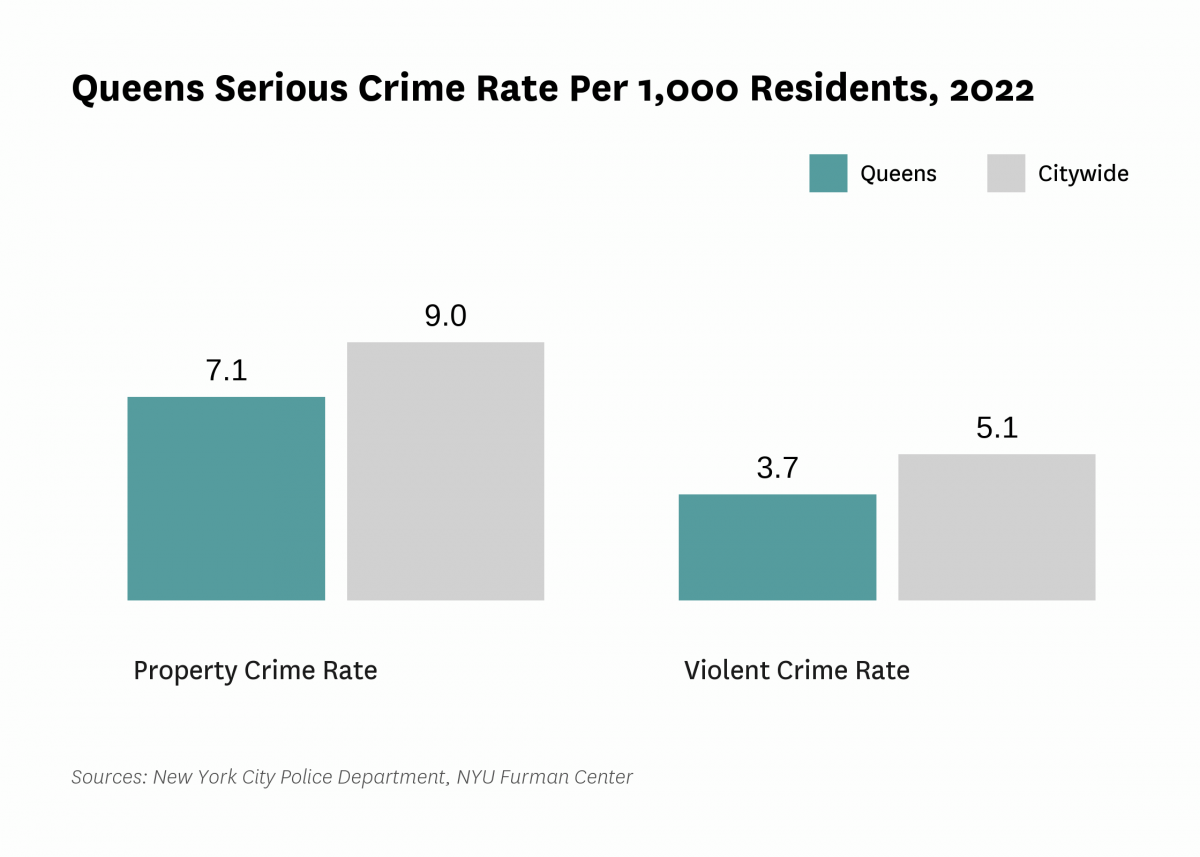
| Serious crime rate, property (per 1,000 residents) | 13.8 | 8.8 | 6.9 | 5.2 | 6.0 | 7.1 |
| Serious crime rate, violent (per 1,000 residents) | 5.2 | 3.7 | 3.5 | 3.2 | 3.0 | 3.7 |
| Schools | ||||||
| Students performing at grade level in English language arts, 4th grade | 54.5% | 48.4% | ||||
| Students performing at grade level in math, 4th grade | 55.7% | 47.4% | ||||
| Indicator | 2000 | 2006 | 2010 | 2019 | 2021 | 2022 |
|---|---|---|---|---|---|---|
| Median Rent | ||||||
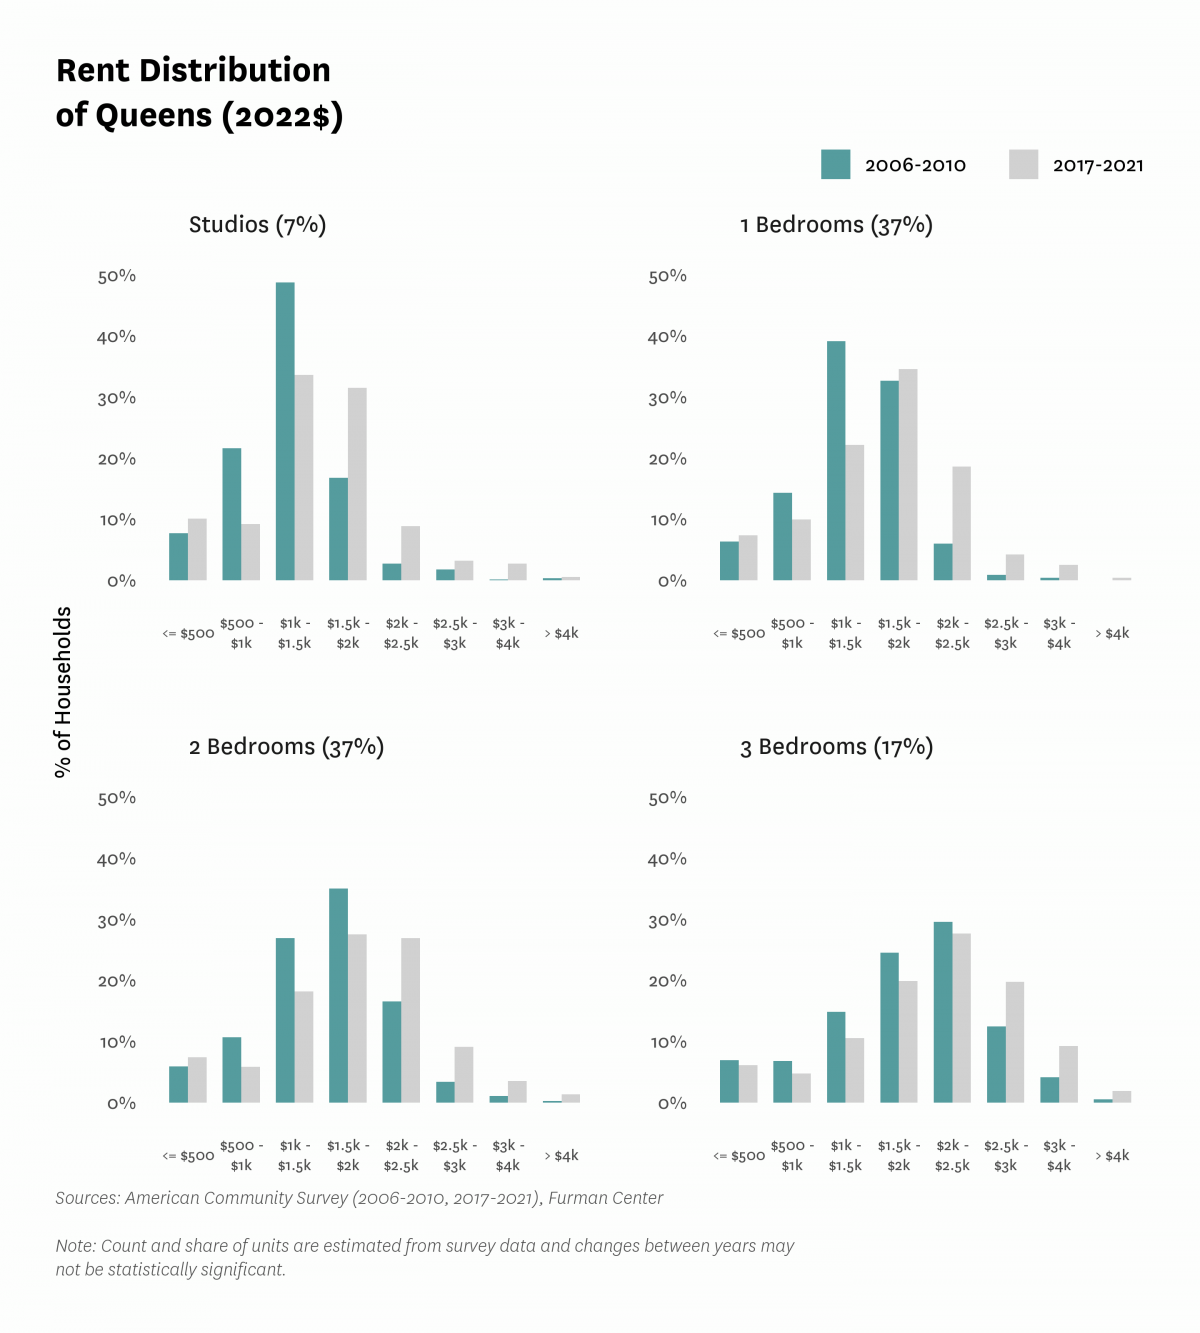
| Median rent, 2- and 3-bedrooms (2022$) | $1,700 | $1,830 | $1,980 | |||
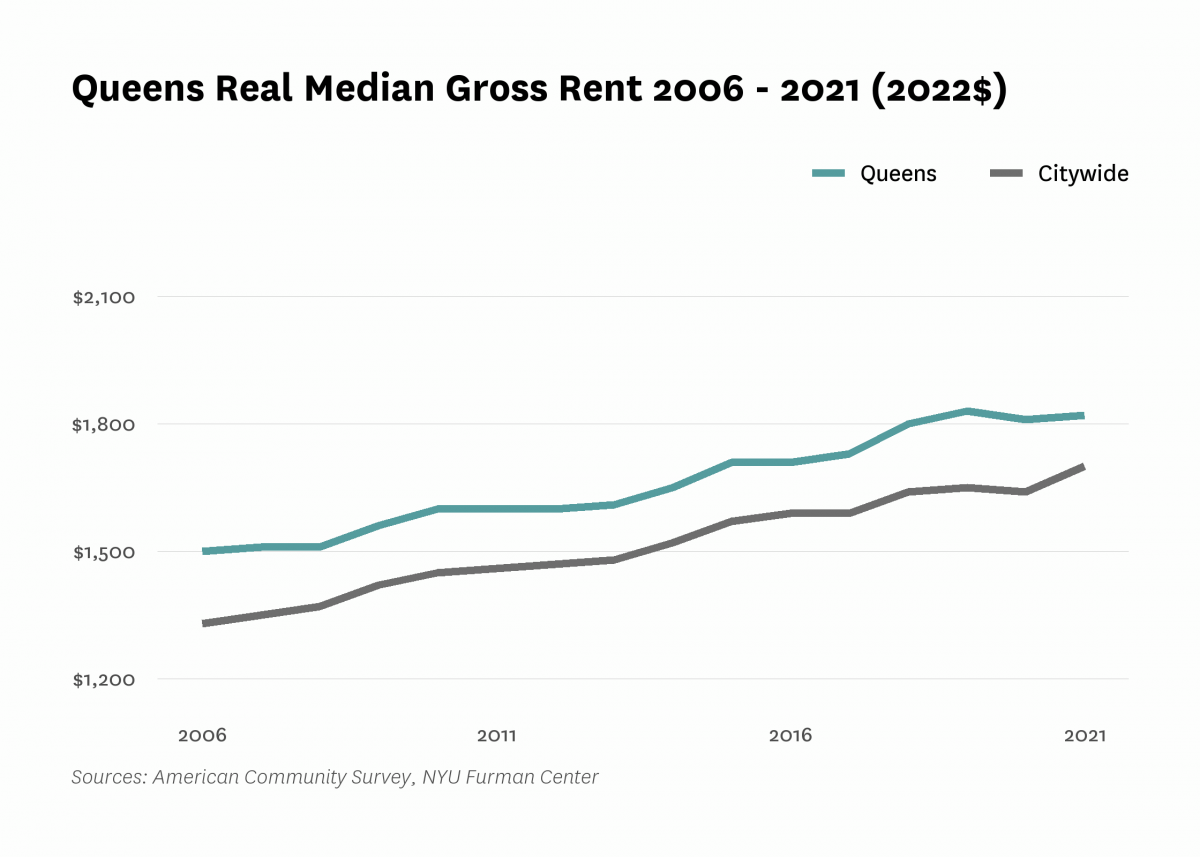
| Median rent, all (2022$) | $1,320 | $1,500 | $1,600 | $1,830 | $1,820 | |
| Median rent, recent movers (2022$) | $1,750 | $1,980 | $2,130 | |||
| Median rent, studios and 1-bedrooms (2022$) | $1,370 | $1,530 | $1,630 | |||
| Affordability | ||||||
| Rental units affordable at 30% AMI (% of recently available units) | 3.6% | 4.1% | 4.4% | |||
| Rental units affordable at 80% AMI (% of recently available units) | 50.4% | 52.4% | 51.5% | |||
| Rental units affordable at 120% AMI (% of recently available units) | 95.4% | 93.6% | 92.8% | |||
| Rent Burden | ||||||
| Moderately rent-burdened households | 24.3% | 25.2% | 24.0% | 25.7% | ||
| Moderately rent-burdened households, low income | 33.9% | 33.4% | 34.3% | |||
| Moderately rent-burdened households, moderate income | 17.2% | 15.4% | 16.0% | |||
| Severely rent-burdened households | 22.0% | 28.0% | 28.7% | 27.4% | ||
| Severely rent-burdened households, low income | 46.2% | 45.0% | 43.6% | |||
| Severely rent-burdened households, moderate income | 0.7% | 0.5% | 0.5% | |||
| Rental Subsidy | ||||||
| Housing choice vouchers (% of occupied, privately owned rental units) | 2.8% | 2.4% | ||||
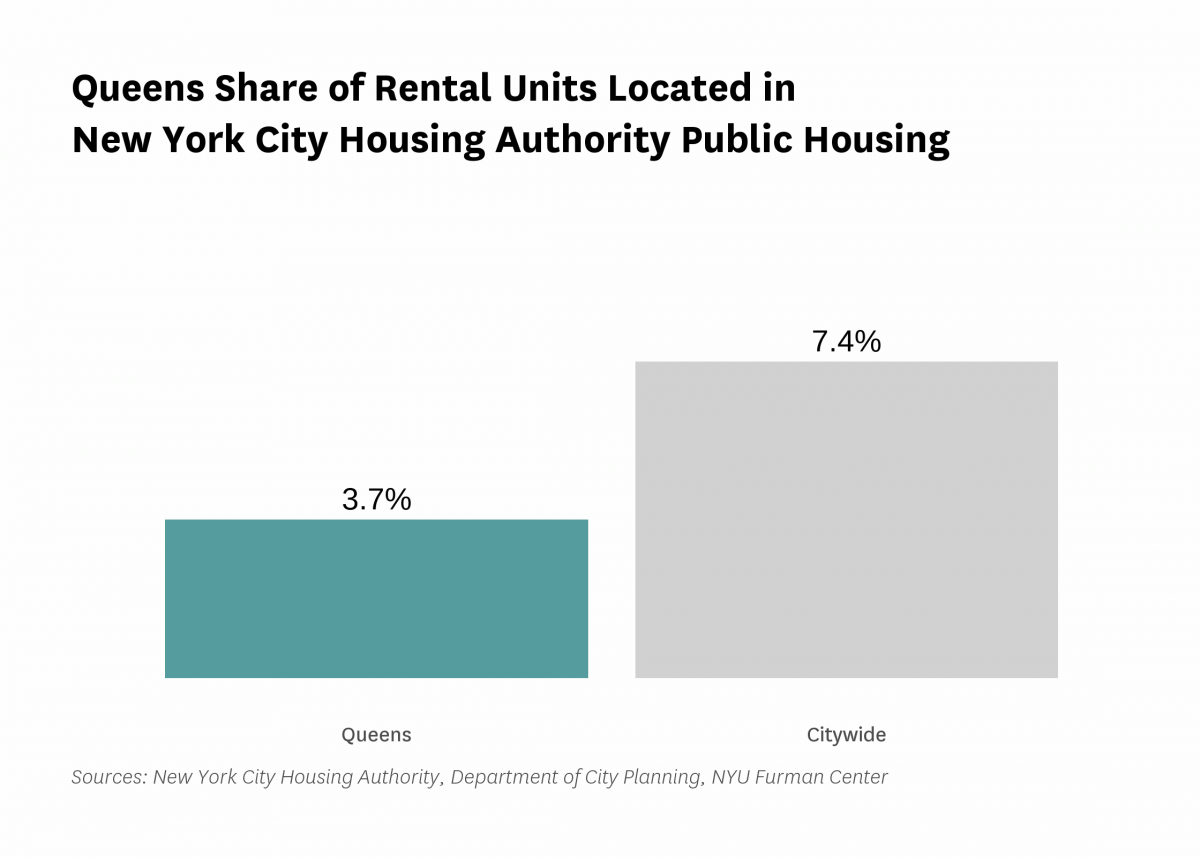
| Public housing (% of rental units) | 3.7% | |||||
Data Notes: See CoreData User Guide for more information about indicator definitions and methods.
Indicators: The rental vacancy rate, severe crowding rate, and the severely rent-burdened households indicators use five-year American Community Survey (ACS) estimates. Data under the 2010 heading comes from the 2006 – 2010 ACS, data under the 2019 heading comes from the 2015 – 2019 ACS and data under the 2021 heading comes from 2017 – 2021 ACS .
All content © 2005 – 2024 Furman Center for Real Estate and Urban Policy | Top of page | Contact Us