| Indicator | 2000 | 2006 | 2010 | 2019 | 2021 | 2022 |
|---|---|---|---|---|---|---|
| Population | ||||||
| Born in New York State info | 55.5% | 54.8% | 55.9% | 54.9% | ||
| Disabled population info | 15.2% | 18.4% | 17.0% | |||
| Foreign-born population info | 21.5% | 27.6% | 29.5% | 29.9% | 28.4% | |
| Population info | 141,685 | 156,950 | 160,651 | 172,930 | 175,532 | |
| Population aged 65+ info | 7.1% | 6.2% | 7.2% | 10.0% | 11.3% | |
| Households | ||||||
| Households with children under 18 years old info | 50.7% | 50.2% | 47.4% | 35.8% | 34.9% | |
| Single-person households info | 28.2% | 29.1% | 36.0% | 32.7% | ||
| Race and Ethnicity | ||||||
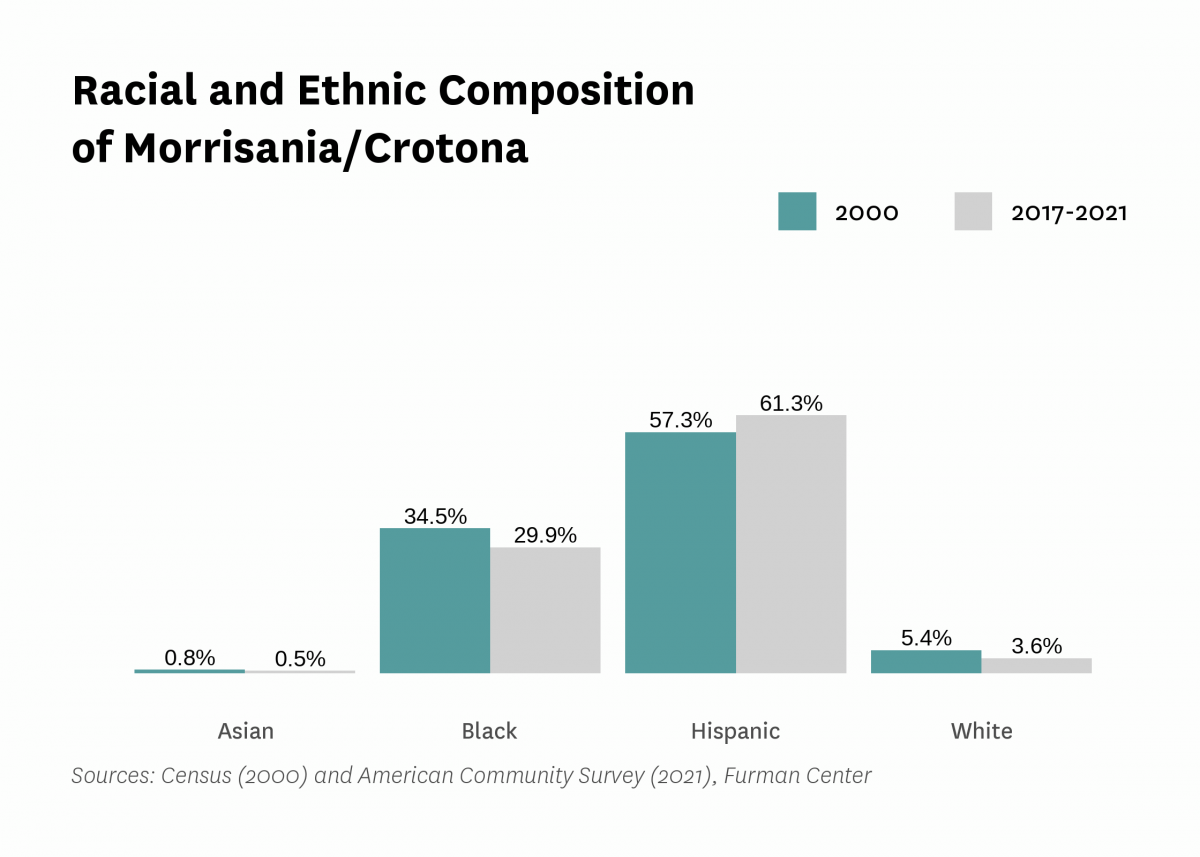
| Percent Asian info | 0.8% | 0.6% | 0.7% | 0.6% | 0.5% | |
| Percent Black info | 34.5% | 32.2% | 30.2% | 36.1% | 29.9% | |
| Percent Hispanic info | 57.3% | 61.8% | 63.6% | 58.9% | 61.3% | |
| Percent white info | 5.4% | 4.1% | 4.1% | 3.2% | 3.6% | |
| Racial diversity index info | 0.55 | 0.51 | 0.50 | 0.52 | 0.53 | |
| Income and Poverty | ||||||
| Income diversity ratio info | 4.8 | 5.3 | 6.5 | 6.3 | ||
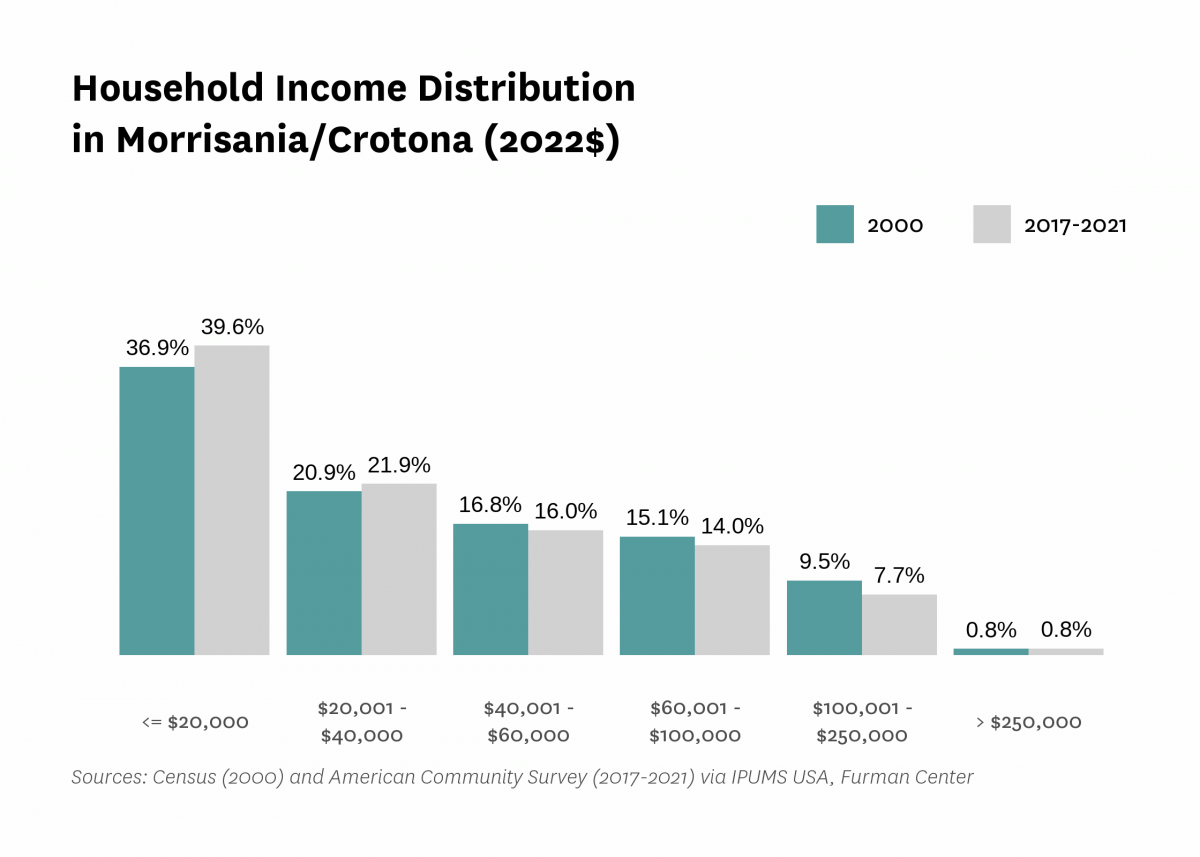
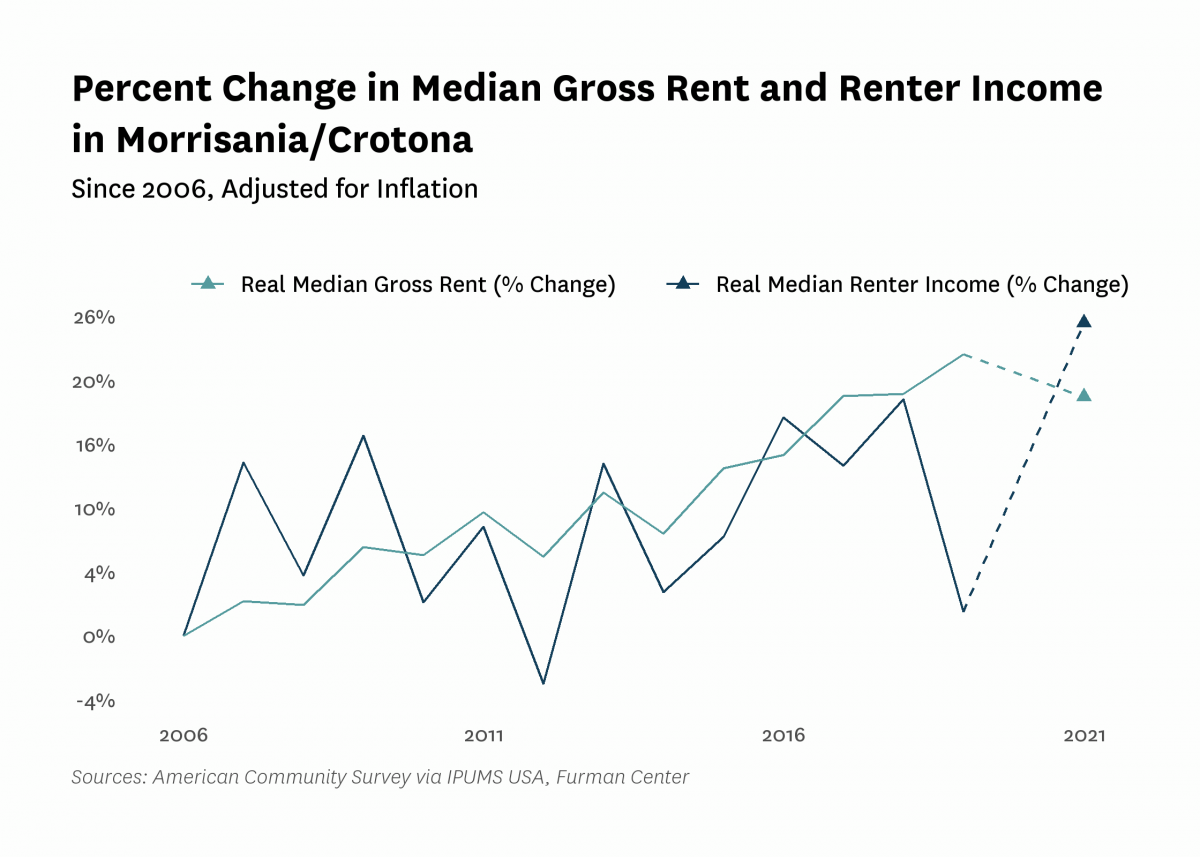
| Median household income (2022$) info | $32,420 | $25,920 | $26,490 | $26,320 | $31,990 | |
| Median household income, homeowners (2022$) info | $71,310 | $77,400 | $86,560 | $90,850 | ||
| Median household income, renters (2022$) info | $23,830 | $24,470 | $24,280 | $29,690 | ||
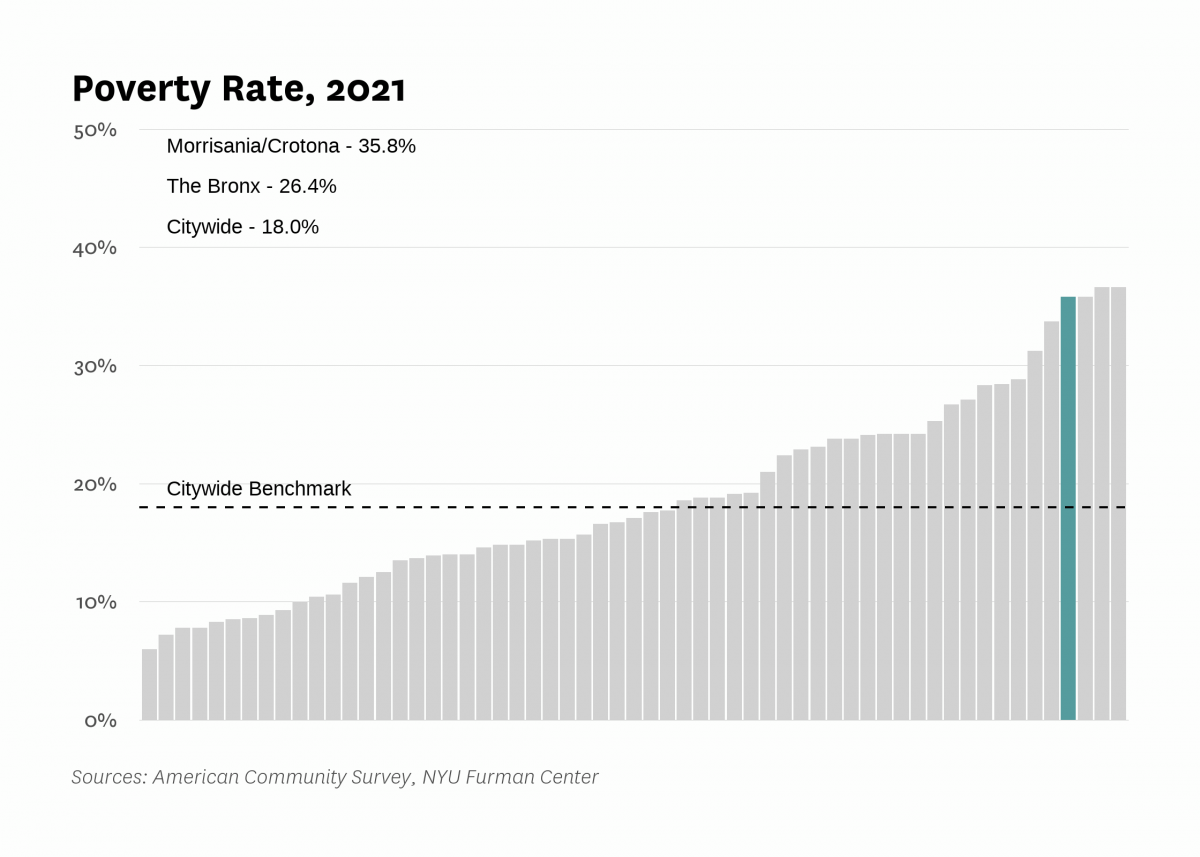
| Poverty rate info | 45.5% | 43.5% | 43.5% | 40.3% | 35.8% | |
| Poverty rate, population aged 65+ info | 38.2% | 37.4% | 46.9% | 44.2% | ||
| Poverty rate, population under 18 years old info | 55.2% | 58.6% | 50.2% | 41.7% | ||
| Labor Market | ||||||
| Labor force participation rate info | 53.3% | 53.3% | 55.0% | 56.1% | ||
| Population aged 25+ without a high school diploma info | 43.1% | 40.1% | 32.4% | 32.9% | ||
| Unemployment rate info | 21.16% | 13.09% | 17.09% | 11.49% | 19.54% | |
| Indicator | 2000 | 2006 | 2010 | 2019 | 2021 | 2022 |
|---|---|---|---|---|---|---|
| Housing Stock | ||||||
| Homeownership rate info | 8.5% | 8.0% | 7.4% | 5.1% | 7.8% | |
| Housing units info | 55,752 | 56,004 | 66,971 | 67,007 | ||
| Rental vacancy rate info | 4.5% | 2.0% | 2.0% | |||
| Serious housing code violations (per 1,000 privately owned rental units) | 134.7 | 140.3 | 165.1 | 142.9 | 184.1 | |
| Severe crowding rate (% of renter households) info | 3.2% | 3.9% | 3.9% | |||
| Total housing code violations (per 1,000 privately owned rental units) | 591.5 | 565.9 | 532.0 | 503.8 | 577.5 | |
| Finance - Distress | ||||||
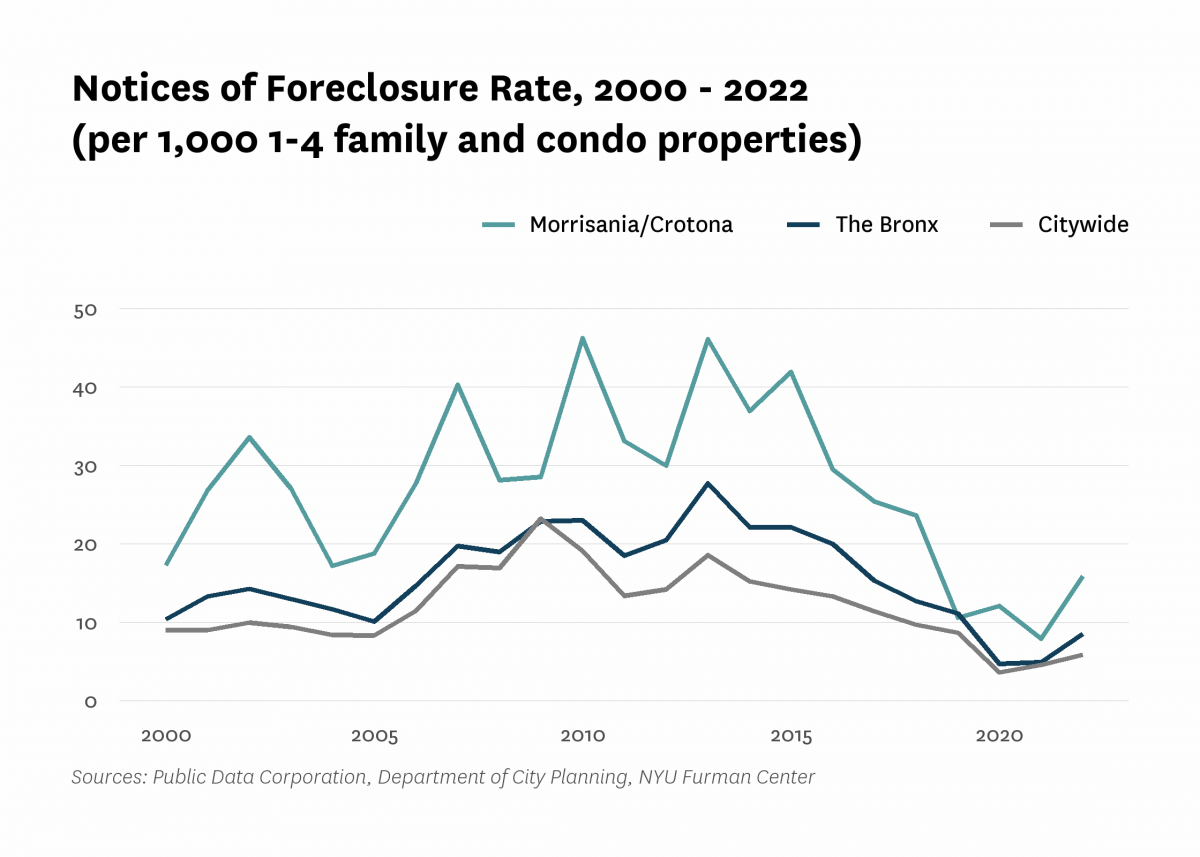
| Notices of foreclosure rate (per 1,000 1-4 family and condo properties) | 17.3 | 27.7 | 46.2 | 10.6 | 7.9 | 15.9 |
| Notices of foreclosure, all residential properties | 31 | 60 | 111 | 24 | 17 | 35 |
| Notices of foreclosure, initial, 1-4 family and condo properties | 16 | 44 | 81 | 11 | 7 | 17 |
| Notices of foreclosure, repeat, 1-4 family and condo properties | 12 | 13 | 19 | 12 | 10 | 17 |
| Pre-foreclosure notice rate (per 1,000 1-4 family and condo properties) | 82.4 | 33.9 | 77.0 | |||
| Pre-foreclosure notices, 1-4 family and condo properties | 178 | 72 | 165 | |||
| Properties entering REO, 1-4 family | 7 | 2 | 7 | |||
| Finance - Lending | ||||||
| FHA/VA-backed home purchase loans (% of home purchase loans) | 1.5% | 78.2% | 42.7% | 49.6% | ||
| Higher-cost home purchase loans (% of home purchase loans) | 48.3% | 3.8% | 10.7% | 4.3% | ||
| Higher-cost refinance loans (% of refinance loans) | 45.3% | 11.3% | 2.2% | 0.0% | ||
| Home purchase loan rate (per 1,000 properties) | 48.7 | 10.6 | 10.0 | 15.5 | ||
| Home purchase loans in LMI tracts (% of home purchase loans) | 100.0% | 13.0% | 100.0% | 100.0% | ||
| Home purchase loans to LMI borrowers (% of home purchase loans) | 3.1% | 100.0% | 12.2% | 15.0% | ||
| Refinance loan rate (per 1,000 properties) | 61.0 | 7.2 | 12.0 | 22.2 | ||
| Sales - Volume | ||||||
| Sales volume, 1 family building | 16 | 34 | 10 | 11 | 10 | 16 |
| Sales volume, 2-4 family building | 69 | 160 | 45 | 34 | 33 | 44 |
| Sales volume, 5+ family building | 16 | 12 | 7 | 5 | 11 | 10 |
| Sales volume, condominium | 0 | 6 | 11 | 12 | 8 | 9 |
| Sales volume, all property types | 101 | 212 | 73 | 62 | 62 | 79 |
| Sales - Median Prices | ||||||
| Median sales price per unit, 1 family building (2022$) | $240,470 | $435,630 | $357,960 | $466,280 | $521,490 | $499,780 |
| Median sales price per unit, 2-4 family building (2022$) | $134,250 | $281,050 | $208,170 | $295,000 | $328,920 | $311,670 |
| Median sales price per unit, 5+ family building (2022$) | $45,180 | $102,580 | $84,660 | $170,730 | $137,620 | $155,650 |
| Median sales price per unit, condominium (2022$) | $270,510 | $298,990 | $337,270 | $346,420 | $355,000 | |
| Sales - Housing Price Index | ||||||
| Index of housing price appreciation, 1 family building | 100.0 | 218.9 | 172.1 | 142.5 | 277.0 | 321.8 |
| Index of housing price appreciation, 2-4 family building | 100.0 | 202.4 | 125.5 | 261.6 | 269.1 | 273.8 |
| Index of housing price appreciation, 5+ family building | 100.0 | 249.4 | 201.4 | 509.5 | 321.2 | 503.9 |
| Index of housing price appreciation, condominium | 100.0 | 57.7 | 70.7 | 88.0 | 109.7 | |
| Index of housing price appreciation, all property types | 100.0 | 213.7 | 150.4 | 254.7 | 282.1 | 286.6 |
| Subsidized Housing | ||||||
| Total number of subsidized properties (properties) | 751 | |||||
| HUD Financing or Insurance (properties) | 13 | |||||
| HUD Financing or Insurance (units) | 775 | |||||
| HUD Project-based Rental Assistance Program (properties) | 40 | |||||
| HUD Project-based Rental Assistance Program (units) | 2,261 | |||||
| Low Income Housing Tax Credit (properties) | 209 | |||||
| Low Income Housing Tax Credit (units) | 10,387 | |||||
| Public Housing (properties) | 27 | |||||
| Public Housing (units) | 7,459 | |||||
| Mitchell-Lama (properties) | 1 | |||||
| Mitchell-Lama (units) | 320 | |||||
| 421-a Tax Exemption (properties) | 64 | |||||
| 421-a Tax Exemption (units) | 3,347 | |||||
| 420-c Tax Exemption (properties) | 155 | |||||
| 420-c Tax Exemption (units) | 7,775 | |||||
| NYC Housing Production Programs and Zoning Incentives or Requirements (properties) | 278 | |||||
| Eligible to expire from housing programs between 2023 and 2028 (properties) | 28 | |||||
| Eligible to expire from housing programs between 2023 and 2028 (units) | 876 | |||||
| Eligible to expire from housing programs between 2029 and 2038 (properties) | 92 | |||||
| Eligible to expire from housing programs between 2029 and 2038 (units) | 3,994 | |||||
| Eligible to expire from housing programs in 2039 and later (properties) | 115 | |||||
| Eligible to expire from housing programs in 2039 and later (units) | 7,191 | |||||
| Indicator | 2000 | 2006 | 2010 | 2019 | 2021 | 2022 |
|---|---|---|---|---|---|---|
| Density | ||||||
| Population density (1,000 persons per square mile) info | 35.9 | 36.7 | 39.5 | 40.1 | ||
| Development | ||||||
| Units authorized by new residential building permits | 11 | 0 | 259 | 342 | 539 | 558 |
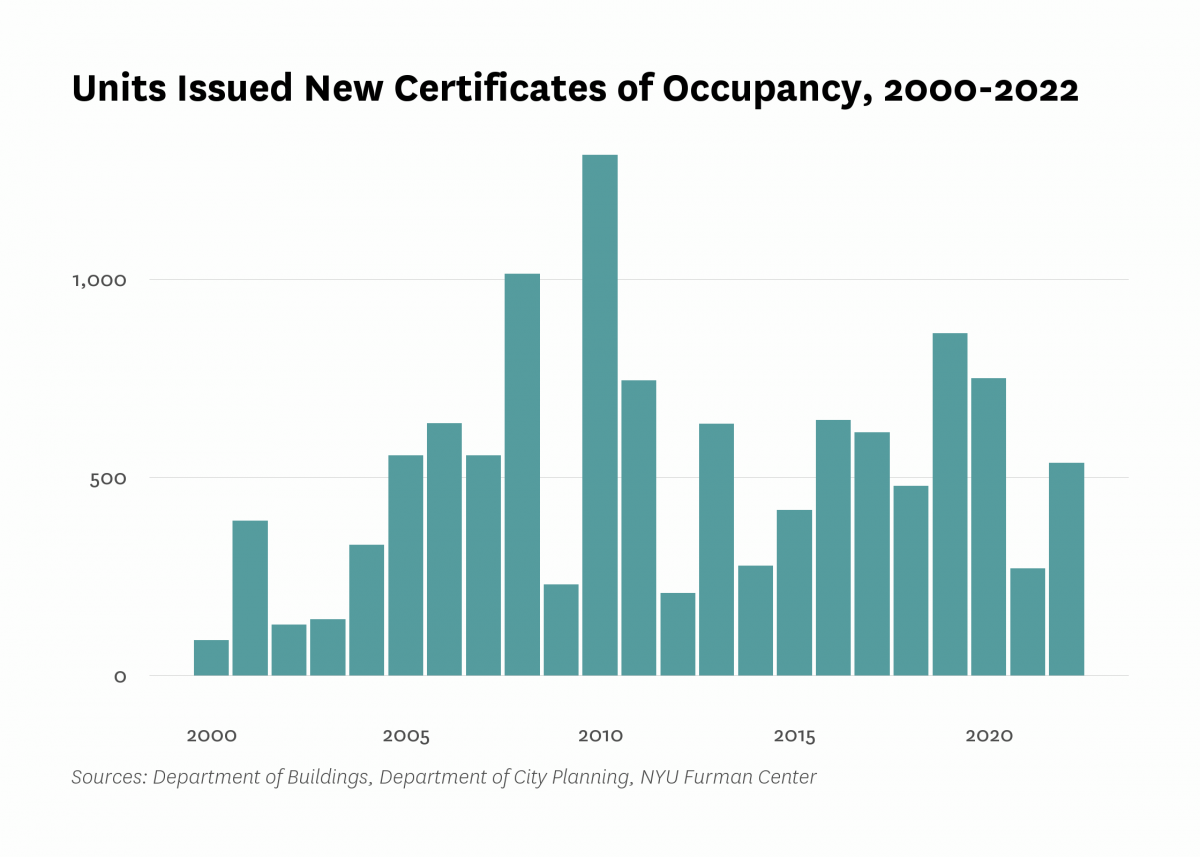
| Units issued new certificates of occupancy | 90 | 637 | 1,313 | 863 | 271 | 536 |
| Indicator | 2000 | 2006 | 2010 | 2019 | 2021 | 2022 |
|---|---|---|---|---|---|---|
| Commute | ||||||
| Car-free commute (% of commuters) info | 70.3% | 75.1% | 75.0% | 77.1% | 66.8% | |
| Mean travel time to work (minutes) | 45.0 | 38.2 | 40.7 | 44.0 | 44.7 | |
| Crime and Incarceration | ||||||
| Serious crime rate (per 1,000 residents) | 21.7 | 14.2 | 18.7 | 20.6 | 23.0 | |
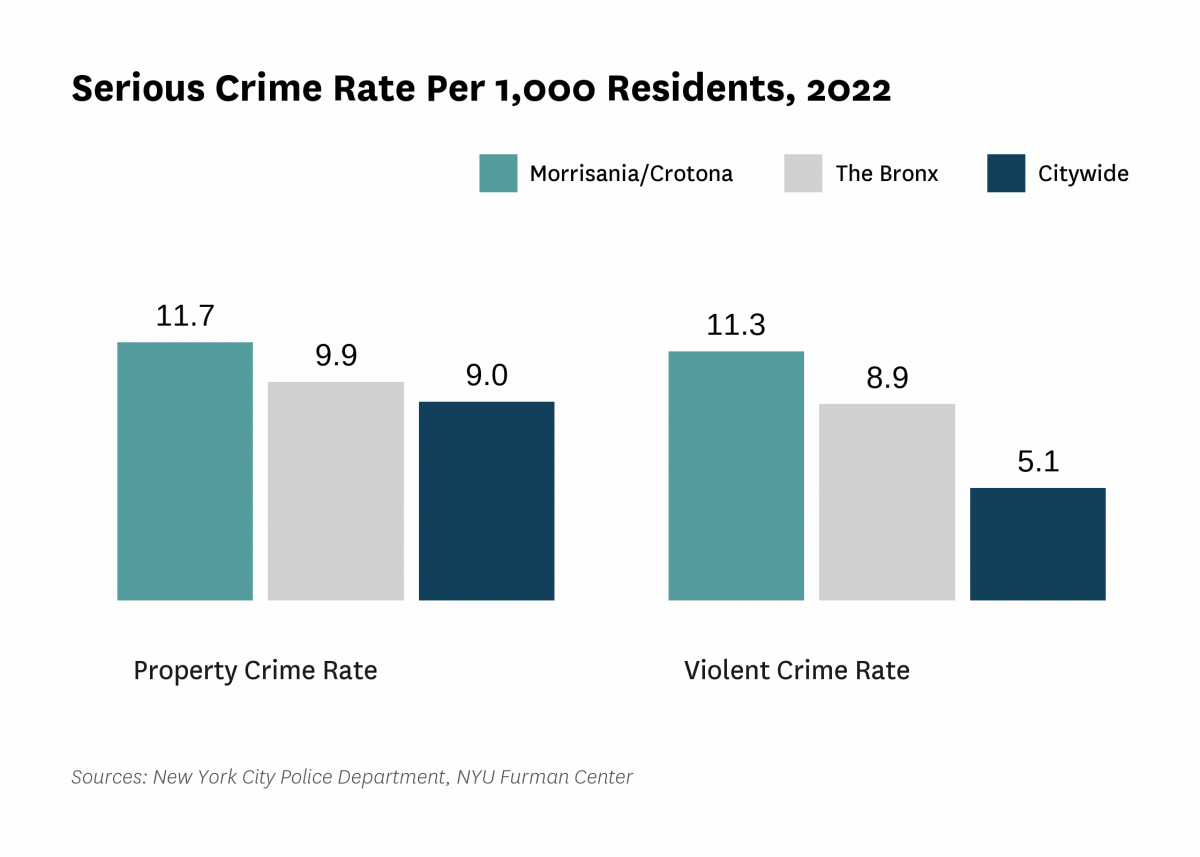
| Serious crime rate, property (per 1,000 residents) | 11.8 | 6.3 | 8.8 | 10.0 | 11.7 | |
| Serious crime rate, violent (per 1,000 residents) | 9.9 | 7.9 | 10.0 | 10.7 | 11.3 | |
| Schools | ||||||
| Students performing at grade level in English language arts, 4th grade | 33.6% | 19.8% | ||||
| Students performing at grade level in math, 4th grade | 26.4% | 17.6% | ||||
| Indicator | 2000 | 2006 | 2010 | 2019 | 2021 | 2022 |
|---|---|---|---|---|---|---|
| Median Rent | ||||||
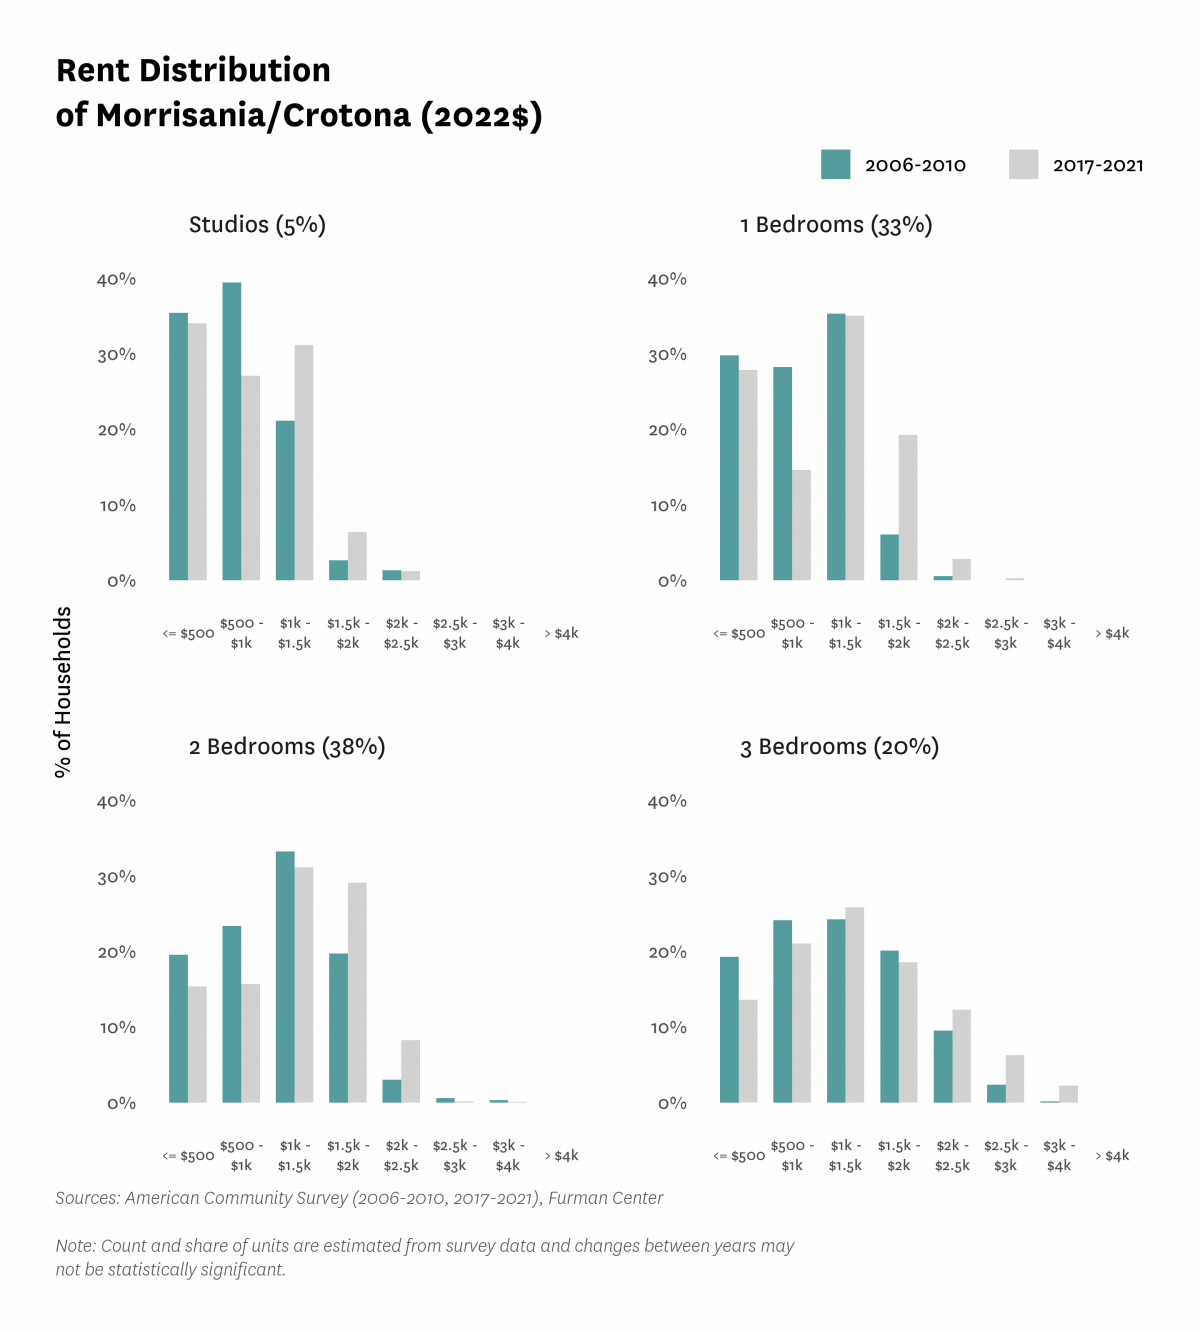
| Median rent, 2- and 3-bedrooms (2022$) info | $1,130 | $1,240 | $1,320 | |||
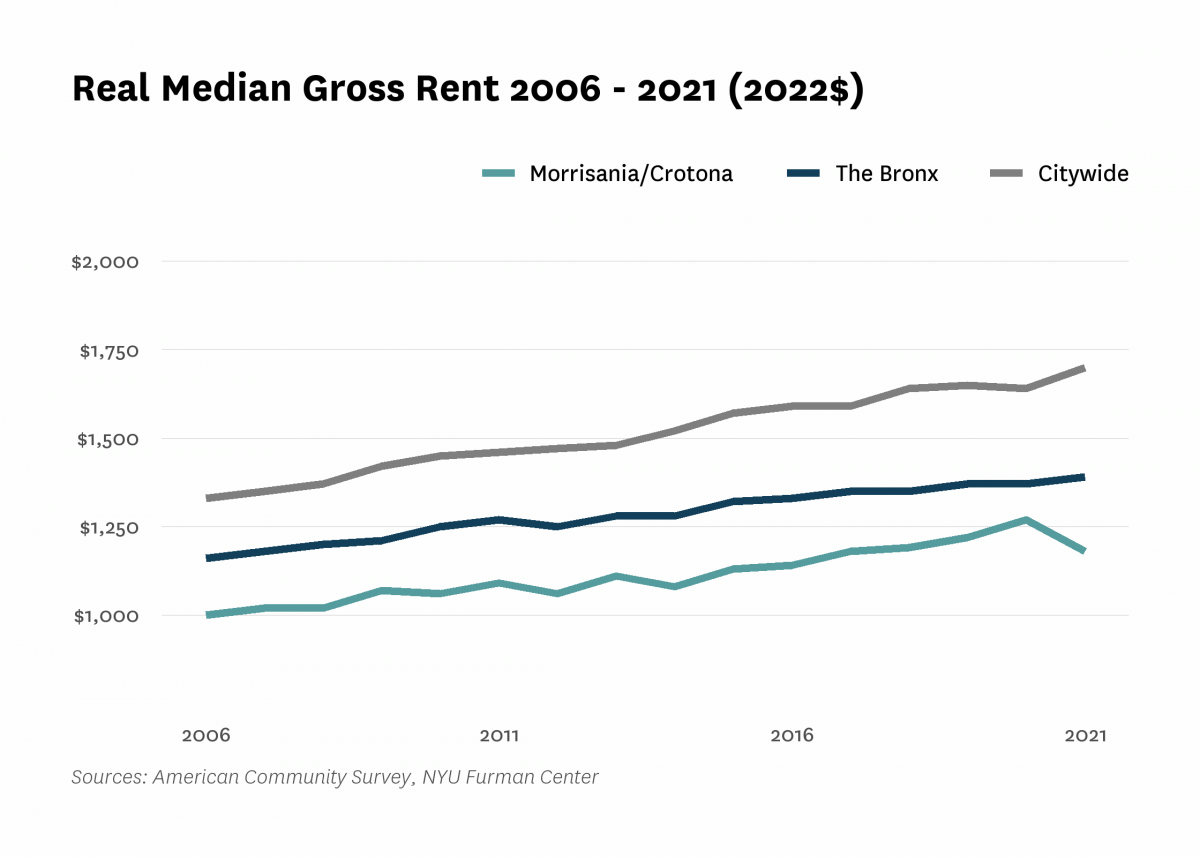
| Median rent, all (2022$) info | $820 | $1,000 | $1,060 | $1,220 | $1,180 | |
| Median rent, recent movers (2022$) info | $1,270 | $1,280 | $1,340 | |||
| Median rent, studios and 1-bedrooms (2022$) info | $860 | $1,030 | $1,050 | |||
| Change in collected rent (2019-2020) | 1.8% | |||||
| Affordability | ||||||
| Rental units affordable at 30% AMI (% of recently available units) | 20.2% | 27.0% | 21.5% | |||
| Rental units affordable at 80% AMI (% of recently available units) | 85.8% | 92.2% | 93.1% | |||
| Rental units affordable at 120% AMI (% of recently available units) | 99.7% | 99.8% | 99.1% | |||
| Rent Burden | ||||||
| Moderately rent-burdened households info | 26.3% | 25.0% | 26.2% | 25.9% | ||
| Moderately rent-burdened households, low income info | 27.7% | 27.0% | 27.5% | |||
| Moderately rent-burdened households, moderate income info | 2.8% | 2.5% | 0.6% | |||
| Severely rent-burdened households info | 30.5% | 35.8% | 36.2% | 36.8% | ||
| Severely rent-burdened households, low income info | 39.4% | 43.0% | 42.0% | |||
| Severely rent-burdened households, moderate income info | 0.0% | 0.0% | 0.0% | |||
| Rental Subsidy | ||||||
| Housing choice vouchers (% of occupied, privately owned rental units) info | 22.0% | 18.4% | ||||
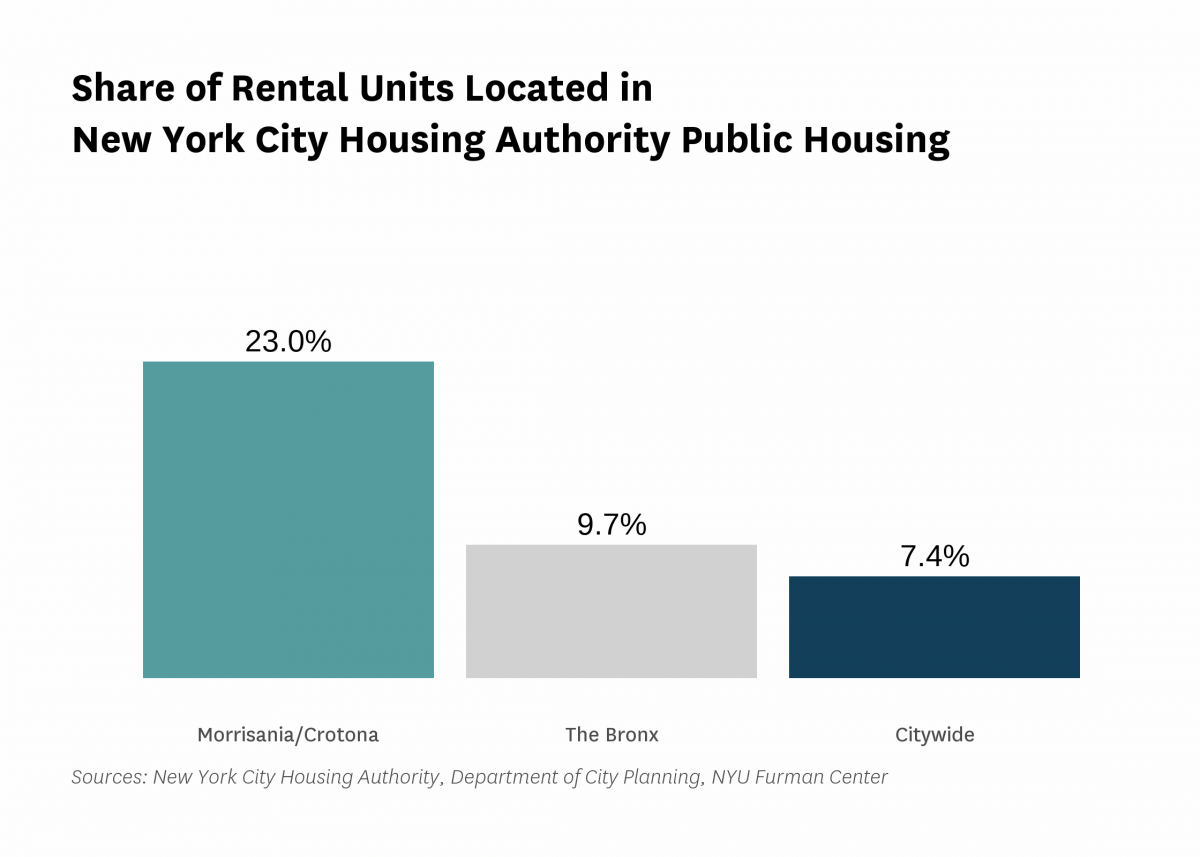
| Public housing (% of rental units) info | 23.0% | |||||

Data Notes: Community districts BX03 and BX06 both fall within sub-borough area 202. Data reported at the sub-borough level are identical. See CoreData User Guide for more information about indicator definitions and methods.
Indicators: The rental vacancy rate, severe crowding rate, and the severely rent-burdened households indicators use five-year American Community Survey (ACS) estimates. Data under the 2010 heading comes from the 2006 – 2010 ACS, data under the 2019 heading comes from the 2015 – 2019 ACS and data under the 2021 heading comes from 2017 – 2021 ACS .
All content © 2005 – 2024 Furman Center for Real Estate and Urban Policy | Top of page | Contact Us