| Indicator | 2000 | 2006 | 2010 | 2019 | 2021 | 2022 |
|---|---|---|---|---|---|---|
| Population | ||||||
| Born in New York State | 60.0% | 50.7% | 50.7% | 57.5% | ||
| Disabled population | 9.1% | 11.4% | 11.3% | |||
| Foreign-born population | 30.8% | 29.3% | 38.5% | 32.1% | 31.6% | |
| Population | 119,960 | 121,465 | 123,655 | 125,155 | 137,755 | |
| Population aged 65+ | 15.0% | 15.4% | 13.6% | 15.5% | 13.5% | |
| Households | ||||||
| Households with children under 18 years old | 35.7% | 37.5% | 37.1% | 29.4% | 33.9% | |
| Single-person households | 30.9% | 30.0% | 30.2% | 28.8% | ||
| Race and Ethnicity | ||||||
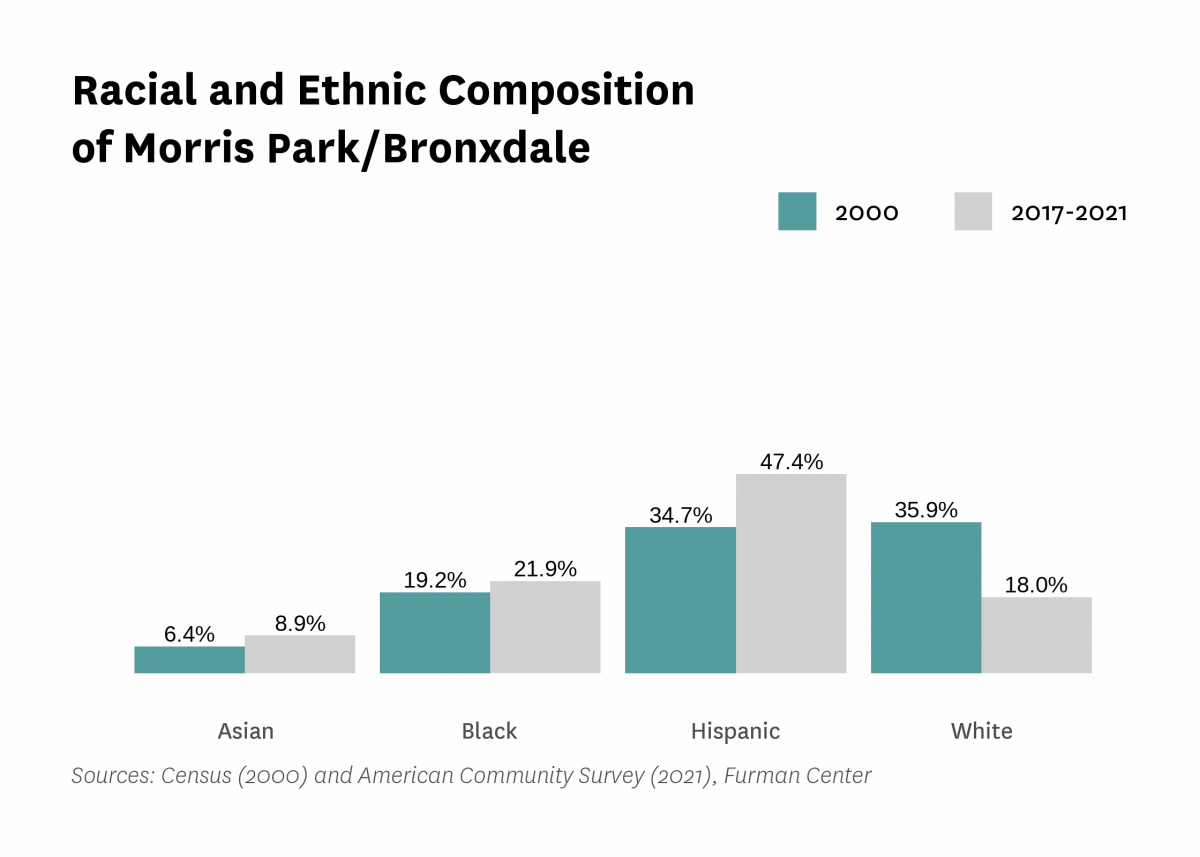
| Percent Asian | 6.4% | 6.4% | 9.0% | 9.8% | 8.9% | |
| Percent Black | 19.2% | 18.5% | 19.8% | 23.4% | 21.9% | |
| Percent Hispanic | 34.7% | 41.0% | 42.4% | 47.4% | 47.4% | |
| Percent white | 35.9% | 32.8% | 26.6% | 16.6% | 18.0% | |
| Racial diversity index | 0.71 | 0.69 | 0.70 | 0.68 | 0.69 | |
| Income and Poverty | ||||||
| Income diversity ratio | 4.8 | 5.8 | 4.1 | 5.3 | ||
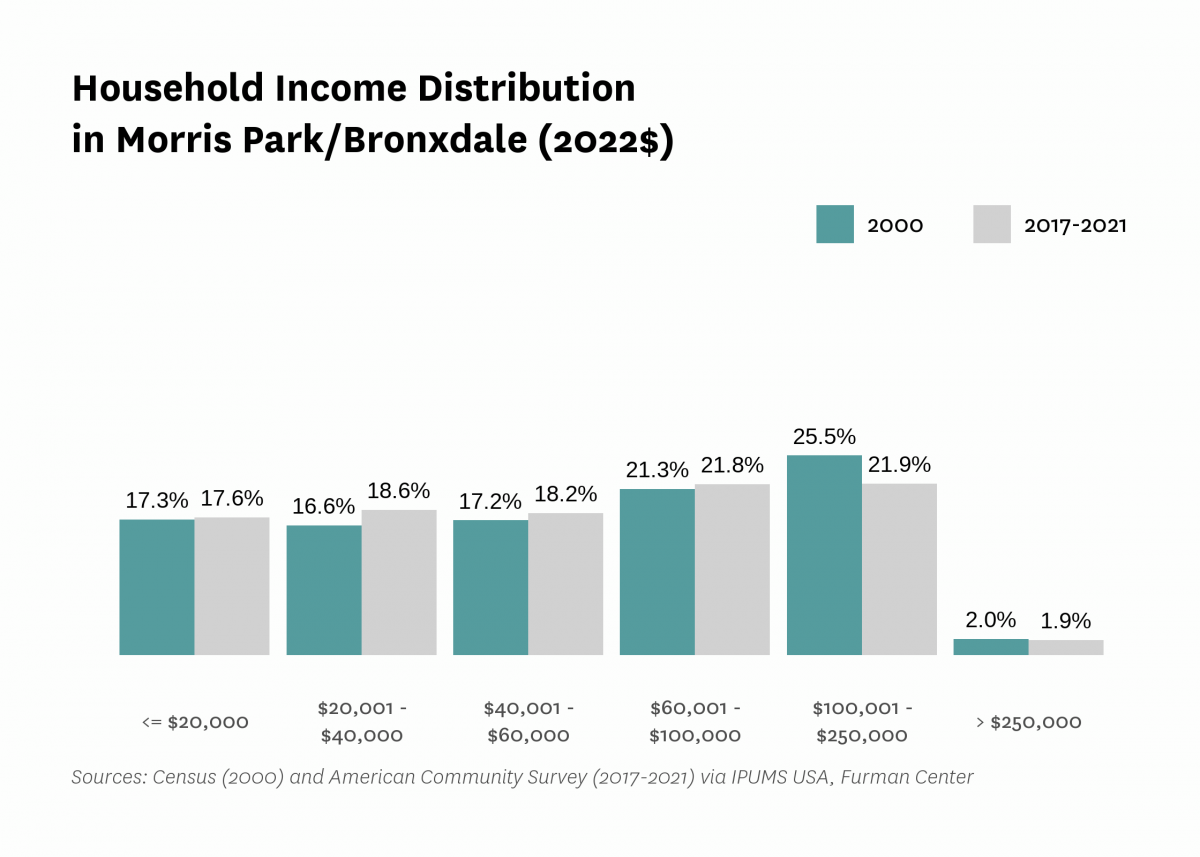
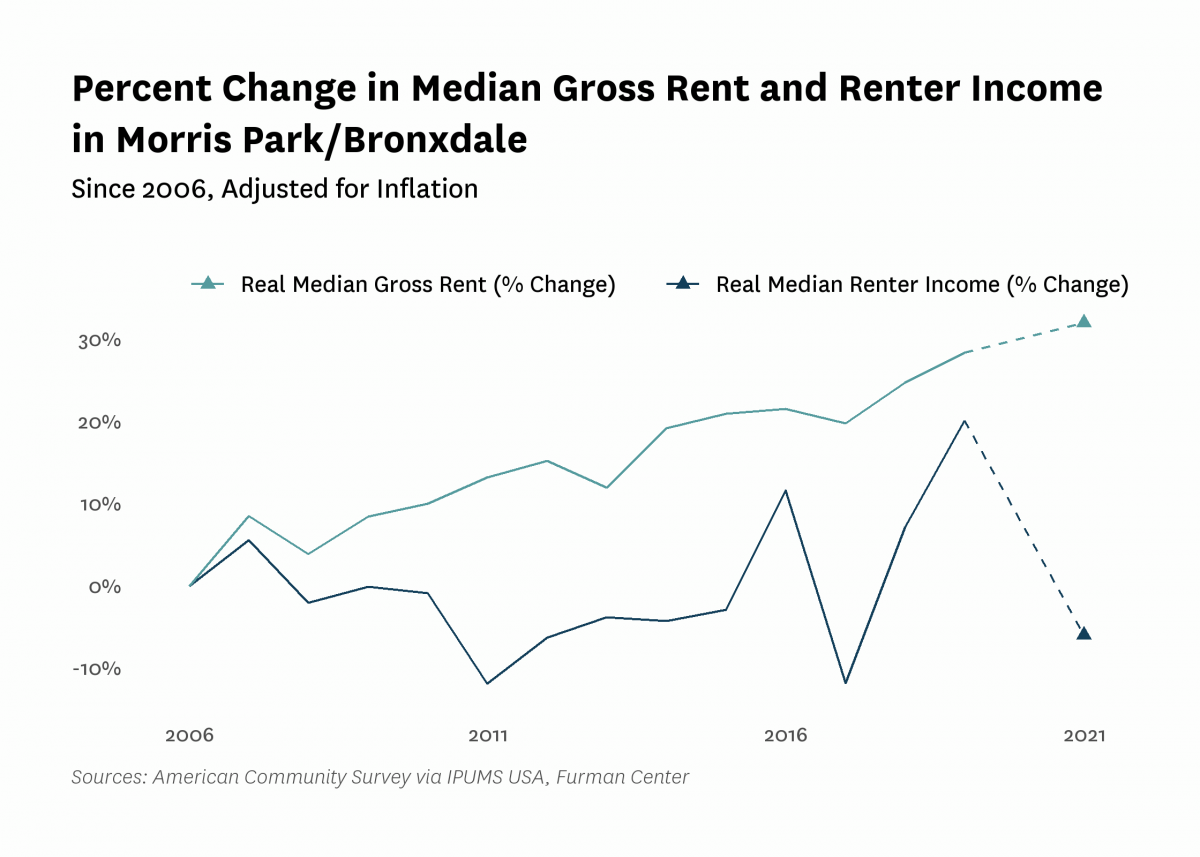
| Median household income (2022$) | $61,330 | $59,170 | $56,160 | $64,890 | $60,900 | |
| Median household income, homeowners (2022$) | $91,030 | $97,510 | $100,600 | $106,450 | ||
| Median household income, renters (2022$) | $46,470 | $46,060 | $55,820 | $43,690 | ||
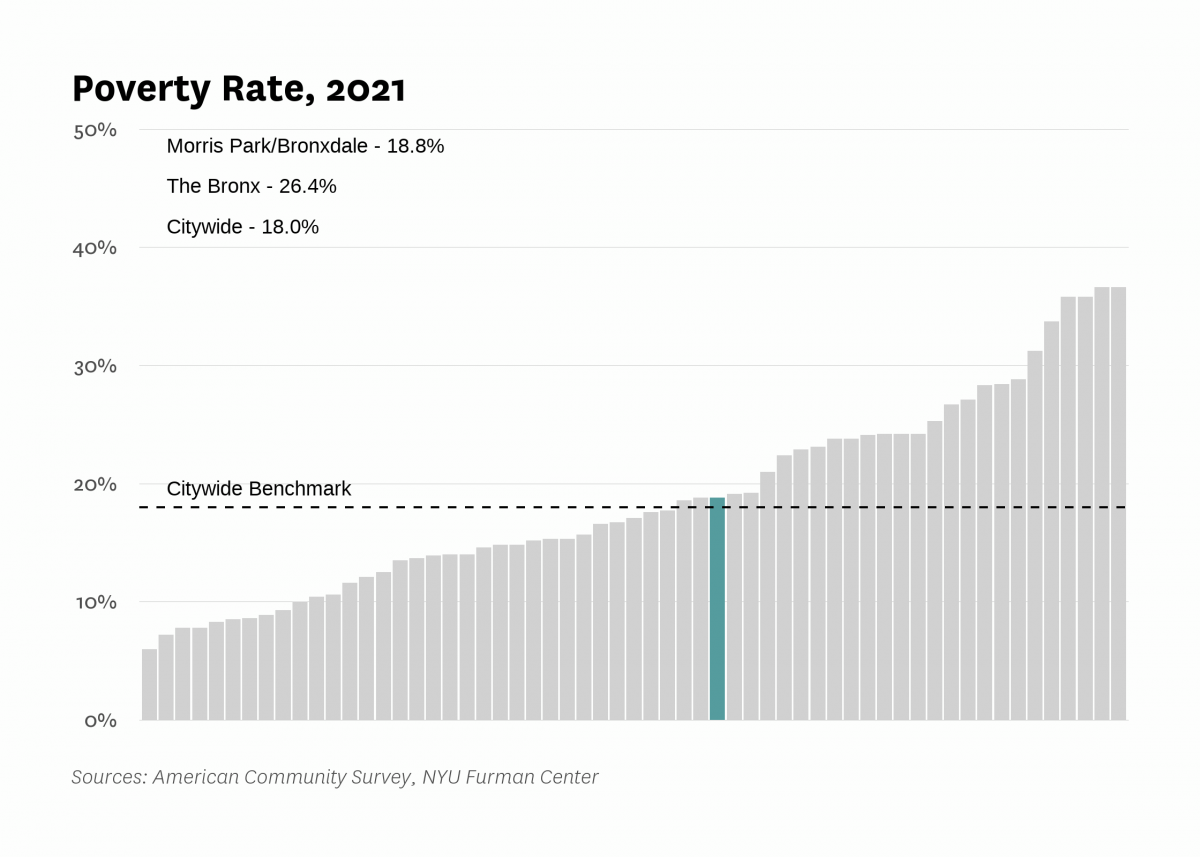
| Poverty rate | 17.5% | 17.8% | 21.1% | 14.6% | 18.8% | |
| Poverty rate, population aged 65+ | 18.7% | 25.2% | 19.5% | 15.8% | ||
| Poverty rate, population under 18 years old | 23.0% | 29.3% | 19.0% | 29.1% | ||
| Labor Market | ||||||
| Labor force participation rate | 56.7% | 60.2% | 62.0% | 59.3% | ||
| Population aged 25+ without a high school diploma | 25.2% | 24.6% | 19.1% | 18.3% | ||
| Unemployment rate | 8.78% | 8.16% | 13.85% | 8.09% | 14.53% | |
| Indicator | 2000 | 2006 | 2010 | 2019 | 2021 | 2022 |
|---|---|---|---|---|---|---|
| Housing Stock | ||||||
| Homeownership rate | 27.8% | 32.1% | 31.9% | 29.4% | 30.6% | |
| Housing units | 46,902 | 46,019 | 47,069 | 53,277 | ||
| Rental vacancy rate | 3.3% | 2.5% | 3.0% | |||
| Serious housing code violations (per 1,000 privately owned rental units) | 44.7 | 65.1 | 83.0 | 96.3 | 131.4 | |
| Severe crowding rate (% of renter households) | 4.2% | 5.8% | 4.2% | |||
| Total housing code violations (per 1,000 privately owned rental units) | 225.6 | 273.0 | 308.4 | 396.8 | 446.7 | |
| Finance - Distress | ||||||
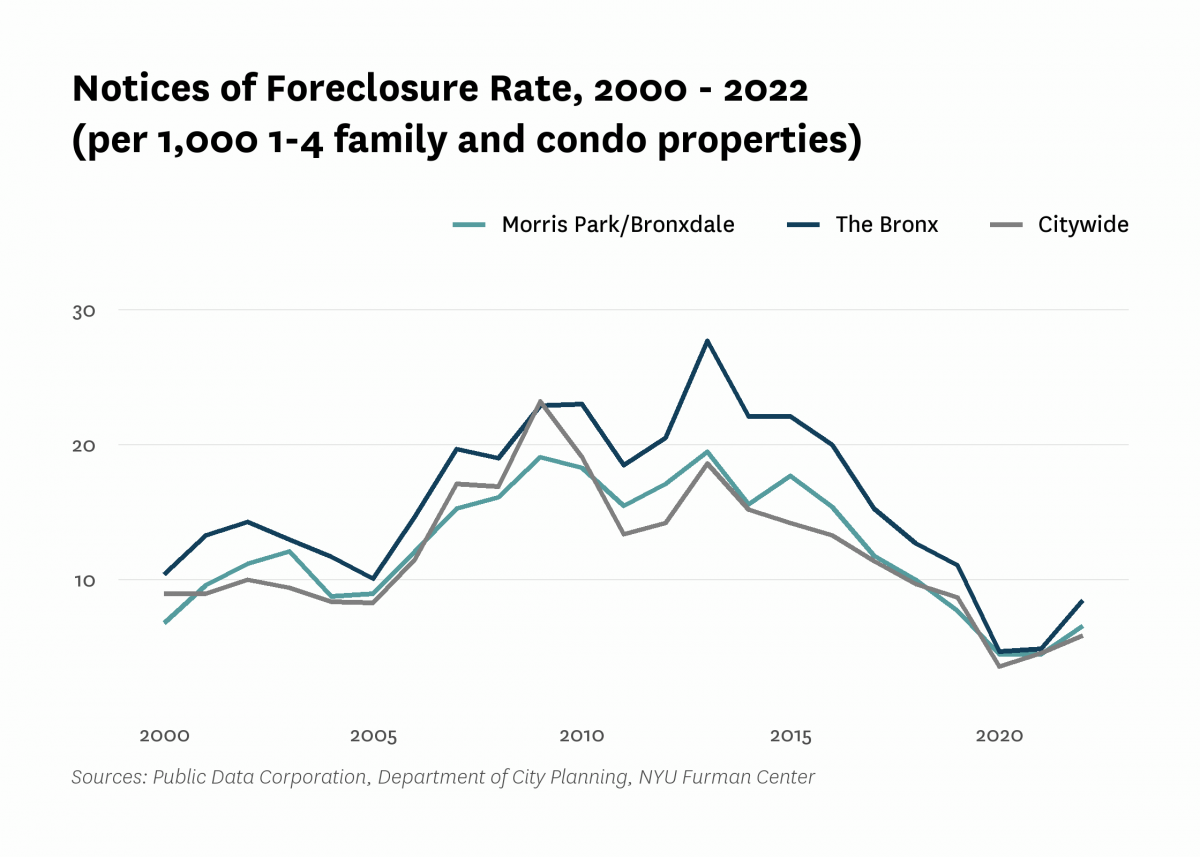
| Notices of foreclosure rate (per 1,000 1-4 family and condo properties) | 6.8 | 12.1 | 18.3 | 7.7 | 4.5 | 6.6 |
| Notices of foreclosure, all residential properties | 79 | 139 | 209 | 88 | 53 | 74 |
| Notices of foreclosure, initial, 1-4 family and condo properties | 60 | 100 | 150 | 36 | 15 | 35 |
| Notices of foreclosure, repeat, 1-4 family and condo properties | 13 | 32 | 50 | 49 | 34 | 37 |
| Pre-foreclosure notice rate (per 1,000 1-4 family and condo properties) | 90.5 | 32.4 | 72.4 | |||
| Pre-foreclosure notices, 1-4 family and condo properties | 994 | 356 | 794 | |||
| Properties entering REO, 1-4 family | 12 | 2 | 11 | |||
| Finance - Lending | ||||||
| FHA/VA-backed home purchase loans (% of home purchase loans) | 0.4% | 44.2% | 20.9% | 24.1% | ||
| Higher-cost home purchase loans (% of home purchase loans) | 33.8% | 1.7% | 9.4% | 6.9% | ||
| Higher-cost refinance loans (% of refinance loans) | 36.3% | 3.4% | 4.7% | 1.2% | ||
| Home purchase loan rate (per 1,000 properties) | 49.4 | 15.5 | 20.5 | 28.5 | ||
| Home purchase loans in LMI tracts (% of home purchase loans) | 48.5% | 14.0% | 50.0% | 47.1% | ||
| Home purchase loans to LMI borrowers (% of home purchase loans) | 7.8% | 48.3% | 13.9% | 12.9% | ||
| Refinance loan rate (per 1,000 properties) | 58.3 | 14.9 | 17.5 | 43.7 | ||
| Sales - Volume | ||||||
| Sales volume, 1 family building | 164 | 197 | 88 | 112 | 151 | 150 |
| Sales volume, 2-4 family building | 252 | 418 | 135 | 169 | 187 | 231 |
| Sales volume, 5+ family building | 6 | 20 | 17 | 3 | 10 | 8 |
| Sales volume, condominium | 25 | 15 | 9 | 8 | 17 | 11 |
| Sales volume, all property types | 447 | 650 | 249 | 292 | 365 | 400 |
| Sales - Median Prices | ||||||
| Median sales price per unit, 1 family building (2022$) | $378,370 | $612,690 | $494,770 | $612,670 | $641,920 | $639,500 |
| Median sales price per unit, 2-4 family building (2022$) | $203,080 | $343,670 | $251,090 | $334,490 | $363,400 | $362,500 |
| Median sales price per unit, 5+ family building (2022$) | $116,410 | $139,540 | $120,970 | $167,240 | $166,710 | $182,730 |
| Median sales price per unit, condominium (2022$) | $127,460 | $251,540 | $234,350 | $278,740 | $302,390 | $300,000 |
| Sales - Housing Price Index | ||||||
| Index of housing price appreciation, 1 family building | 100.0 | 204.6 | 177.4 | 237.1 | 280.2 | 279.1 |
| Index of housing price appreciation, 2-4 family building | 100.0 | 216.3 | 167.8 | 271.3 | 298.7 | 307.1 |
| Index of housing price appreciation, 5+ family building | 100.0 | 192.8 | 164.7 | 434.6 | 353.8 | 413.3 |
| Index of housing price appreciation, condominium | 100.0 | 235.1 | 237.5 | 391.4 | 425.7 | 364.5 |
| Index of housing price appreciation, all property types | 100.0 | 213.1 | 173.0 | 262.7 | 296.8 | 303.6 |
| Subsidized Housing | ||||||
| Total number of subsidized properties (properties) | 42 | |||||
| HUD Financing or Insurance (properties) | 2 | |||||
| HUD Financing or Insurance (units) | 0 | |||||
| HUD Project-based Rental Assistance Program (properties) | 4 | |||||
| HUD Project-based Rental Assistance Program (units) | 361 | |||||
| Low Income Housing Tax Credit (properties) | 7 | |||||
| Low Income Housing Tax Credit (units) | 1,884 | |||||
| Public Housing (properties) | 7 | |||||
| Public Housing (units) | 12,389 | |||||
| Mitchell-Lama (properties) | 2 | |||||
| Mitchell-Lama (units) | 172 | |||||
| 421-a Tax Exemption (properties) | 36 | |||||
| 421-a Tax Exemption (units) | 902 | |||||
| 420-c Tax Exemption (properties) | 3 | |||||
| 420-c Tax Exemption (units) | 277 | |||||
| NYC Housing Production Programs and Zoning Incentives or Requirements (properties) | 17 | |||||
| Eligible to expire from housing programs between 2023 and 2028 (properties) | 2 | |||||
| Eligible to expire from housing programs between 2023 and 2028 (units) | 153 | |||||
| Eligible to expire from housing programs between 2029 and 2038 (properties) | 4 | |||||
| Eligible to expire from housing programs between 2029 and 2038 (units) | 280 | |||||
| Eligible to expire from housing programs in 2039 and later (properties) | 4 | |||||
| Eligible to expire from housing programs in 2039 and later (units) | 208 | |||||
| Indicator | 2000 | 2006 | 2010 | 2019 | 2021 | 2022 |
|---|---|---|---|---|---|---|
| Density | ||||||
| Population density (1,000 persons per square mile) | 31.9 | 32.5 | 32.8 | 36.2 | ||
| Development | ||||||
| Units authorized by new residential building permits | 64 | 0 | 16 | 67 | 56 | 277 |
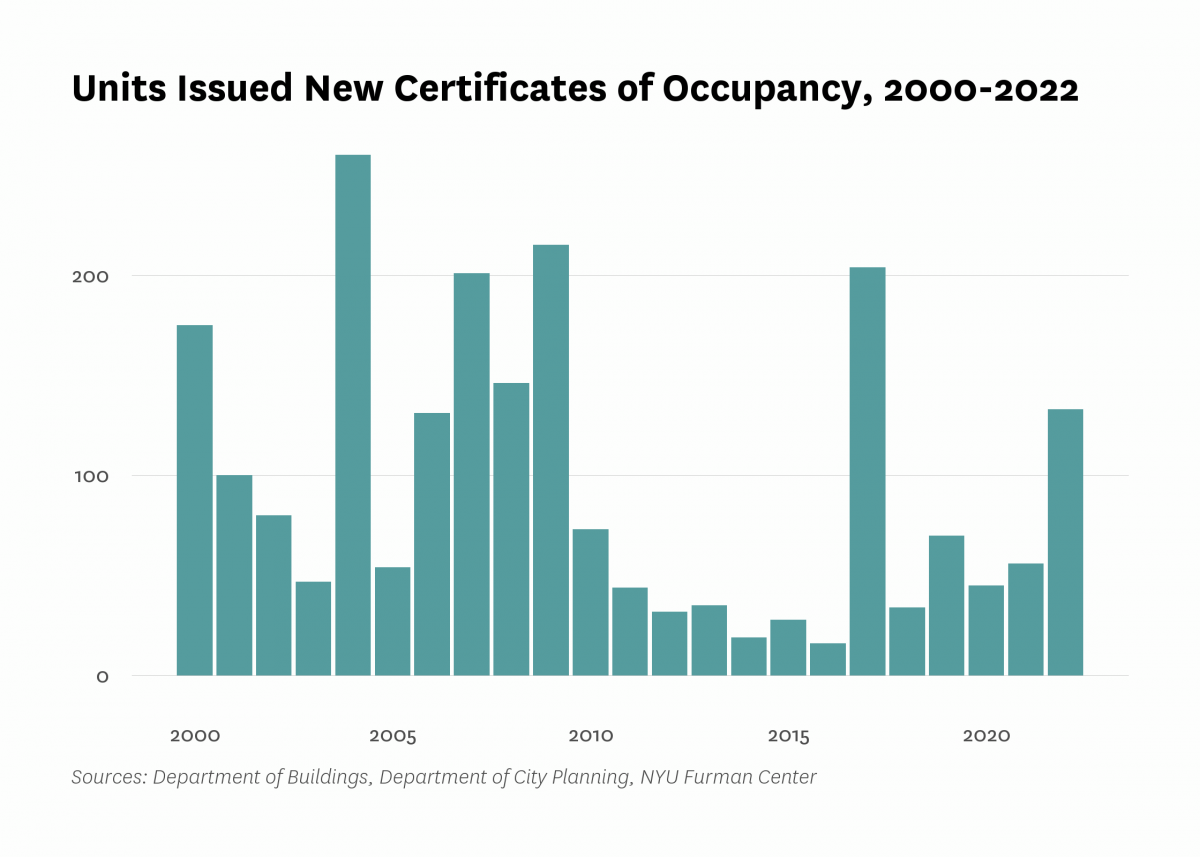
| Units issued new certificates of occupancy | 175 | 131 | 73 | 70 | 56 | 133 |
| Indicator | 2000 | 2006 | 2010 | 2019 | 2021 | 2022 |
|---|---|---|---|---|---|---|
| Commute | ||||||
| Car-free commute (% of commuters) | 51.9% | 56.0% | 60.9% | 63.1% | 54.6% | |
| Mean travel time to work (minutes) | 39.3 | 37.6 | 39.0 | 47.2 | 40.7 | |
| Crime and Incarceration | ||||||
| Serious crime rate (per 1,000 residents) | 15.3 | 14.3 | 9.7 | 11.4 | 13.6 | |
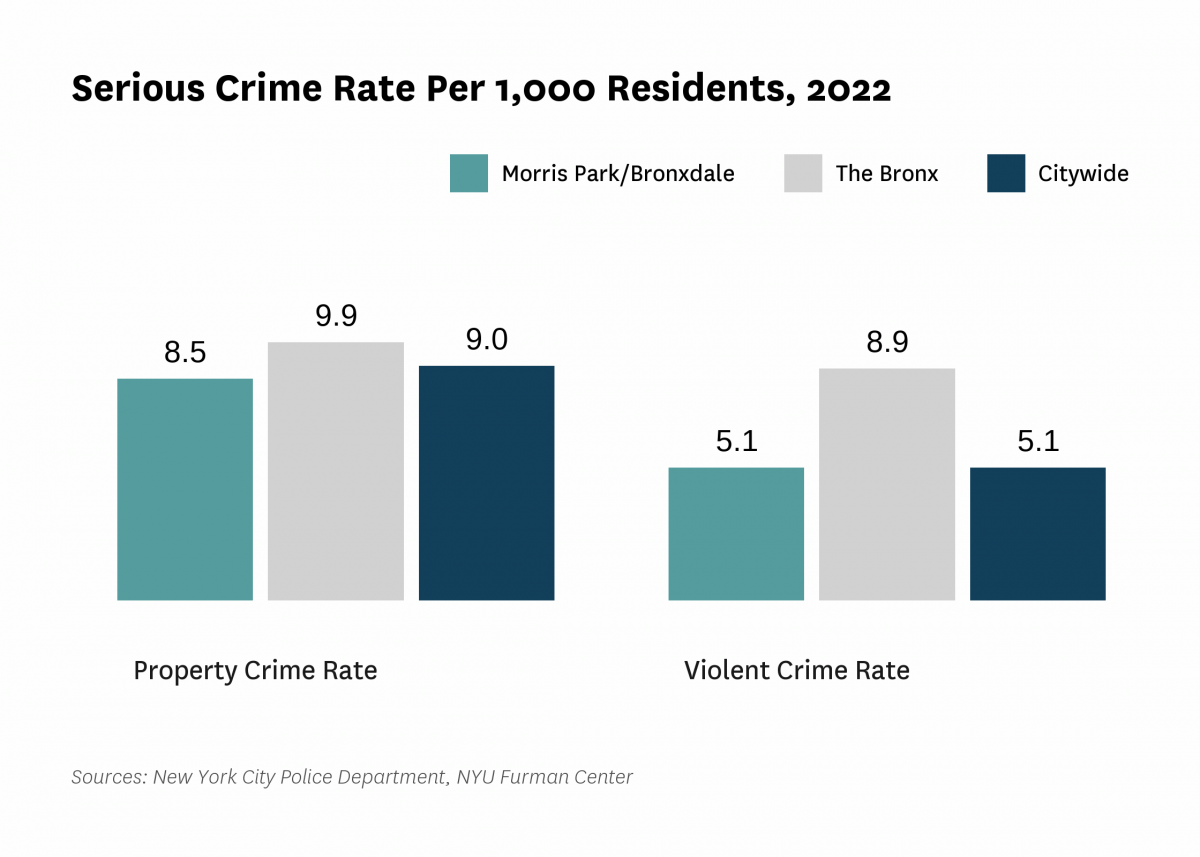
| Serious crime rate, property (per 1,000 residents) | 10.8 | 9.3 | 5.6 | 7.3 | 8.5 | |
| Serious crime rate, violent (per 1,000 residents) | 4.5 | 5.0 | 4.1 | 4.1 | 5.1 | |
| Schools | ||||||
| Students performing at grade level in English language arts, 4th grade | 36.6% | 30.4% | ||||
| Students performing at grade level in math, 4th grade | 37.4% | 31.3% | ||||
| Indicator | 2000 | 2006 | 2010 | 2019 | 2021 | 2022 |
|---|---|---|---|---|---|---|
| Median Rent | ||||||
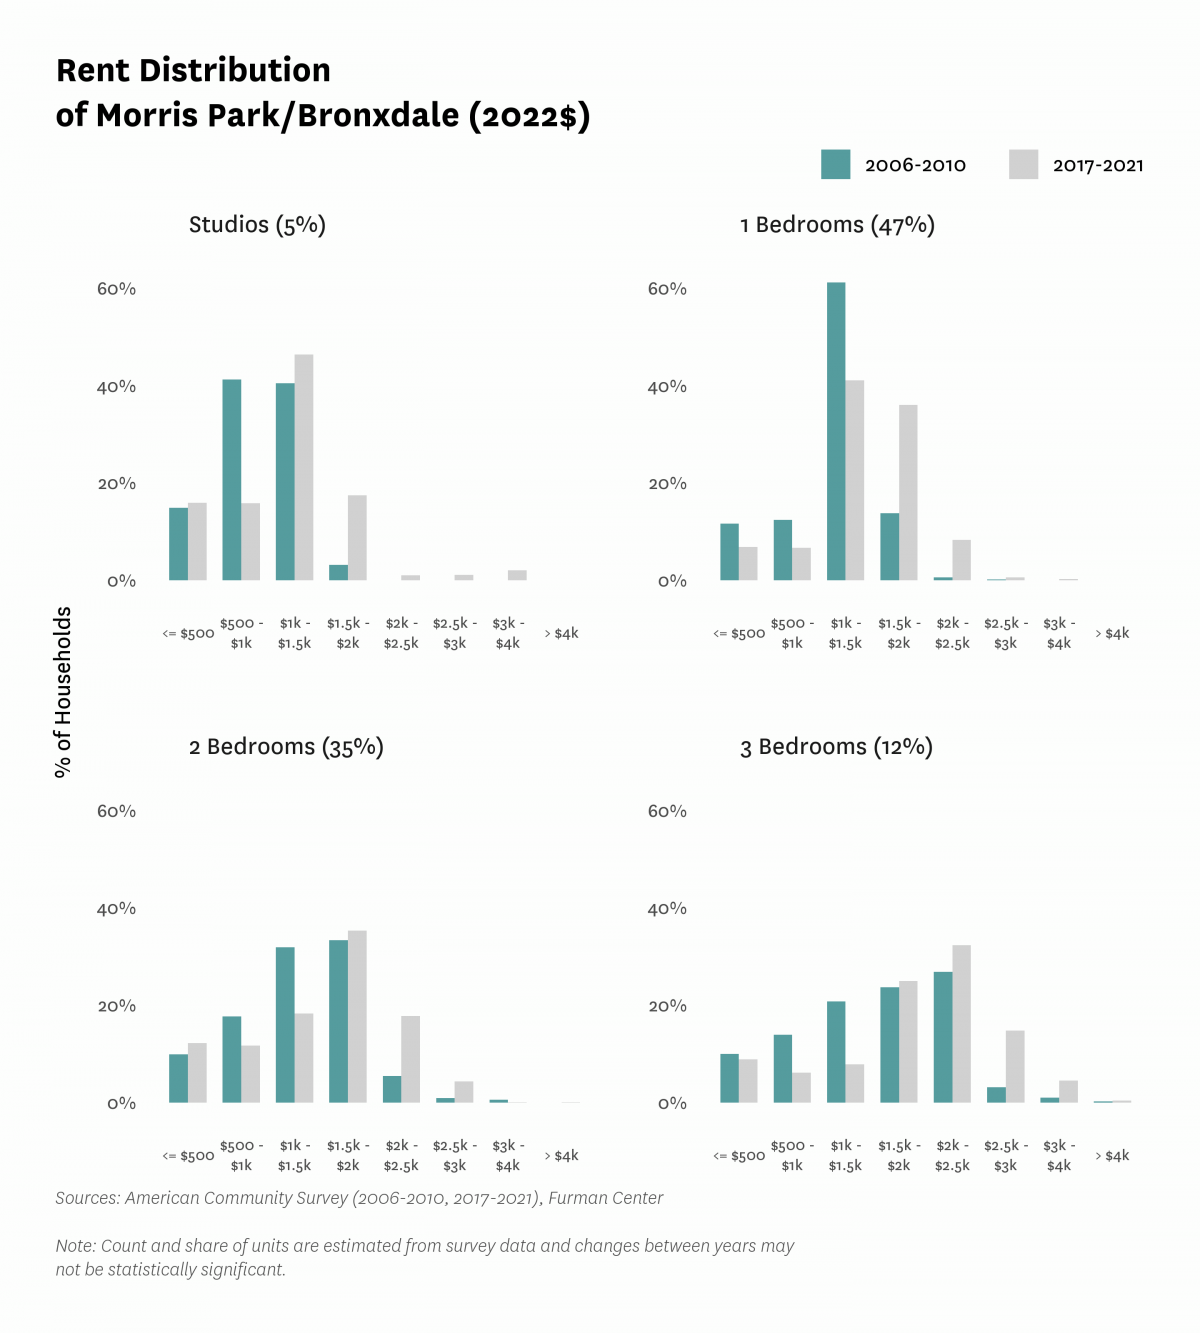
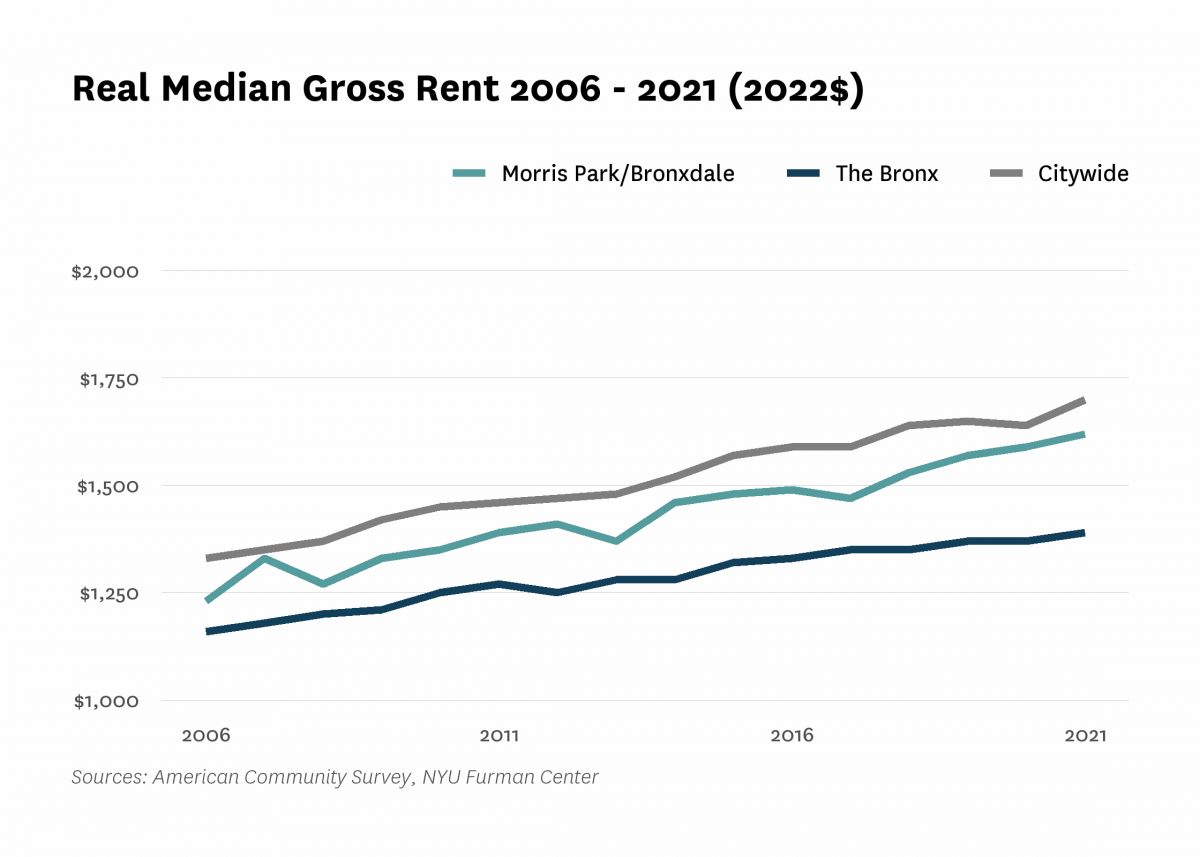
| Median rent, 2- and 3-bedrooms (2022$) | $1,460 | $1,620 | $1,770 | |||
| Median rent, all (2022$) | $1,180 | $1,230 | $1,350 | $1,570 | $1,620 | |
| Median rent, recent movers (2022$) | $1,440 | $1,560 | $1,770 | |||
| Median rent, studios and 1-bedrooms (2022$) | $1,230 | $1,380 | $1,440 | |||
| Change in collected rent (2019-2020) | 2.9% | |||||
| Affordability | ||||||
| Rental units affordable at 30% AMI (% of recently available units) | 5.9% | 6.2% | 9.8% | |||
| Rental units affordable at 80% AMI (% of recently available units) | 76.7% | 83.2% | 87.9% | |||
| Rental units affordable at 120% AMI (% of recently available units) | 98.6% | 98.7% | 98.5% | |||
| Rent Burden | ||||||
| Moderately rent-burdened households | 16.2% | 23.9% | 27.3% | 28.0% | ||
| Moderately rent-burdened households, low income | 25.4% | 35.3% | 34.0% | |||
| Moderately rent-burdened households, moderate income | 6.7% | 7.3% | 7.6% | |||
| Severely rent-burdened households | 23.3% | 29.4% | 31.9% | 31.6% | ||
| Severely rent-burdened households, low income | 45.0% | 40.5% | 41.8% | |||
| Severely rent-burdened households, moderate income | 0.0% | 0.0% | 0.0% | |||
| Rental Subsidy | ||||||
| Housing choice vouchers (% of occupied, privately owned rental units) | 10.2% | 8.0% | ||||
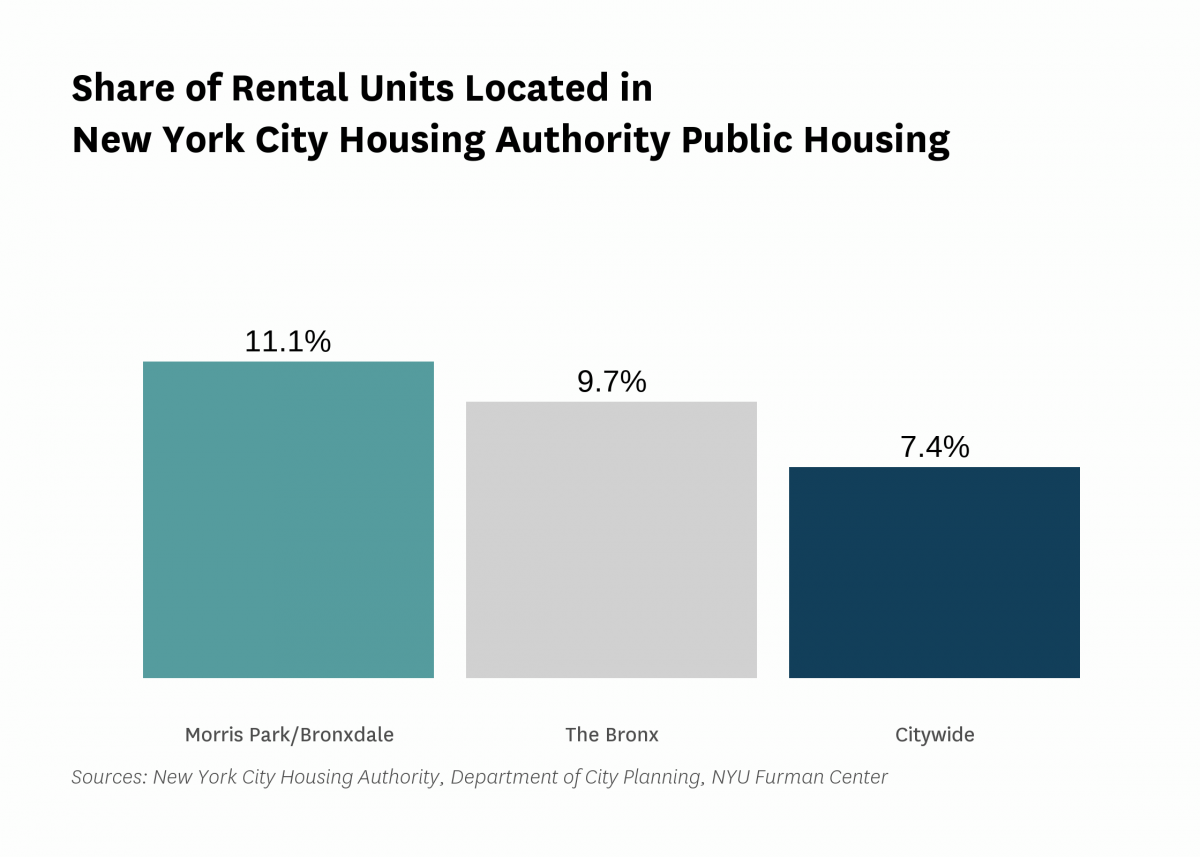
| Public housing (% of rental units) | 11.1% | |||||
Data Notes: See CoreData User Guide for more information about indicator definitions and methods.
Indicators: The rental vacancy rate, severe crowding rate, and the severely rent-burdened households indicators use five-year American Community Survey (ACS) estimates. Data under the 2010 heading comes from the 2006 – 2010 ACS, data under the 2019 heading comes from the 2015 – 2019 ACS and data under the 2021 heading comes from 2017 – 2021 ACS .
All content © 2005 – 2024 Furman Center for Real Estate and Urban Policy | Top of page | Contact Us