| Indicator | 2000 | 2006 | 2010 | 2019 | 2021 | 2022 |
|---|---|---|---|---|---|---|
| Population | ||||||
| Born in New York State | 37.9% | 39.6% | 39.5% | 39.4% | ||
| Disabled population | 9.7% | 7.6% | 7.9% | |||
| Foreign-born population | 35.0% | 34.1% | 32.6% | 33.1% | 30.4% | |
| Population | 129,533 | 122,736 | 138,048 | 132,837 | 118,426 | |
| Population aged 65+ | 10.0% | 13.3% | 10.9% | 14.0% | 14.8% | |
| Households | ||||||
| Households with children under 18 years old | 30.9% | 24.8% | 25.3% | 17.7% | 18.1% | |
| Single-person households | 44.3% | 37.2% | 38.3% | 47.5% | ||
| Race and Ethnicity | ||||||
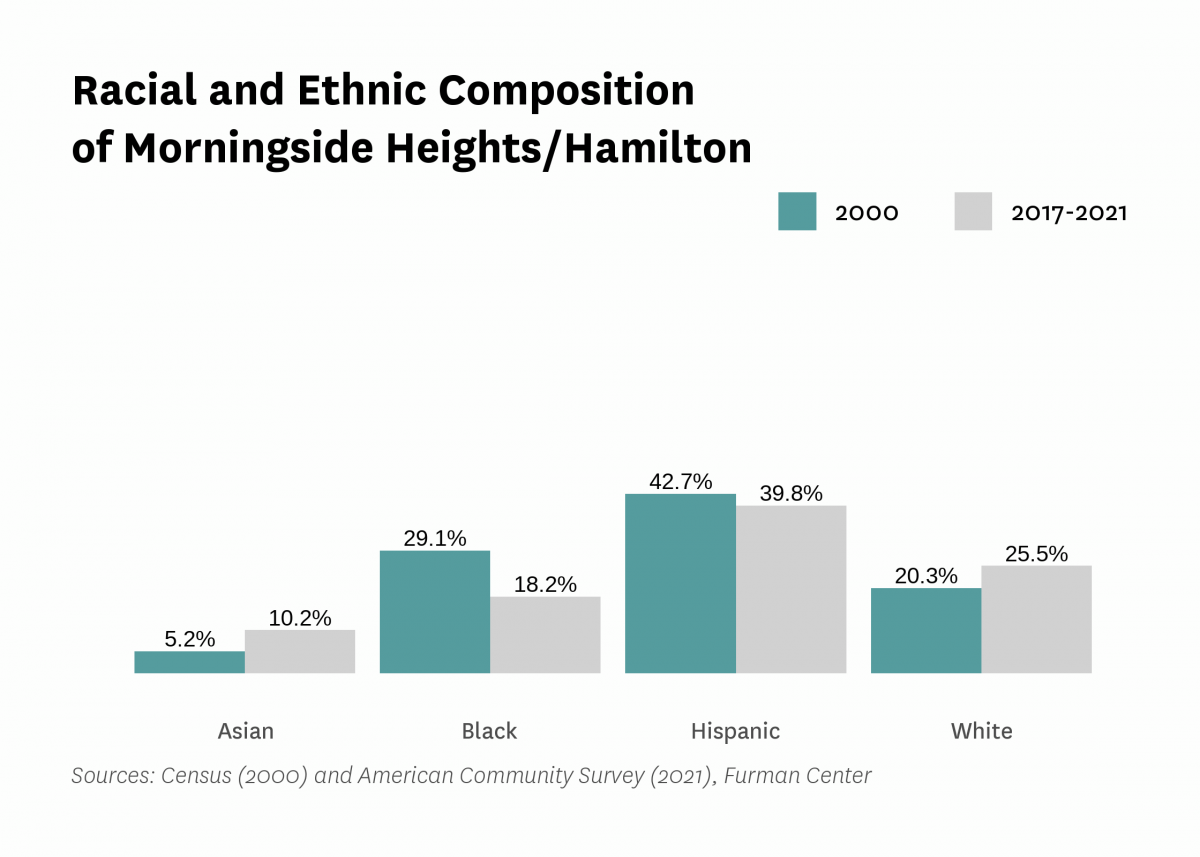
| Percent Asian | 5.2% | 5.9% | 7.4% | 8.9% | 10.2% | |
| Percent Black | 29.1% | 23.5% | 20.1% | 15.2% | 18.2% | |
| Percent Hispanic | 42.7% | 42.1% | 40.6% | 37.0% | 39.8% | |
| Percent white | 20.3% | 26.6% | 27.5% | 35.7% | 25.5% | |
| Racial diversity index | 0.69 | 0.69 | 0.71 | 0.70 | 0.73 | |
| Income and Poverty | ||||||
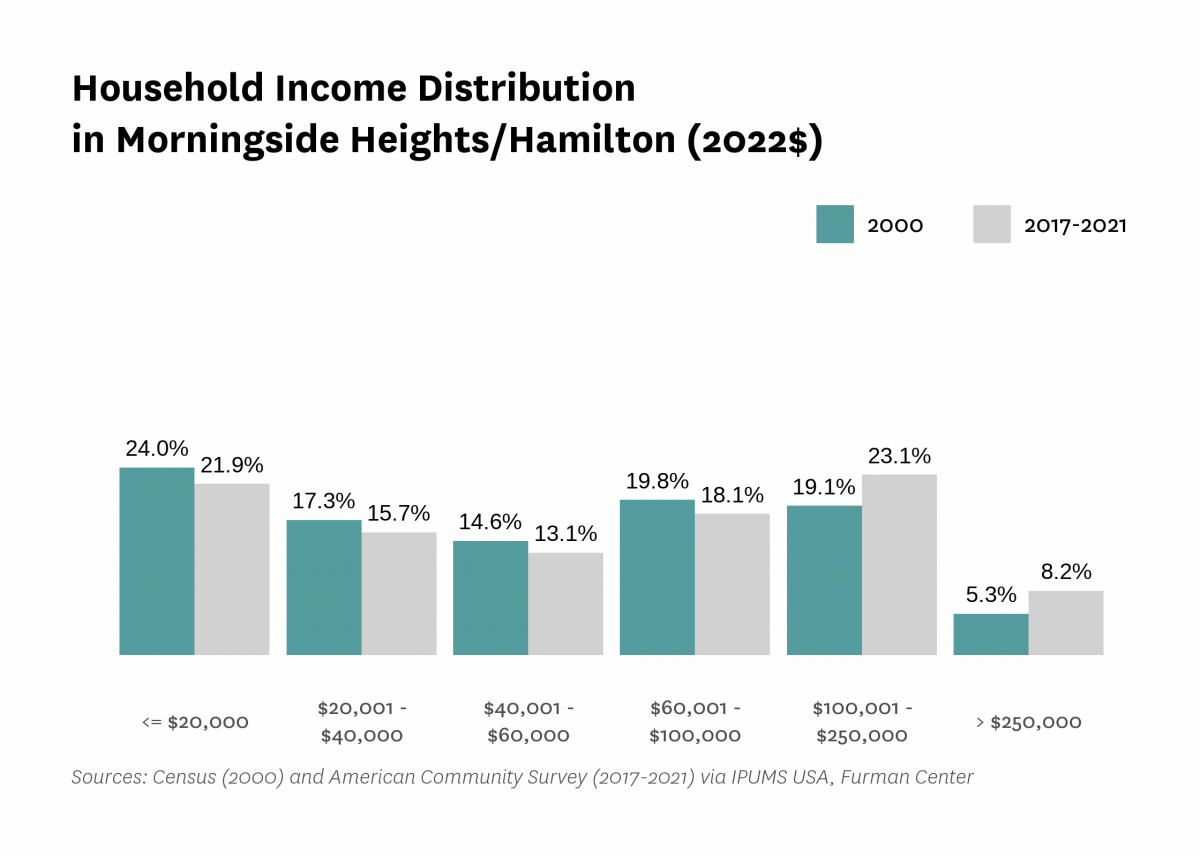
| Income diversity ratio | 8.3 | 9.3 | 8.8 | 9.3 | ||
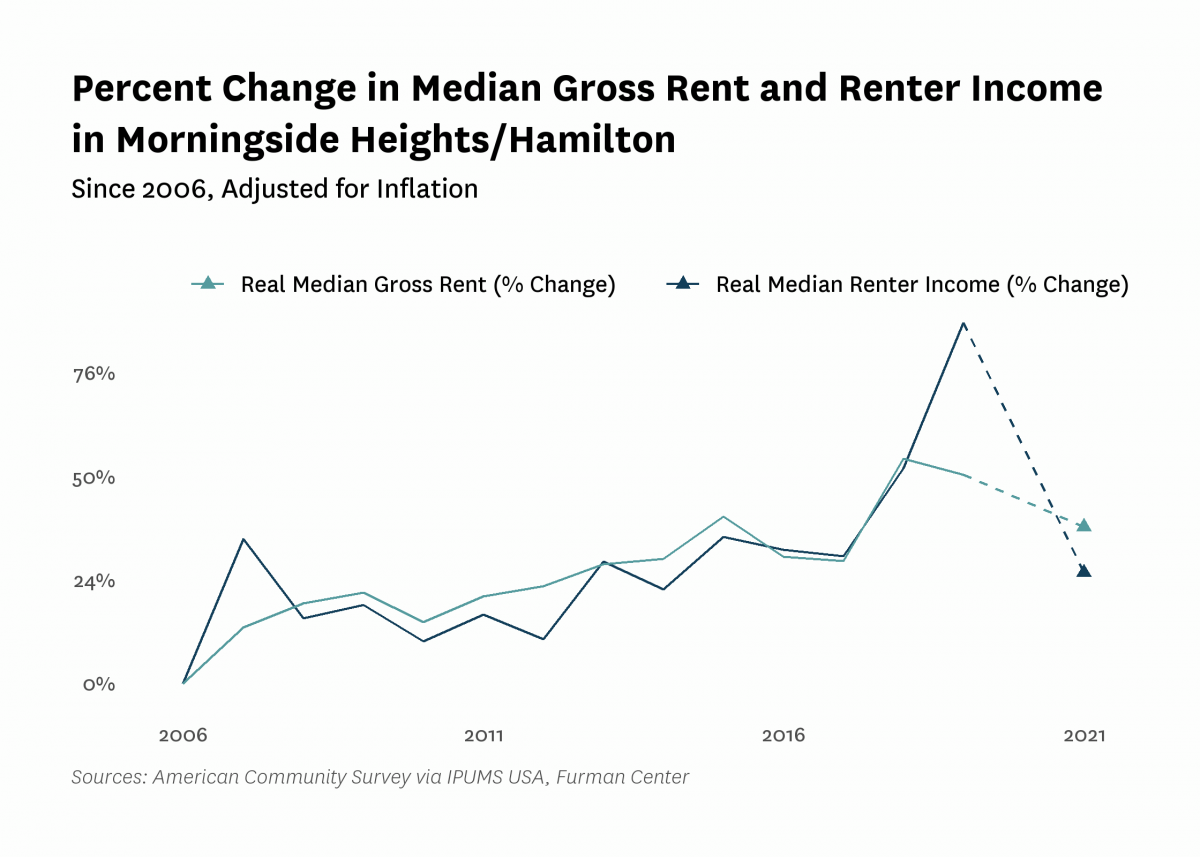
| Median household income (2022$) | $52,570 | $40,420 | $47,990 | $76,230 | $56,860 | |
| Median household income, homeowners (2022$) | $123,280 | $123,400 | $109,530 | $149,690 | ||
| Median household income, renters (2022$) | $35,790 | $39,450 | $66,990 | $45,390 | ||
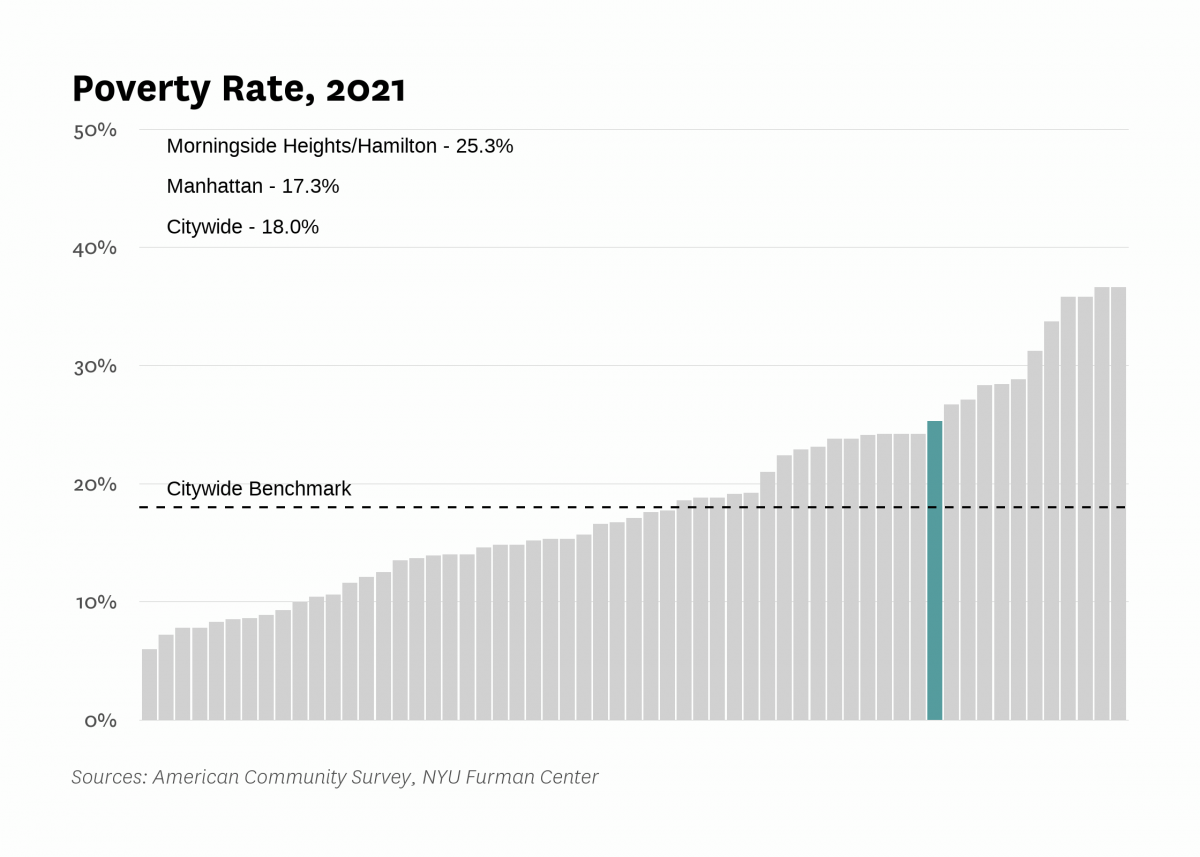
| Poverty rate | 30.1% | 27.3% | 28.7% | 19.6% | 25.3% | |
| Poverty rate, population aged 65+ | 32.3% | 29.0% | 28.0% | 21.0% | ||
| Poverty rate, population under 18 years old | 39.6% | 38.5% | 15.5% | 41.6% | ||
| Labor Market | ||||||
| Labor force participation rate | 56.5% | 56.0% | 69.9% | 64.1% | ||
| Population aged 25+ without a high school diploma | 23.0% | 21.7% | 18.4% | 13.2% | ||
| Unemployment rate | 16.46% | 8.09% | 9.43% | 6.79% | 14.77% | |
| Indicator | 2000 | 2006 | 2010 | 2019 | 2021 | 2022 |
|---|---|---|---|---|---|---|
| Housing Stock | ||||||
| Homeownership rate | 10.9% | 12.4% | 14.3% | 15.3% | 17.5% | |
| Housing units | 51,844 | 53,483 | 54,000 | 53,619 | ||
| Rental vacancy rate | 3.1% | 3.1% | 5.4% | |||
| Serious housing code violations (per 1,000 privately owned rental units) | 114.4 | 120.1 | 153.7 | 156.3 | 176.6 | |
| Severe crowding rate (% of renter households) | 3.1% | 4.2% | 3.4% | |||
| Total housing code violations (per 1,000 privately owned rental units) | 567.5 | 504.7 | 568.9 | 582.9 | 577.2 | |
| Finance - Distress | ||||||
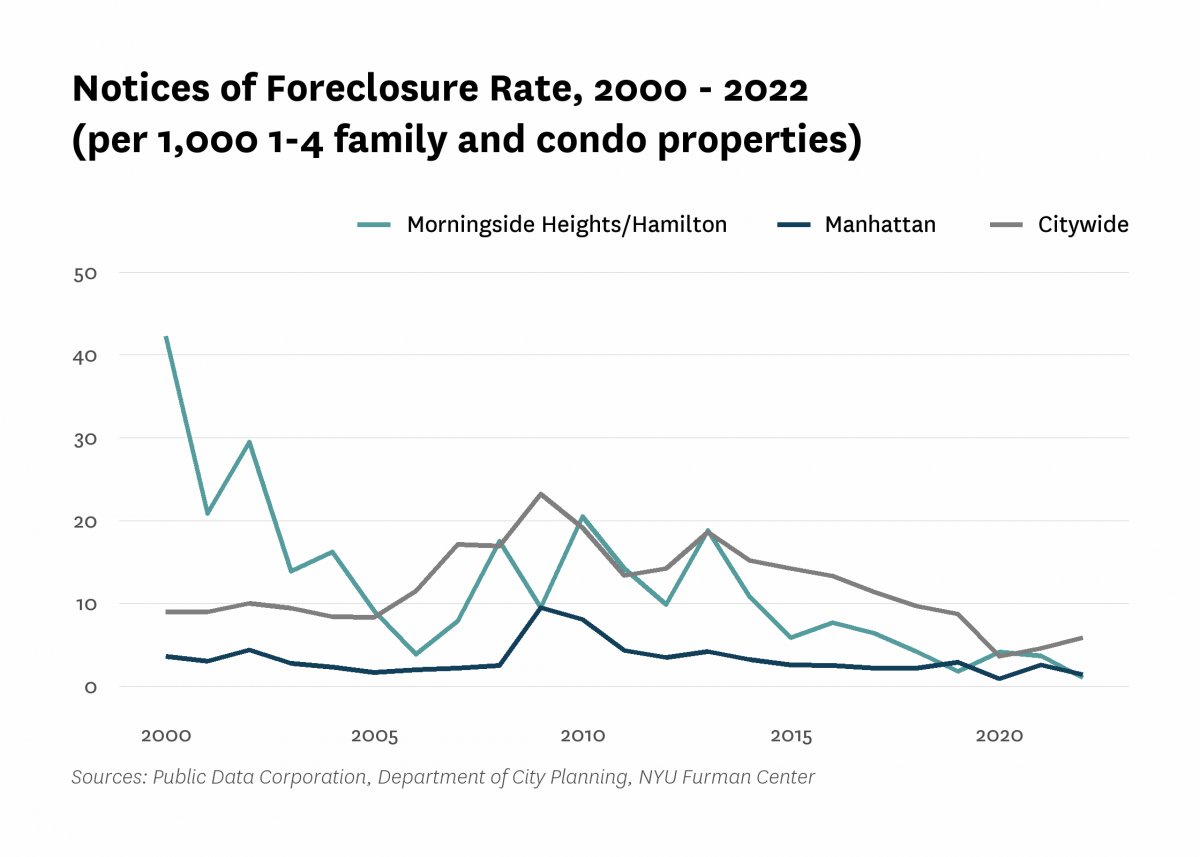
| Notices of foreclosure rate (per 1,000 1-4 family and condo properties) | 42.3 | 3.9 | 20.5 | 1.8 | 3.7 | 1.0 |
| Notices of foreclosure, all residential properties | 59 | 14 | 47 | 4 | 18 | 6 |
| Notices of foreclosure, initial, 1-4 family and condo properties | 21 | 4 | 28 | 1 | 3 | 1 |
| Notices of foreclosure, repeat, 1-4 family and condo properties | 7 | 0 | 0 | 2 | 4 | 1 |
| Pre-foreclosure notice rate (per 1,000 1-4 family and condo properties) | 26.5 | 14.9 | 32.5 | |||
| Pre-foreclosure notices, 1-4 family and condo properties | 44 | 29 | 64 | |||
| Properties entering REO, 1-4 family | 2 | 0 | 3 | |||
| Finance - Lending | ||||||
| FHA/VA-backed home purchase loans (% of home purchase loans) | 0.0% | 3.0% | 0.0% | 0.3% | ||
| Higher-cost home purchase loans (% of home purchase loans) | 2.3% | 0.5% | 1.0% | 0.6% | ||
| Higher-cost refinance loans (% of refinance loans) | 20.4% | 0.3% | 0.8% | 1.2% | ||
| Home purchase loan rate (per 1,000 properties) | 27.6 | 17.1 | 16.4 | 25.4 | ||
| Home purchase loans in LMI tracts (% of home purchase loans) | 65.8% | 5.0% | 47.5% | 43.1% | ||
| Home purchase loans to LMI borrowers (% of home purchase loans) | 2.6% | 60.9% | 3.5% | 6.3% | ||
| Refinance loan rate (per 1,000 properties) | 16.1 | 25.2 | 10.4 | 28.4 | ||
| Sales - Volume | ||||||
| Sales volume, 1 family building | 6 | 2 | 3 | 2 | 1 | 4 |
| Sales volume, 2-4 family building | 12 | 21 | 10 | 14 | 3 | 11 |
| Sales volume, 5+ family building | 14 | 78 | 28 | 15 | 10 | 15 |
| Sales volume, condominium | 0 | 64 | 45 | 44 | 118 | 93 |
| Sales volume, all property types | 32 | 165 | 86 | 75 | 132 | 123 |
| Sales - Median Prices | ||||||
| Median sales price per unit, 1 family building (2022$) | $416,350 | $4,331,720 | $1,545,140 | $3,205,500 | $3,342,230 | $2,436,250 |
| Median sales price per unit, 2-4 family building (2022$) | $237,920 | $512,040 | $544,180 | $929,130 | $782,510 | $708,330 |
| Median sales price per unit, 5+ family building (2022$) | $60,290 | $173,370 | $114,420 | $330,510 | $57,590 | $149,780 |
| Median sales price per unit, condominium (2022$) | $747,940 | $456,980 | $785,700 | $1,397,900 | $995,000 | |
| Sales - Housing Price Index | ||||||
| Index of housing price appreciation, 1 family building | 100.0 | 662.1 | 557.7 | |||
| Index of housing price appreciation, 2-4 family building | 100.0 | 382.1 | 240.1 | 456.7 | 340.2 | |
| Index of housing price appreciation, 5+ family building | 100.0 | 324.5 | 297.9 | 836.9 | 656.3 | 677.5 |
| Index of housing price appreciation, condominium | 100.0 | 62.0 | 60.3 | 104.6 | 99.5 | |
| Index of housing price appreciation, all property types | 100.0 | 323.5 | 280.6 | 589.5 | 558.6 | 537.2 |
| Subsidized Housing | ||||||
| Total number of subsidized properties (properties) | 406 | |||||
| HUD Financing or Insurance (properties) | 8 | |||||
| HUD Financing or Insurance (units) | 485 | |||||
| HUD Project-based Rental Assistance Program (properties) | 27 | |||||
| HUD Project-based Rental Assistance Program (units) | 1,595 | |||||
| Low Income Housing Tax Credit (properties) | 99 | |||||
| Low Income Housing Tax Credit (units) | 3,533 | |||||
| Public Housing (properties) | 4 | |||||
| Public Housing (units) | 3,381 | |||||
| Mitchell-Lama (properties) | 1 | |||||
| Mitchell-Lama (units) | 369 | |||||
| 421-a Tax Exemption (properties) | 17 | |||||
| 421-a Tax Exemption (units) | 1,586 | |||||
| 420-c Tax Exemption (properties) | 75 | |||||
| 420-c Tax Exemption (units) | 1,826 | |||||
| NYC Housing Production Programs and Zoning Incentives or Requirements (properties) | 165 | |||||
| Eligible to expire from housing programs between 2023 and 2028 (properties) | 21 | |||||
| Eligible to expire from housing programs between 2023 and 2028 (units) | 548 | |||||
| Eligible to expire from housing programs between 2029 and 2038 (properties) | 40 | |||||
| Eligible to expire from housing programs between 2029 and 2038 (units) | 1,295 | |||||
| Eligible to expire from housing programs in 2039 and later (properties) | 47 | |||||
| Eligible to expire from housing programs in 2039 and later (units) | 3,045 | |||||
| Indicator | 2000 | 2006 | 2010 | 2019 | 2021 | 2022 |
|---|---|---|---|---|---|---|
| Density | ||||||
| Population density (1,000 persons per square mile) | 72.8 | 81.9 | 78.8 | 70.3 | ||
| Development | ||||||
| Units authorized by new residential building permits | 2 | 0 | 0 | 102 | 238 | 421 |
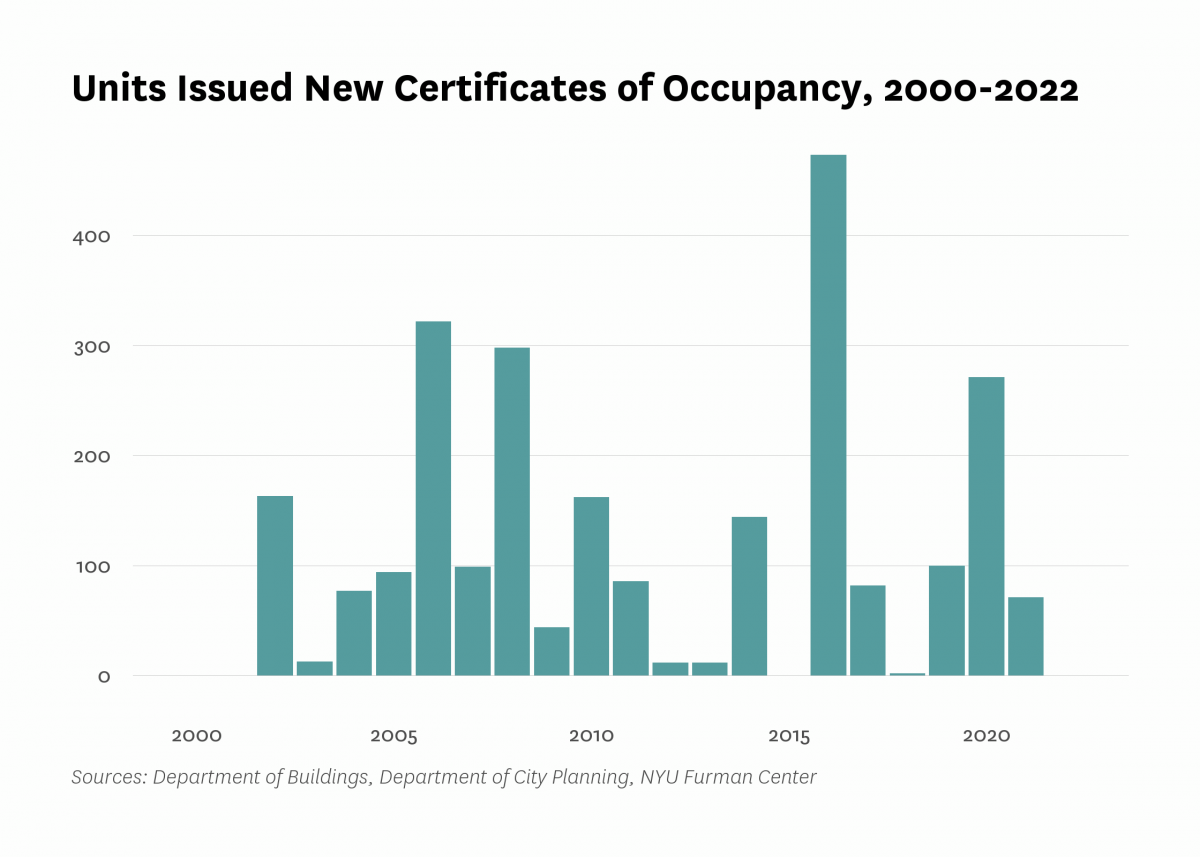
| Units issued new certificates of occupancy | 0 | 322 | 162 | 100 | 71 | 0 |
| Indicator | 2000 | 2006 | 2010 | 2019 | 2021 | 2022 |
|---|---|---|---|---|---|---|
| Commute | ||||||
| Car-free commute (% of commuters) | 84.3% | 89.6% | 90.2% | 93.6% | 89.0% | |
| Mean travel time to work (minutes) | 33.8 | 31.7 | 35.0 | 33.1 | 35.0 | |
| Crime and Incarceration | ||||||
| Serious crime rate (per 1,000 residents) | 15.5 | 12.7 | 12.6 | 12.8 | 14.5 | |
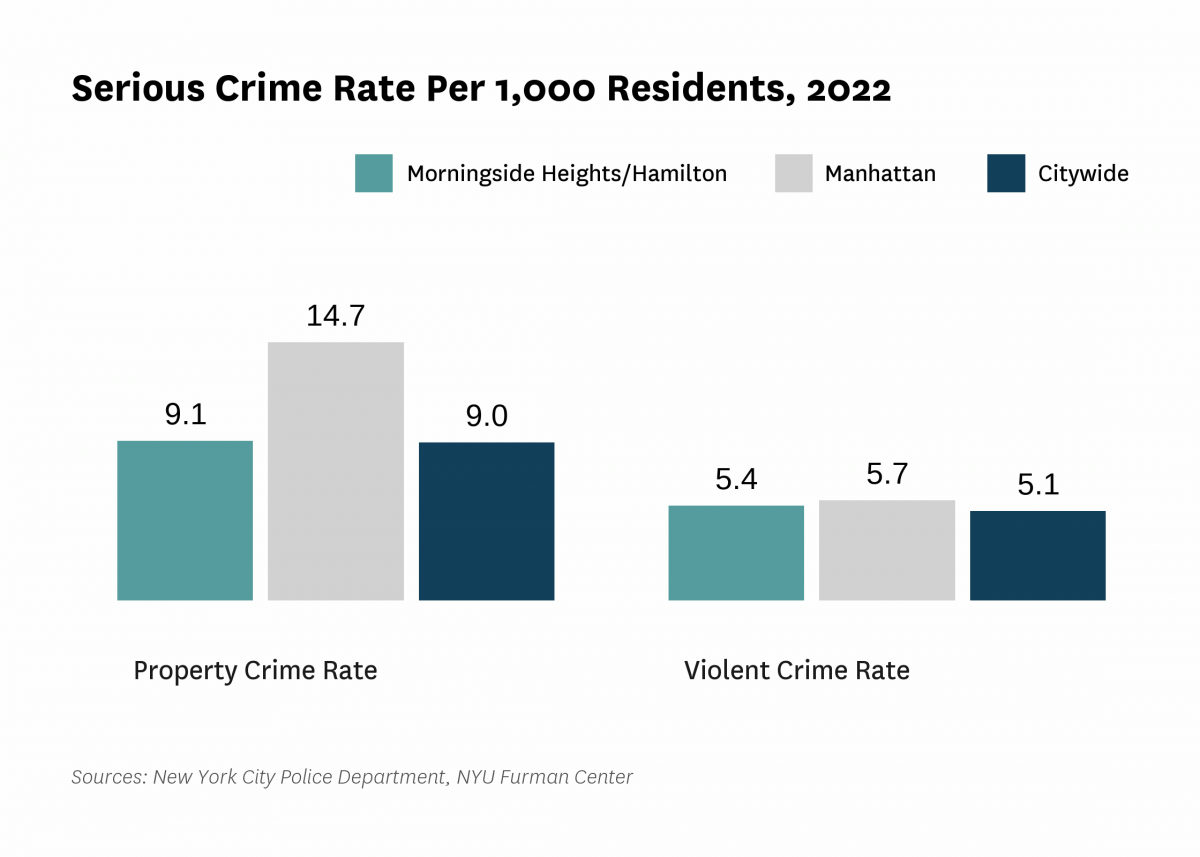
| Serious crime rate, property (per 1,000 residents) | 8.3 | 6.3 | 7.3 | 8.2 | 9.1 | |
| Serious crime rate, violent (per 1,000 residents) | 7.2 | 6.4 | 5.3 | 4.6 | 5.4 | |
| Schools | ||||||
| Students performing at grade level in English language arts, 4th grade | 36.8% | 28.6% | ||||
| Students performing at grade level in math, 4th grade | 36.9% | 24.3% | ||||
| Indicator | 2000 | 2006 | 2010 | 2019 | 2021 | 2022 |
|---|---|---|---|---|---|---|
| Median Rent | ||||||
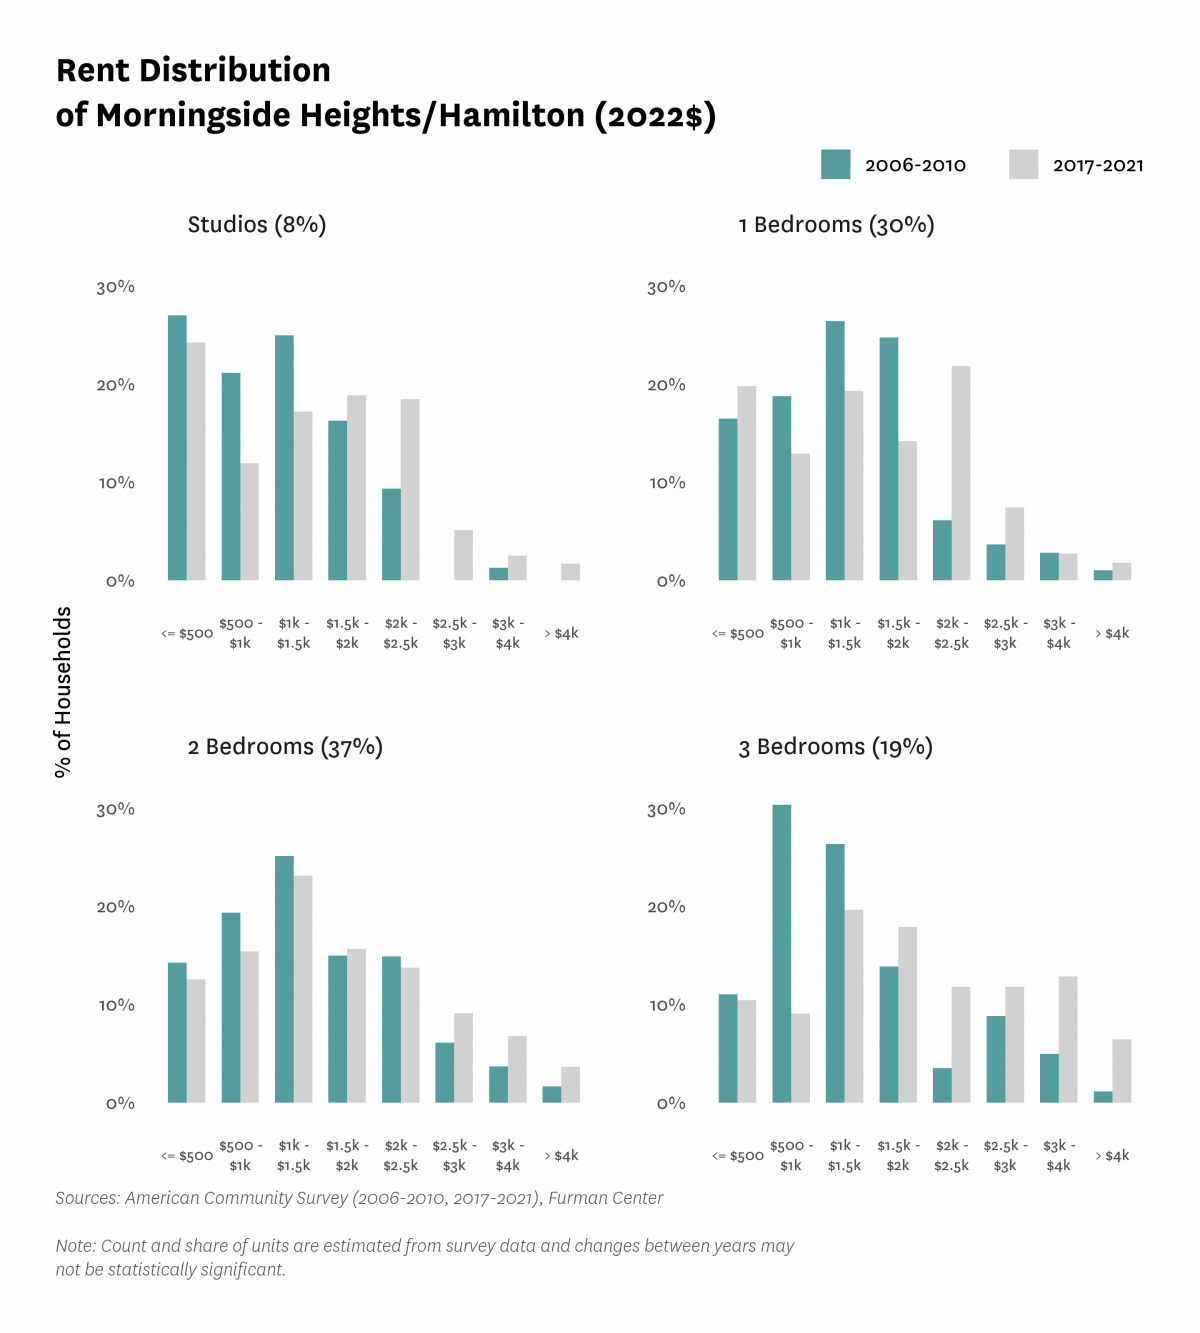
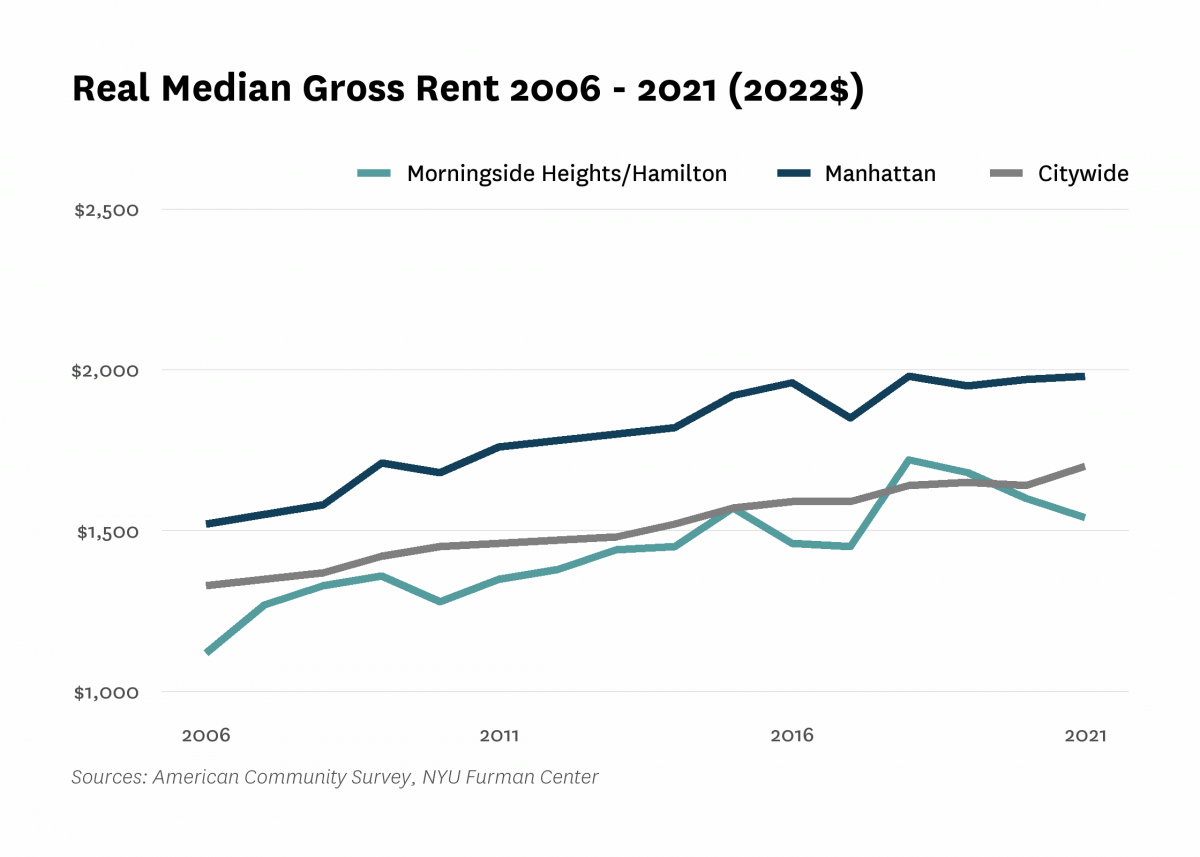
| Median rent, 2- and 3-bedrooms (2022$) | $1,270 | $1,560 | $1,630 | |||
| Median rent, all (2022$) | $1,040 | $1,120 | $1,280 | $1,680 | $1,540 | |
| Median rent, recent movers (2022$) | $1,880 | $2,170 | $2,240 | |||
| Median rent, studios and 1-bedrooms (2022$) | $1,260 | $1,390 | $1,480 | |||
| Change in collected rent (2019-2020) | -3.4% | |||||
| Affordability | ||||||
| Rental units affordable at 30% AMI (% of recently available units) | 4.4% | 9.0% | 10.1% | |||
| Rental units affordable at 80% AMI (% of recently available units) | 38.1% | 37.8% | 40.0% | |||
| Rental units affordable at 120% AMI (% of recently available units) | 83.0% | 82.5% | 87.1% | |||
| Rent Burden | ||||||
| Moderately rent-burdened households | 22.7% | 22.9% | 21.1% | 20.4% | ||
| Moderately rent-burdened households, low income | 28.2% | 29.4% | 26.3% | |||
| Moderately rent-burdened households, moderate income | 30.4% | 32.3% | 29.3% | |||
| Severely rent-burdened households | 24.0% | 29.6% | 29.3% | 30.4% | ||
| Severely rent-burdened households, low income | 43.1% | 43.5% | 46.6% | |||
| Severely rent-burdened households, moderate income | 1.5% | 3.1% | 2.1% | |||
| Rental Subsidy | ||||||
| Housing choice vouchers (% of occupied, privately owned rental units) | 7.7% | 6.8% | ||||
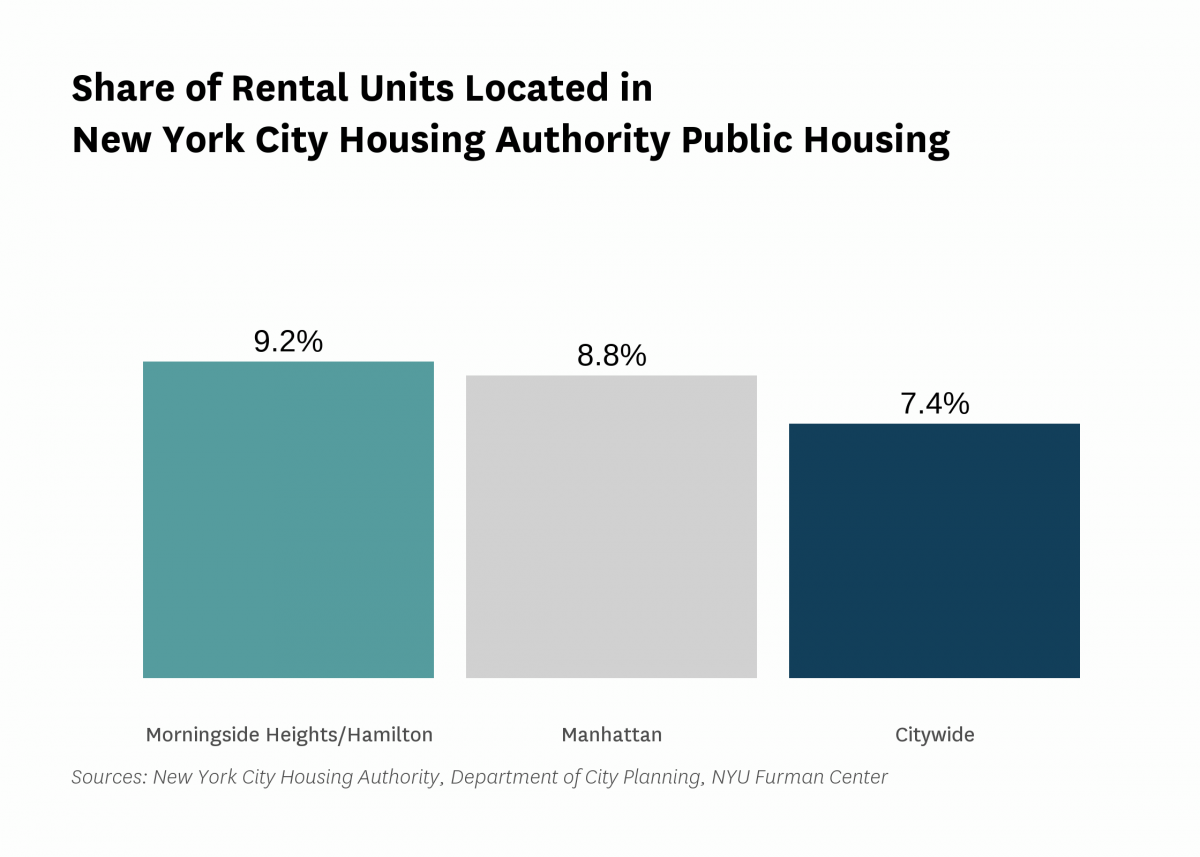
| Public housing (% of rental units) | 9.2% | |||||
Data Notes: See CoreData User Guide for more information about indicator definitions and methods.
Indicators: The rental vacancy rate, severe crowding rate, and the severely rent-burdened households indicators use five-year American Community Survey (ACS) estimates. Data under the 2010 heading comes from the 2006 – 2010 ACS, data under the 2019 heading comes from the 2015 – 2019 ACS and data under the 2021 heading comes from 2017 – 2021 ACS .
All content © 2005 – 2024 Furman Center for Real Estate and Urban Policy | Top of page | Contact Us