| Indicator | 2000 | 2006 | 2010 | 2019 | 2021 | 2022 |
|---|---|---|---|---|---|---|
| Population | ||||||
| Born in New York State info | 38.1% | 35.1% | 35.7% | 38.3% | ||
| Disabled population info | 4.7% | 6.4% | 5.1% | |||
| Foreign-born population info | 25.3% | 24.0% | 27.0% | 27.0% | 27.5% | |
| Population info | 122,241 | 131,439 | 134,471 | 167,290 | 151,924 | |
| Population aged 65+ info | 11.4% | 11.3% | 11.9% | 16.4% | 15.2% | |
| Households | ||||||
| Households with children under 18 years old info | 8.4% | 8.7% | 9.2% | 8.7% | 7.9% | |
| Single-person households info | 63.4% | 58.0% | 57.6% | 60.8% | ||
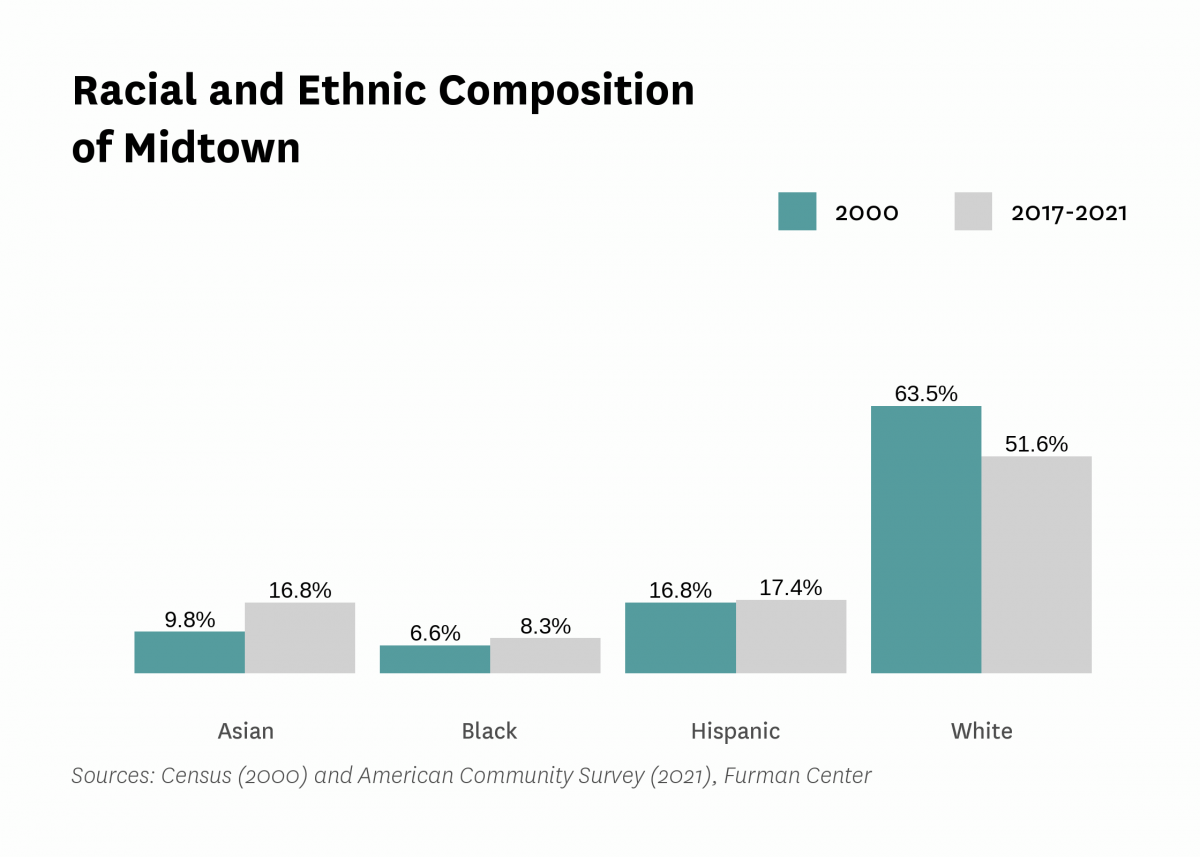
| Race and Ethnicity | ||||||
| Percent Asian info | 9.8% | 13.7% | 13.9% | 15.8% | 16.8% | |
| Percent Black info | 6.6% | 6.0% | 6.3% | 4.6% | 8.3% | |
| Percent Hispanic info | 16.8% | 14.6% | 12.6% | 17.4% | 17.4% | |
| Percent white info | 63.5% | 64.0% | 63.6% | 58.6% | 51.6% | |
| Racial diversity index info | 0.55 | 0.55 | 0.56 | 0.60 | 0.67 | |
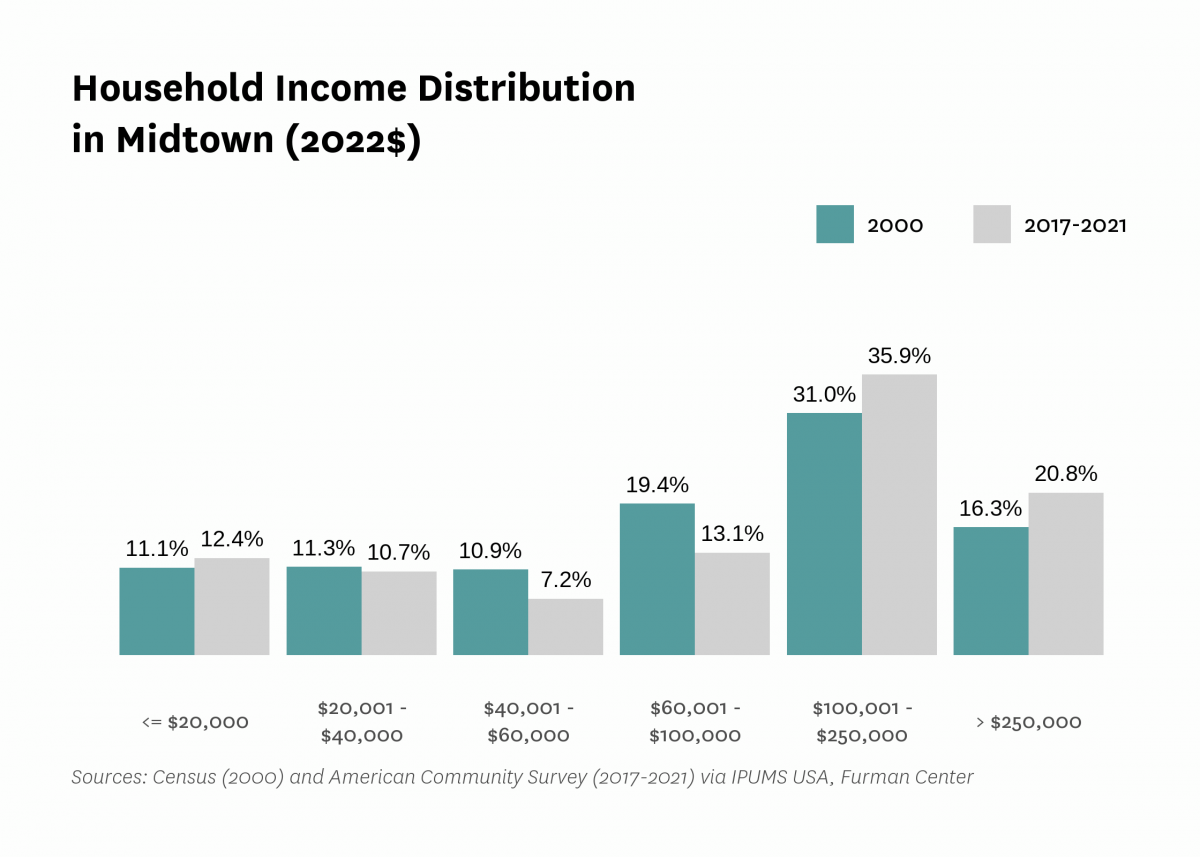
| Income and Poverty | ||||||
| Income diversity ratio info | 7.2 | 8.2 | 6.3 | 7.9 | ||
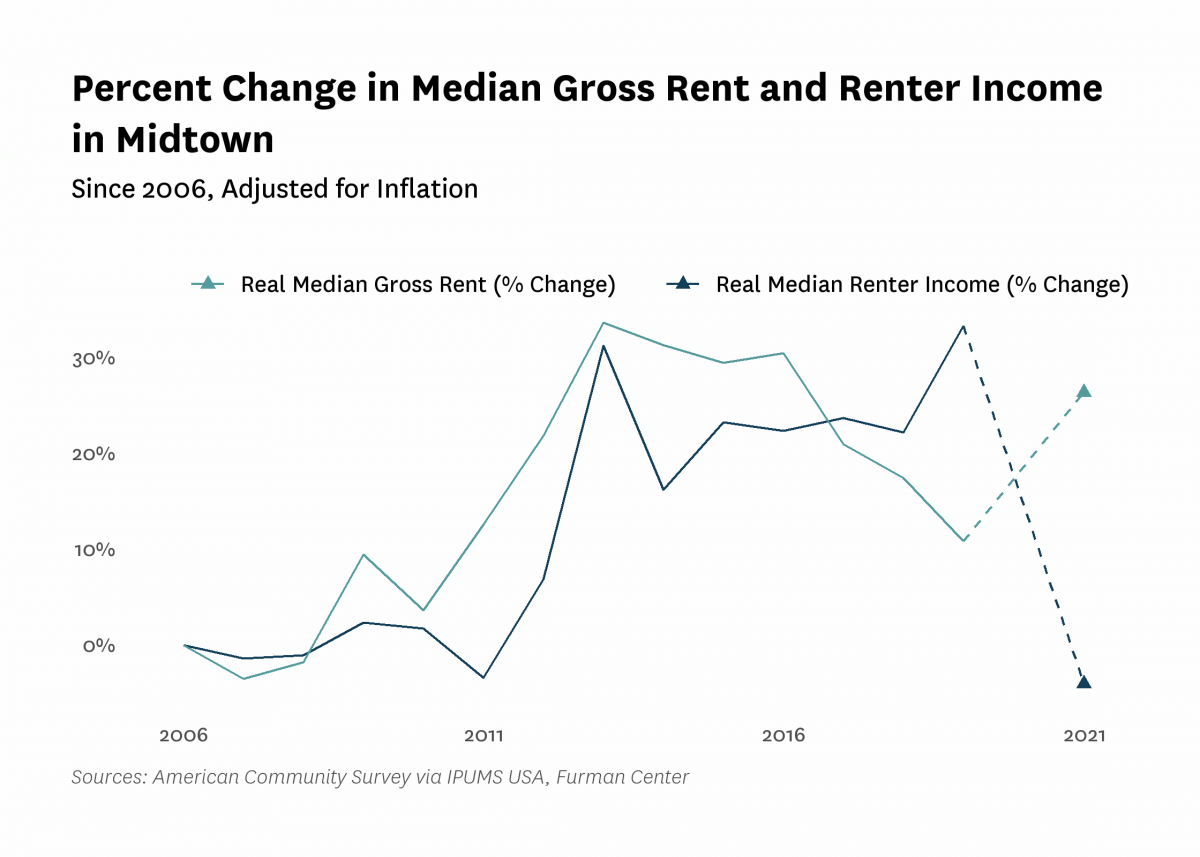
| Median household income (2022$) info | $96,370 | $102,170 | $100,230 | $134,070 | $98,510 | |
| Median household income, homeowners (2022$) info | $161,630 | $148,170 | $182,440 | $182,860 | ||
| Median household income, renters (2022$) info | $88,790 | $90,320 | $118,330 | $85,230 | ||
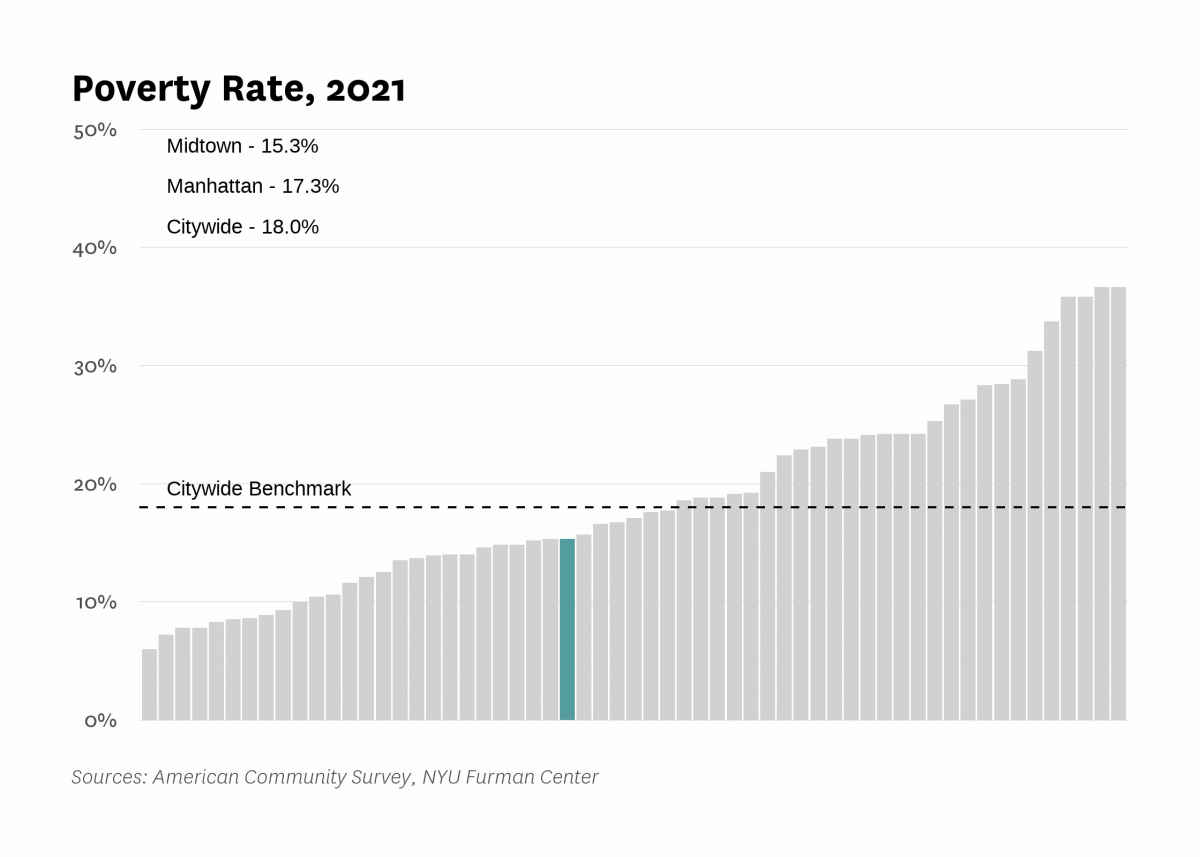
| Poverty rate info | 14.4% | 13.6% | 11.7% | 11.1% | 15.3% | |
| Poverty rate, population aged 65+ info | 15.3% | 15.4% | 24.2% | 15.1% | ||
| Poverty rate, population under 18 years old info | 19.4% | 14.7% | 9.4% | 21.5% | ||
| Labor Market | ||||||
| Labor force participation rate info | 76.2% | 74.6% | 73.1% | 72.4% | ||
| Population aged 25+ without a high school diploma info | 8.4% | 7.7% | 6.9% | 4.6% | ||
| Unemployment rate info | 7.33% | 5.49% | 8.29% | 2.64% | 9.47% | |
| Indicator | 2000 | 2006 | 2010 | 2019 | 2021 | 2022 |
|---|---|---|---|---|---|---|
| Housing Stock | ||||||
| Homeownership rate info | 20.2% | 20.1% | 24.9% | 22.8% | 21.2% | |
| Housing units info | 90,715 | 91,373 | 111,154 | 115,616 | ||
| Rental vacancy rate info | 3.9% | 6.8% | 8.0% | |||
| Serious housing code violations (per 1,000 privately owned rental units) | 6.8 | 7.1 | 11.0 | 17.2 | 23.0 | |
| Severe crowding rate (% of renter households) info | 2.6% | 3.6% | 2.5% | |||
| Total housing code violations (per 1,000 privately owned rental units) | 42.9 | 37.3 | 53.8 | 84.3 | 89.0 | |
| Finance - Distress | ||||||
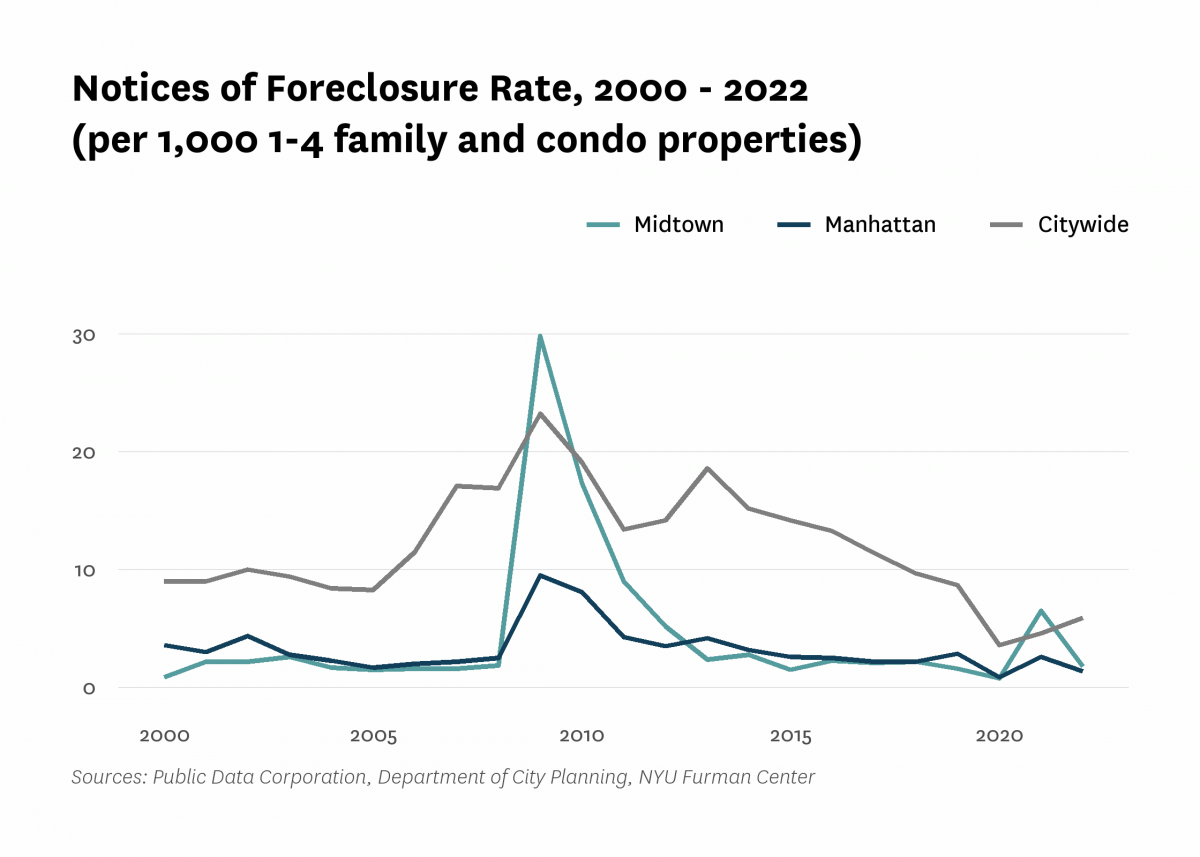
| Notices of foreclosure rate (per 1,000 1-4 family and condo properties) | 0.9 | 1.6 | 17.3 | 1.6 | 6.5 | 1.8 |
| Notices of foreclosure, all residential properties | 5 | 13 | 172 | 19 | 75 | 22 |
| Notices of foreclosure, initial, 1-4 family and condo properties | 4 | 10 | 99 | 6 | 73 | 15 |
| Notices of foreclosure, repeat, 1-4 family and condo properties | 1 | 3 | 69 | 12 | 1 | 7 |
| Pre-foreclosure notice rate (per 1,000 1-4 family and condo properties) | 7.5 | 3.4 | 7.8 | |||
| Pre-foreclosure notices, 1-4 family and condo properties | 84 | 41 | 94 | |||
| Properties entering REO, 1-4 family | 0 | 0 | 0 | |||
| Finance - Lending | ||||||
| FHA/VA-backed home purchase loans (% of home purchase loans) | 0.0% | 0.2% | 0.1% | 0.0% | ||
| Higher-cost home purchase loans (% of home purchase loans) | 3.0% | 0.6% | 1.2% | 0.6% | ||
| Higher-cost refinance loans (% of refinance loans) | 8.4% | 0.3% | 0.7% | 0.2% | ||
| Home purchase loan rate (per 1,000 properties) | 54.9 | 20.4 | 16.5 | 26.8 | ||
| Home purchase loans in LMI tracts (% of home purchase loans) | 1.4% | 1.8% | 1.2% | 2.1% | ||
| Home purchase loans to LMI borrowers (% of home purchase loans) | 0.5% | 2.3% | 1.7% | 2.2% | ||
| Refinance loan rate (per 1,000 properties) | 11.6 | 25.9 | 13.6 | 24.0 | ||
| Sales - Volume | ||||||
| Sales volume, 1 family building | 0 | 1 | 0 | 0 | 0 | 1 |
| Sales volume, 2-4 family building | 0 | 3 | 0 | 0 | 0 | 2 |
| Sales volume, 5+ family building | 7 | 15 | 11 | 7 | 6 | 9 |
| Sales volume, condominium | 337 | 1,006 | 627 | 511 | 707 | 755 |
| Sales volume, all property types | 344 | 1,025 | 638 | 518 | 713 | 767 |
| Sales - Median Prices | ||||||
| Median sales price per unit, 1 family building (2022$) | $4,279,720 | $6,400,000 | ||||
| Median sales price per unit, 2-4 family building (2022$) | $2,564,600 | $1,875,000 | ||||
| Median sales price per unit, 5+ family building (2022$) | $265,530 | $880,220 | $621,240 | $1,112,690 | $935,060 | $588,910 |
| Median sales price per unit, condominium (2022$) | $790,220 | $1,395,130 | $1,648,150 | $2,363,710 | $1,971,710 | $2,125,000 |
| Sales - Housing Price Index | ||||||
| Index of housing price appreciation, 1 family building info | 100.0 | |||||
| Index of housing price appreciation, 2-4 family building info | 100.0 | |||||
| Index of housing price appreciation, 5+ family building | 100.0 | 382.2 | 344.5 | 617.9 | 156.9 | 92.0 |
| Index of housing price appreciation, condominium | 100.0 | 209.9 | 202.5 | 258.7 | 246.7 | 258.4 |
| Index of housing price appreciation, all property types | 100.0 | 211.5 | 204.1 | 263.5 | 247.2 | 259.2 |
| Subsidized Housing | ||||||
| Total number of subsidized properties (properties) | 46 | |||||
| HUD Financing or Insurance (properties) | 0 | |||||
| HUD Financing or Insurance (units) | 0 | |||||
| HUD Project-based Rental Assistance Program (properties) | 1 | |||||
| HUD Project-based Rental Assistance Program (units) | 278 | |||||
| Low Income Housing Tax Credit (properties) | 15 | |||||
| Low Income Housing Tax Credit (units) | 5,282 | |||||
| Public Housing (properties) | 0 | |||||
| Public Housing (units) | 0 | |||||
| Mitchell-Lama (properties) | 0 | |||||
| Mitchell-Lama (units) | 0 | |||||
| 421-a Tax Exemption (properties) | 20 | |||||
| 421-a Tax Exemption (units) | 5,348 | |||||
| 420-c Tax Exemption (properties) | 3 | |||||
| 420-c Tax Exemption (units) | 1,162 | |||||
| NYC Housing Production Programs and Zoning Incentives or Requirements (properties) | 22 | |||||
| Eligible to expire from housing programs between 2023 and 2028 (properties) | 3 | |||||
| Eligible to expire from housing programs between 2023 and 2028 (units) | 1,253 | |||||
| Eligible to expire from housing programs between 2029 and 2038 (properties) | 9 | |||||
| Eligible to expire from housing programs between 2029 and 2038 (units) | 3,040 | |||||
| Eligible to expire from housing programs in 2039 and later (properties) | 3 | |||||
| Eligible to expire from housing programs in 2039 and later (units) | 978 | |||||
| Indicator | 2000 | 2006 | 2010 | 2019 | 2021 | 2022 |
|---|---|---|---|---|---|---|
| Density | ||||||
| Population density (1,000 persons per square mile) info | 42.6 | 43.6 | 54.3 | 49.3 | ||
| Development | ||||||
| Units authorized by new residential building permits | 1,174 | 0 | 14 | 99 | 41 | 701 |
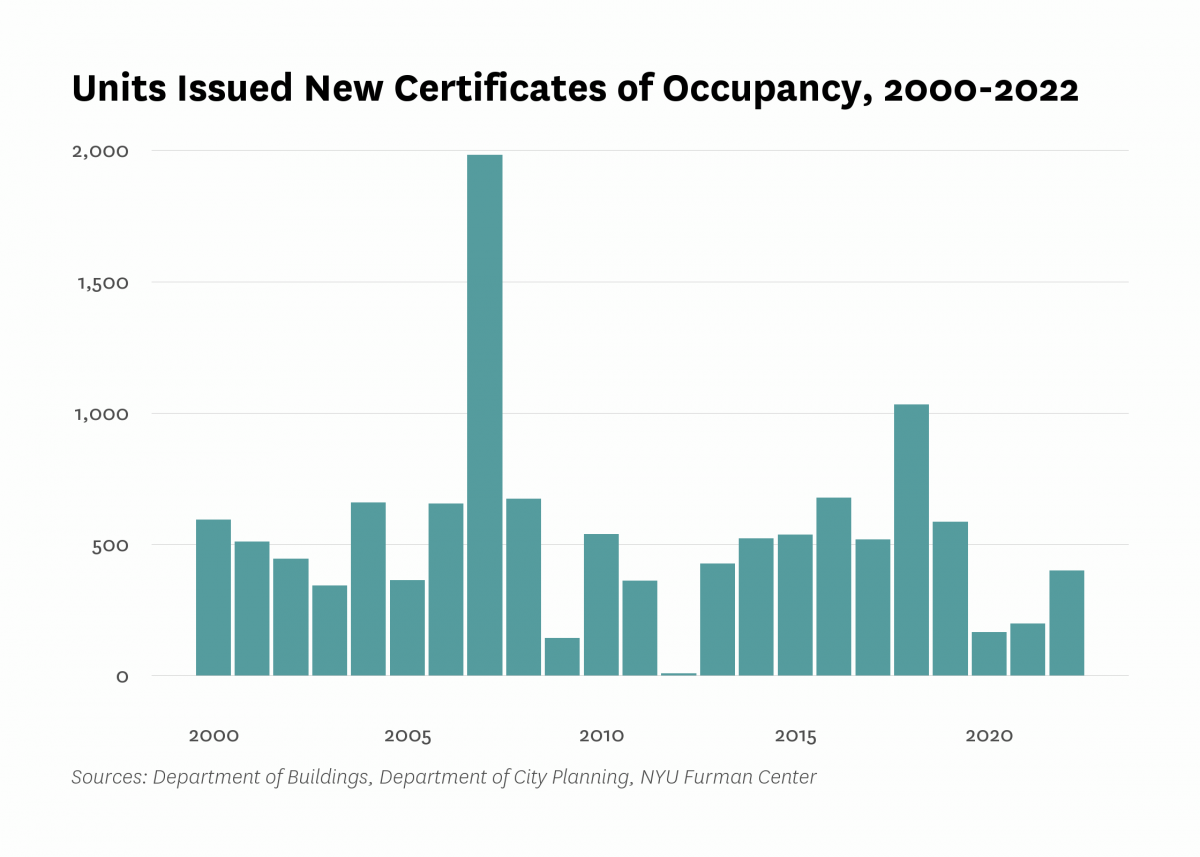
| Units issued new certificates of occupancy | 594 | 655 | 538 | 586 | 199 | 400 |
| Indicator | 2000 | 2006 | 2010 | 2019 | 2021 | 2022 |
|---|---|---|---|---|---|---|
| Commute | ||||||
| Car-free commute (% of commuters) info | 86.7% | 87.7% | 88.2% | 89.3% | 84.4% | |
| Mean travel time to work (minutes) | 24.8 | 24.2 | 24.9 | 27.5 | 28.2 | |
| Crime and Incarceration | ||||||
| Serious crime rate (per 1,000 residents) | 160.2 | 105.7 | 92.7 | 68.9 | 93.4 | |
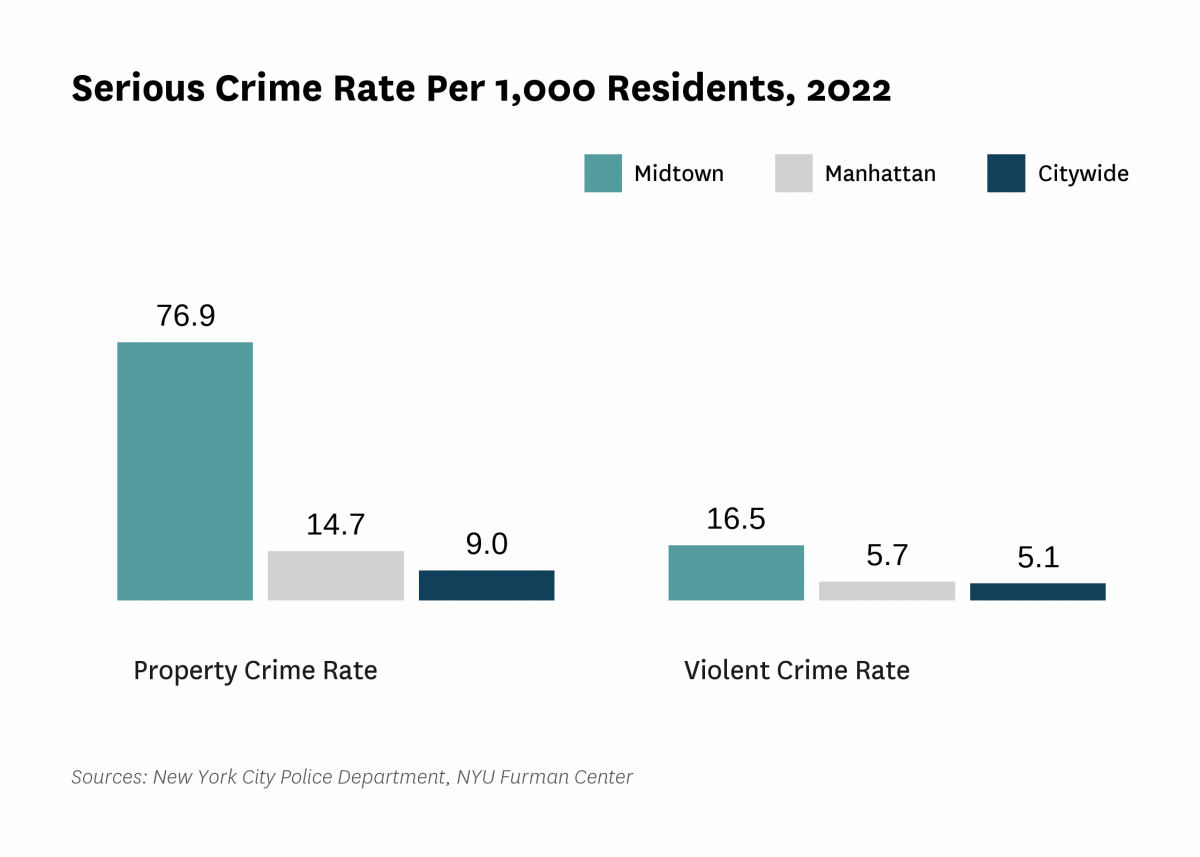
| Serious crime rate, property (per 1,000 residents) | 143.1 | 95.2 | 82.1 | 53.7 | 76.9 | |
| Serious crime rate, violent (per 1,000 residents) | 17.1 | 10.6 | 10.6 | 15.2 | 16.5 | |
| Schools | ||||||
| Students performing at grade level in English language arts, 4th grade | 83.3% | 75.4% | ||||
| Students performing at grade level in math, 4th grade | 80.3% | 75.4% | ||||
| Indicator | 2000 | 2006 | 2010 | 2019 | 2021 | 2022 |
|---|---|---|---|---|---|---|
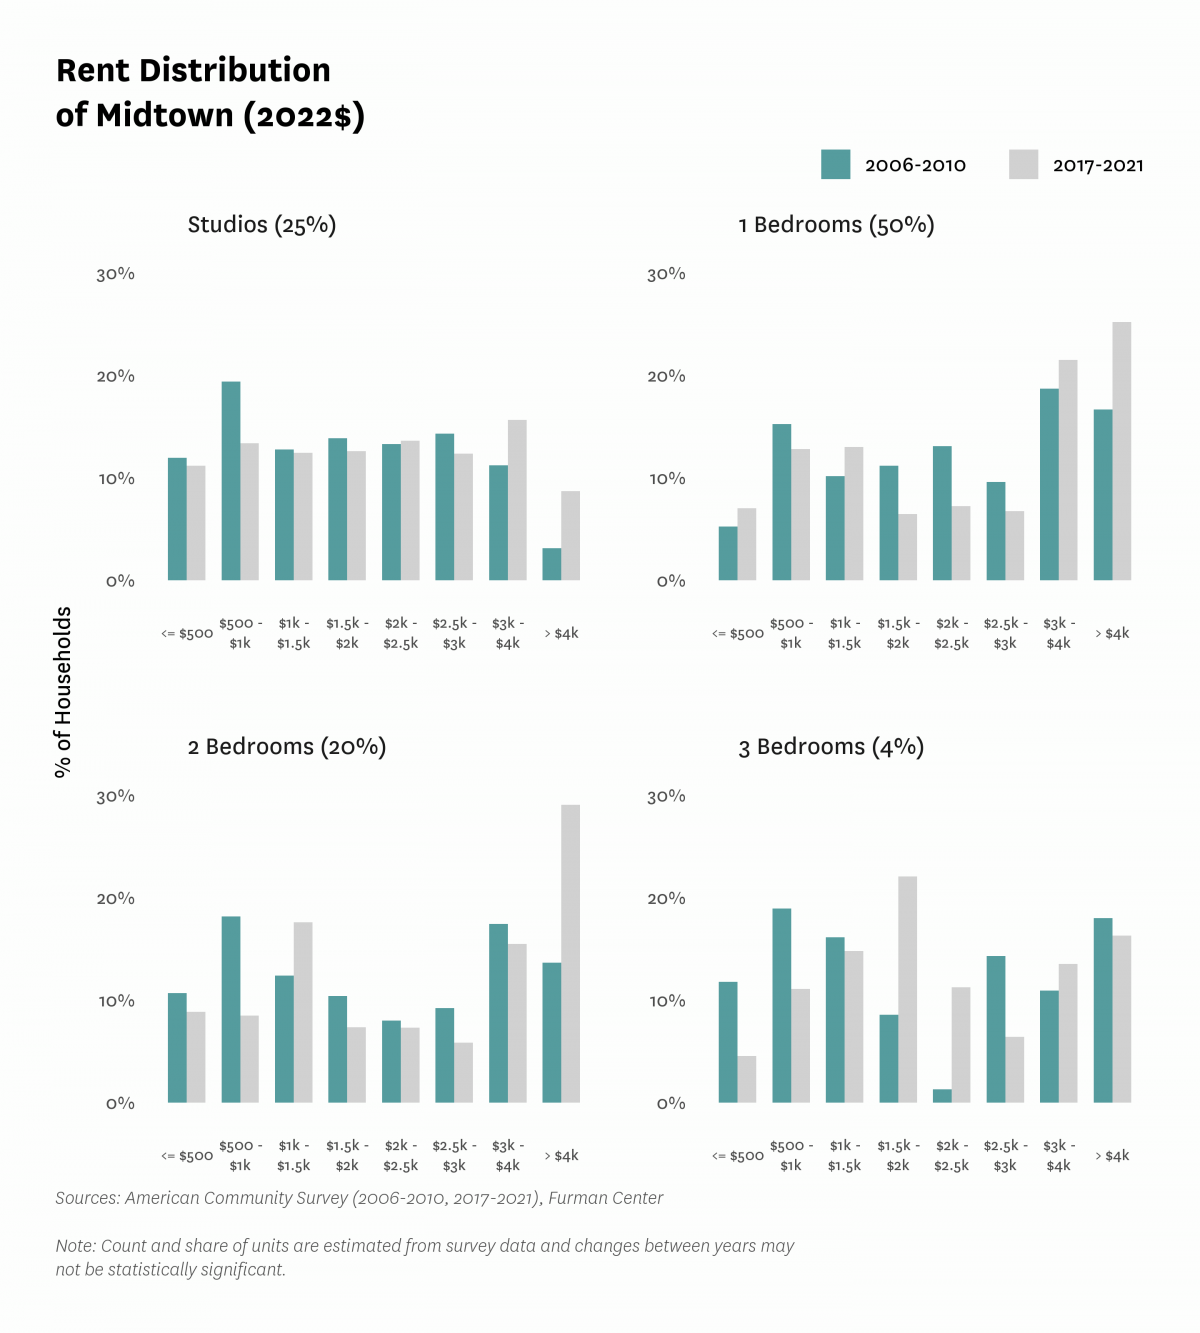
| Median Rent | ||||||
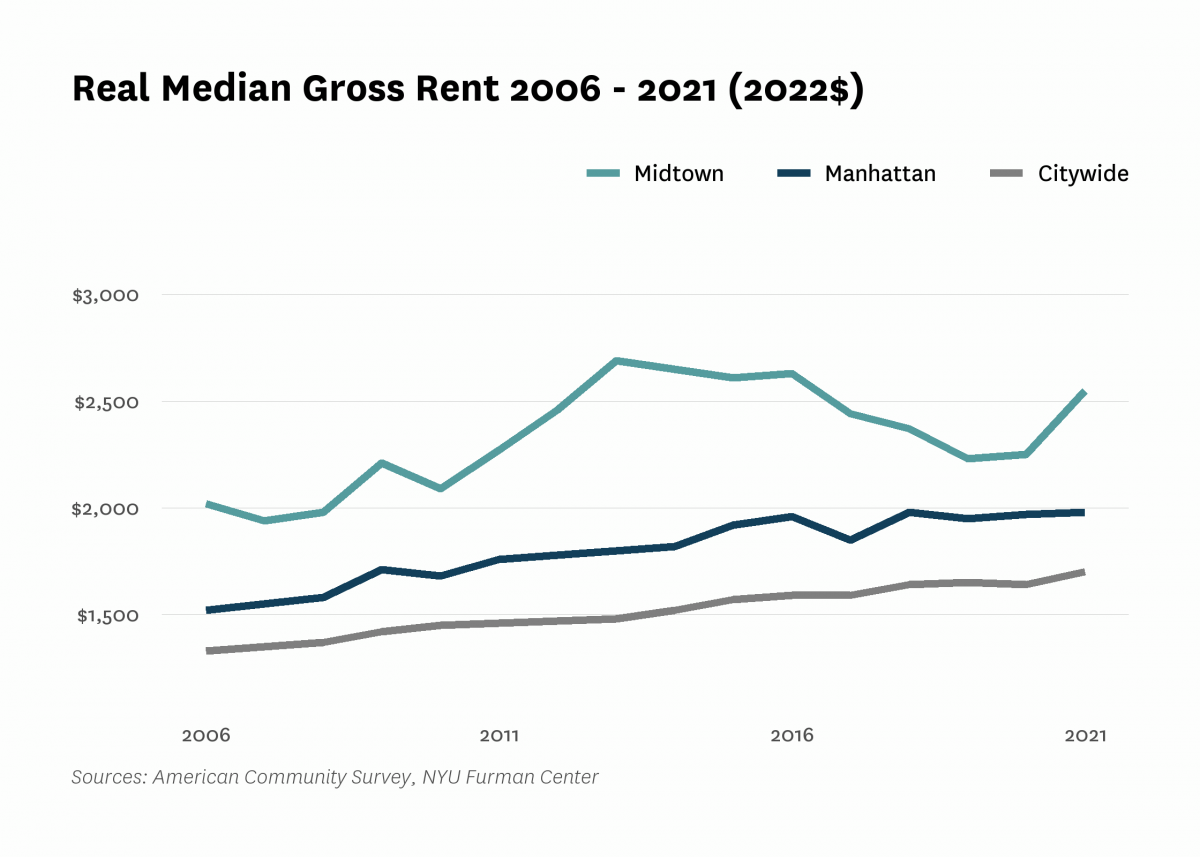
| Median rent, 2- and 3-bedrooms (2022$) info | $2,030 | $2,340 | $2,440 | |||
| Median rent, all (2022$) info | $1,690 | $2,020 | $2,090 | $2,230 | $2,550 | |
| Median rent, recent movers (2022$) info | $2,980 | $3,070 | $3,320 | |||
| Median rent, studios and 1-bedrooms (2022$) info | $2,130 | $2,370 | $2,380 | |||
| Change in collected rent (2019-2020) | -5.6% | |||||
| Affordability | ||||||
| Rental units affordable at 30% AMI (% of recently available units) | 4.1% | 6.5% | 5.2% | |||
| Rental units affordable at 80% AMI (% of recently available units) | 15.4% | 23.3% | 22.4% | |||
| Rental units affordable at 120% AMI (% of recently available units) | 31.5% | 43.5% | 44.6% | |||
| Rent Burden | ||||||
| Moderately rent-burdened households info | 21.6% | 22.6% | 21.8% | 25.4% | ||
| Moderately rent-burdened households, low income info | 24.4% | 28.4% | 31.9% | |||
| Moderately rent-burdened households, moderate income info | 33.4% | 38.0% | 36.4% | |||
| Severely rent-burdened households info | 18.4% | 19.9% | 19.5% | 19.8% | ||
| Severely rent-burdened households, low income info | 46.3% | 45.6% | 41.1% | |||
| Severely rent-burdened households, moderate income info | 17.8% | 18.5% | 15.2% | |||
| Rental Subsidy | ||||||
| Housing choice vouchers (% of occupied, privately owned rental units) info | 2.2% | 1.9% | ||||
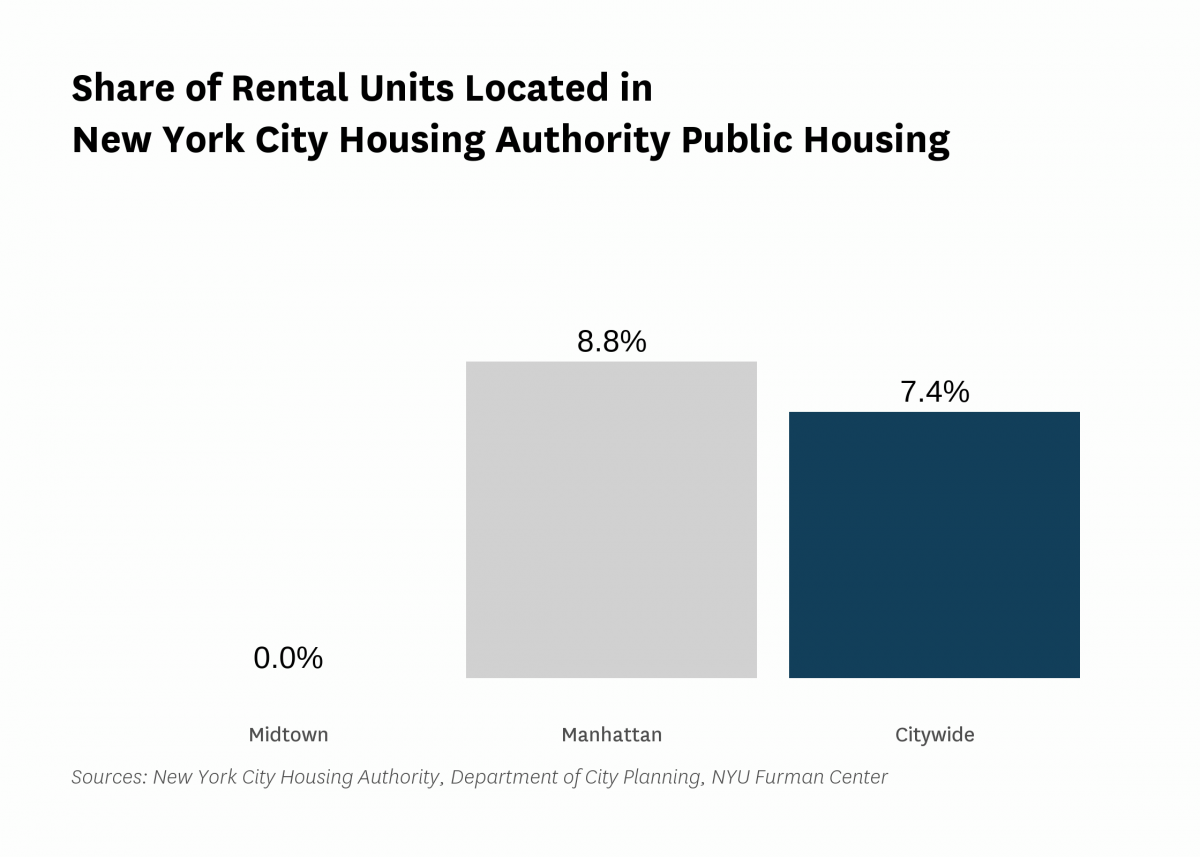
| Public housing (% of rental units) info | 0.0% | |||||
Data Notes: Community districts MN04 and MN05 both fall within sub-borough area 303. Data reported at the sub-borough level are identical. See CoreData User Guide for more information about indicator definitions and methods.
Indicators: The rental vacancy rate, severe crowding rate, and the severely rent-burdened households indicators use five-year American Community Survey (ACS) estimates. Data under the 2010 heading comes from the 2006 – 2010 ACS, data under the 2019 heading comes from the 2015 – 2019 ACS and data under the 2021 heading comes from 2017 – 2021 ACS .
All content © 2005 – 2024 Furman Center for Real Estate and Urban Policy | Top of page | Contact Us