| Indicator | 2000 | 2006 | 2010 | 2019 | 2021 | 2022 |
|---|---|---|---|---|---|---|
| Population | ||||||
| Born in New York State info | 56.8% | 55.6% | 59.6% | 58.0% | ||
| Disabled population info | 18.4% | 18.2% | 15.9% | |||
| Foreign-born population info | 23.9% | 24.3% | 27.7% | 26.3% | 25.1% | |
| Population info | 130,448 | 137,900 | 156,790 | 146,824 | 159,556 | |
| Population aged 65+ info | 7.5% | 7.5% | 8.1% | 10.6% | 12.0% | |
| Households | ||||||
| Households with children under 18 years old info | 50.6% | 46.4% | 50.1% | 32.0% | 35.6% | |
| Single-person households info | 30.0% | 25.0% | 39.7% | 32.7% | ||
| Race and Ethnicity | ||||||
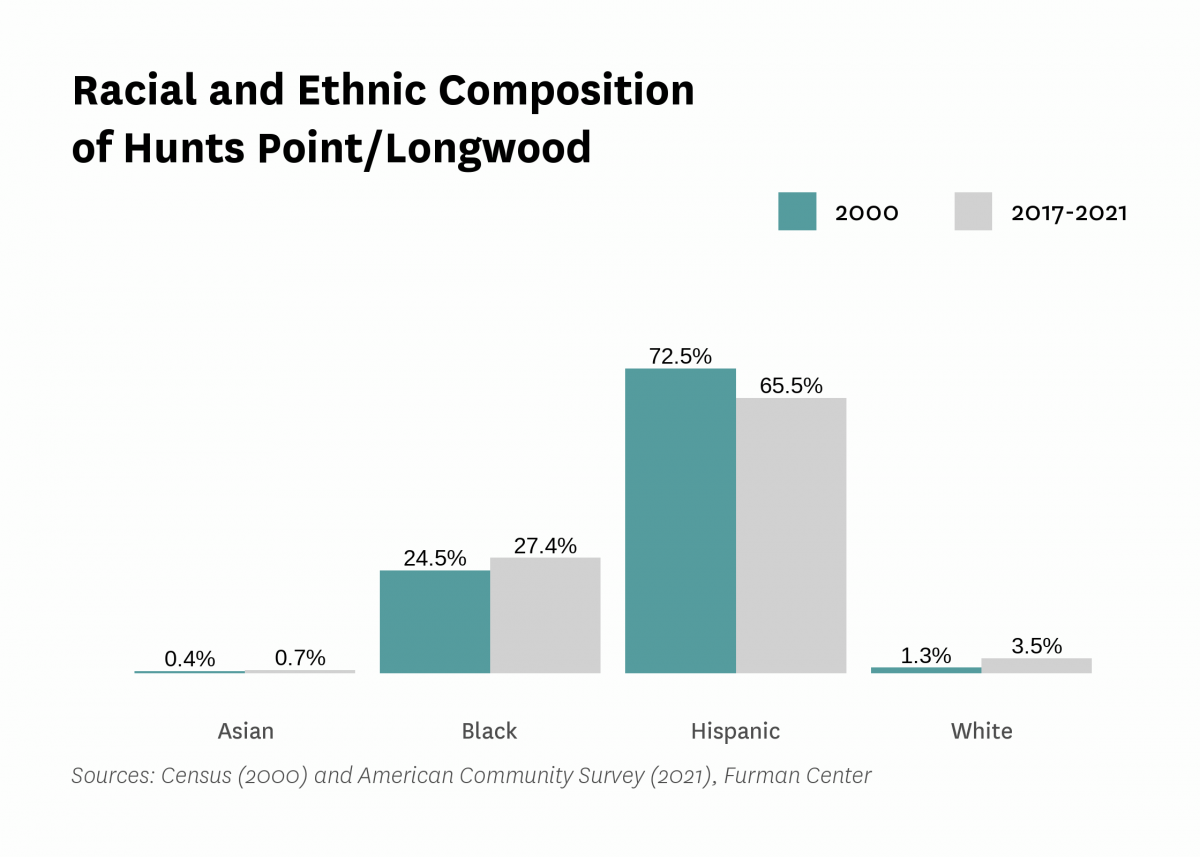
| Percent Asian info | 0.4% | 0.9% | 1.0% | 0.5% | 0.7% | |
| Percent Black info | 24.5% | 27.4% | 29.2% | 27.7% | 27.4% | |
| Percent Hispanic info | 72.5% | 69.3% | 66.8% | 68.3% | 65.5% | |
| Percent white info | 1.3% | 1.5% | 2.0% | 2.6% | 3.5% | |
| Racial diversity index info | 0.41 | 0.44 | 0.47 | 0.46 | 0.50 | |
| Income and Poverty | ||||||
| Income diversity ratio info | 5.6 | 5.3 | 6.9 | 6.6 | ||
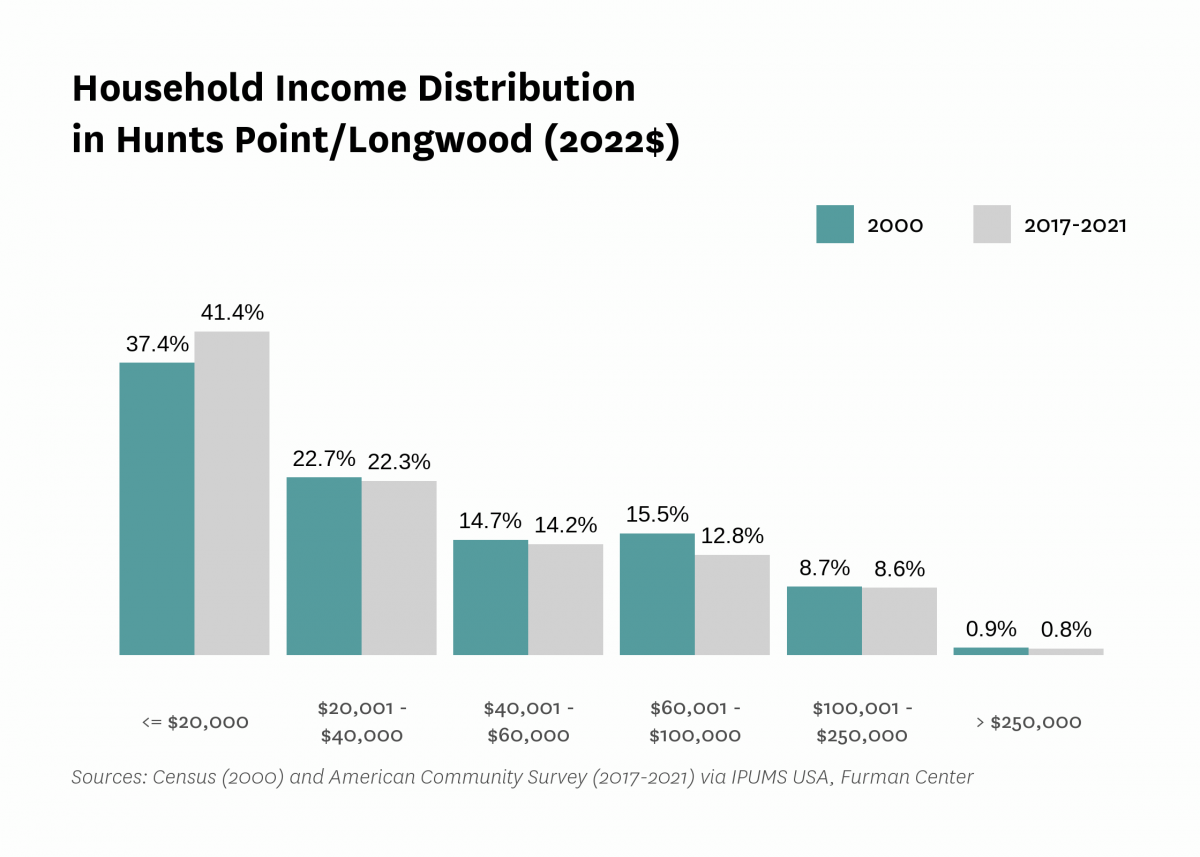
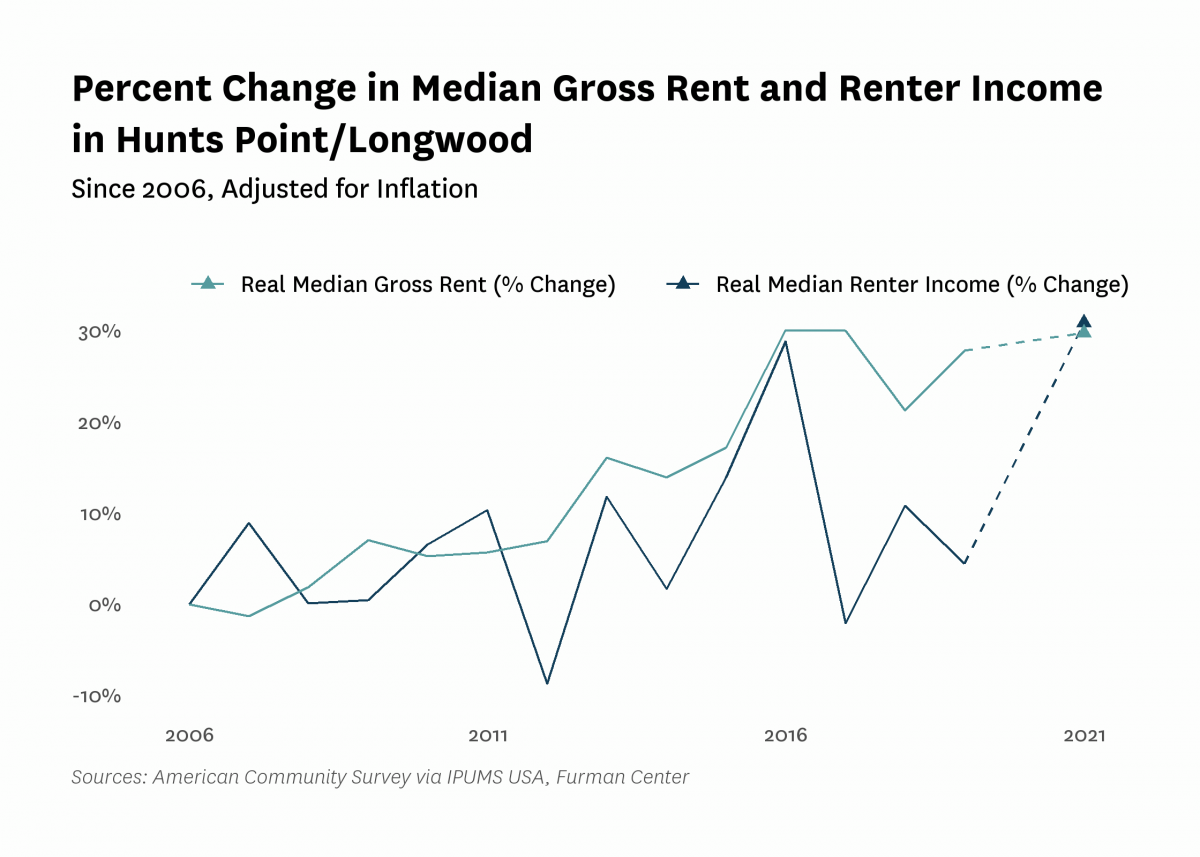
| Median household income (2022$) info | $30,660 | $25,070 | $26,840 | $27,960 | $32,010 | |
| Median household income, homeowners (2022$) info | $71,680 | $97,310 | $92,670 | $52,020 | ||
| Median household income, renters (2022$) info | $23,320 | $24,860 | $24,370 | $30,530 | ||
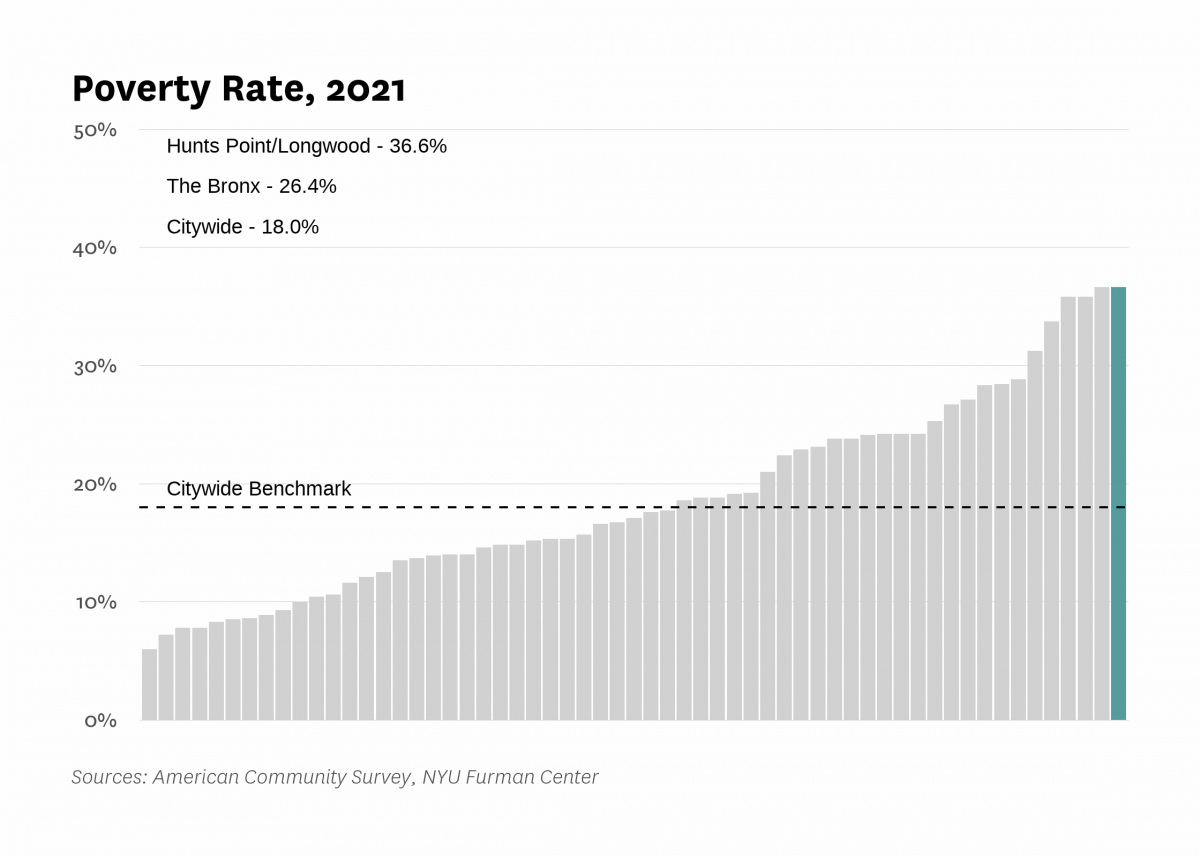
| Poverty rate info | 45.5% | 43.2% | 41.1% | 39.6% | 36.6% | |
| Poverty rate, population aged 65+ info | 40.8% | 31.4% | 40.2% | 31.9% | ||
| Poverty rate, population under 18 years old info | 56.3% | 54.1% | 54.1% | 50.1% | ||
| Labor Market | ||||||
| Labor force participation rate info | 47.8% | 49.2% | 52.7% | 53.1% | ||
| Population aged 25+ without a high school diploma info | 48.2% | 43.1% | 29.8% | 33.8% | ||
| Unemployment rate info | 23.63% | 14.92% | 19.04% | 11.29% | 18.80% | |
| Indicator | 2000 | 2006 | 2010 | 2019 | 2021 | 2022 |
|---|---|---|---|---|---|---|
| Housing Stock | ||||||
| Homeownership rate info | 7.4% | 7.6% | 7.6% | 8.7% | 9.0% | |
| Housing units info | 46,646 | 50,507 | 56,443 | 57,071 | ||
| Rental vacancy rate info | 5.4% | 1.7% | 1.7% | |||
| Serious housing code violations (per 1,000 privately owned rental units) | 141.3 | 119.8 | 168.4 | 169.2 | 216.8 | |
| Severe crowding rate (% of renter households) info | 4.2% | 4.5% | 5.8% | |||
| Total housing code violations (per 1,000 privately owned rental units) | 674.4 | 456.0 | 553.7 | 604.2 | 672.9 | |
| Finance - Distress | ||||||
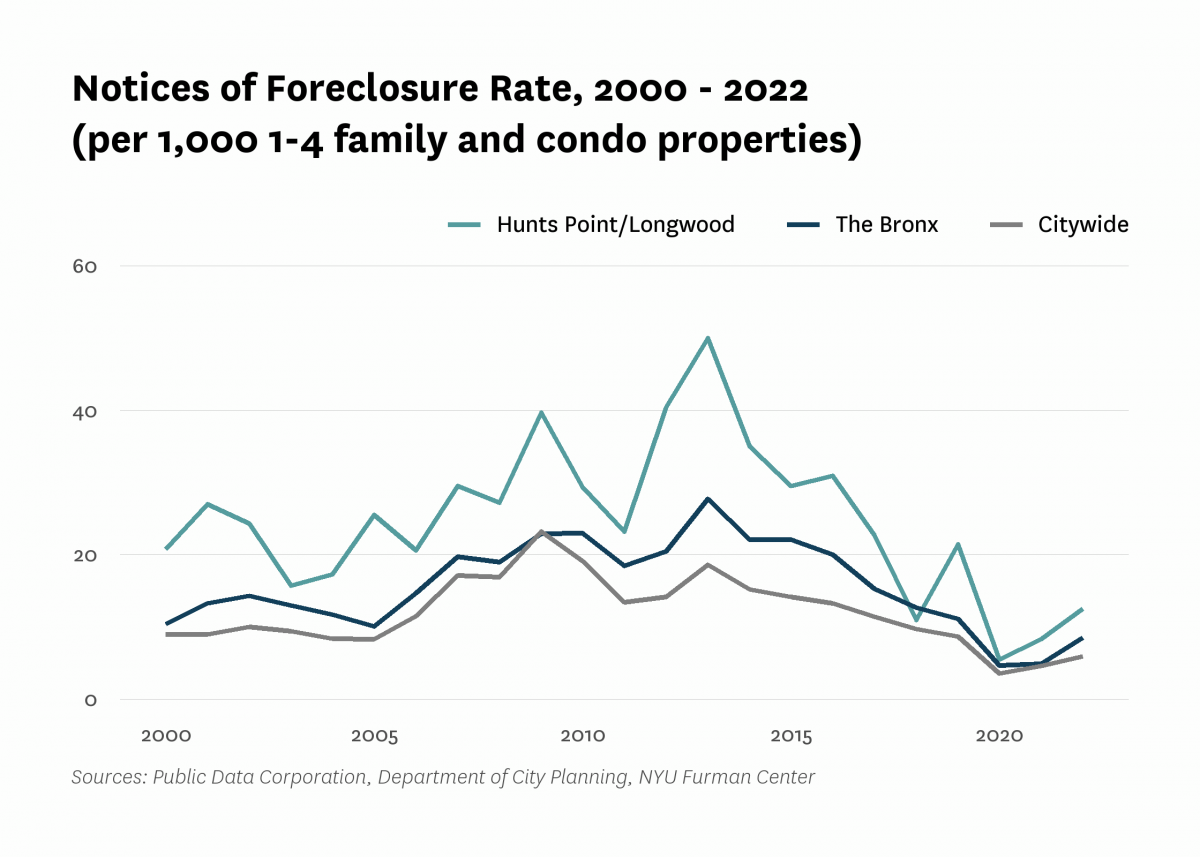
| Notices of foreclosure rate (per 1,000 1-4 family and condo properties) | 20.8 | 20.6 | 29.4 | 21.4 | 8.3 | 12.5 |
| Notices of foreclosure, all residential properties | 28 | 31 | 52 | 33 | 12 | 19 |
| Notices of foreclosure, initial, 1-4 family and condo properties | 21 | 23 | 31 | 14 | 5 | 9 |
| Notices of foreclosure, repeat, 1-4 family and condo properties | 3 | 6 | 12 | 17 | 7 | 9 |
| Pre-foreclosure notice rate (per 1,000 1-4 family and condo properties) | 71.2 | 33.0 | 74.2 | |||
| Pre-foreclosure notices, 1-4 family and condo properties | 103 | 47 | 107 | |||
| Properties entering REO, 1-4 family | 4 | 1 | 6 | |||
| Finance - Lending | ||||||
| FHA/VA-backed home purchase loans (% of home purchase loans) | 2.1% | 68.9% | 25.7% | 20.9% | ||
| Higher-cost home purchase loans (% of home purchase loans) | 43.6% | 2.2% | 9.5% | 3.3% | ||
| Higher-cost refinance loans (% of refinance loans) | 41.3% | 0.0% | 1.4% | 2.5% | ||
| Home purchase loan rate (per 1,000 properties) | 47.3 | 8.7 | 13.6 | 16.6 | ||
| Home purchase loans in LMI tracts (% of home purchase loans) | 99.2% | 11.1% | 100.0% | 100.0% | ||
| Home purchase loans to LMI borrowers (% of home purchase loans) | 3.2% | 100.0% | 9.6% | 21.3% | ||
| Refinance loan rate (per 1,000 properties) | 50.5 | 5.8 | 13.0 | 28.8 | ||
| Sales - Volume | ||||||
| Sales volume, 1 family building | 2 | 5 | 2 | 3 | 2 | 7 |
| Sales volume, 2-4 family building | 43 | 109 | 31 | 38 | 17 | 22 |
| Sales volume, 5+ family building | 10 | 17 | 3 | 5 | 4 | 11 |
| Sales volume, condominium | 1 | 1 | 6 | 4 | 2 | 3 |
| Sales volume, all property types | 56 | 132 | 42 | 50 | 25 | 43 |
| Sales - Median Prices | ||||||
| Median sales price per unit, 1 family building (2022$) | $378,120 | $449,680 | $197,650 | $524,030 | $462,850 | $510,000 |
| Median sales price per unit, 2-4 family building (2022$) | $133,120 | $267,000 | $180,270 | $355,390 | $366,050 | $333,000 |
| Median sales price per unit, 5+ family building (2022$) | $48,280 | $101,880 | $77,060 | $118,920 | $168,650 | $212,110 |
| Median sales price per unit, condominium (2022$) | $93,470 | $139,910 | $287,290 | $236,930 | $294,430 | $299,000 |
| Sales - Housing Price Index | ||||||
| Index of housing price appreciation, 1 family building | 100.0 | 186.5 | 290.0 | 269.5 | 332.2 | |
| Index of housing price appreciation, 2-4 family building | 100.0 | 191.8 | 117.5 | 281.0 | 302.4 | 354.1 |
| Index of housing price appreciation, 5+ family building | 100.0 | 268.5 | 221.3 | 630.6 | 693.1 | 603.0 |
| Index of housing price appreciation, condominium | 100.0 | 72.4 | 105.1 | 135.2 | ||
| Index of housing price appreciation, all property types | 100.0 | 200.3 | 133.5 | 295.5 | 314.2 | 359.2 |
| Subsidized Housing | ||||||
| Total number of subsidized properties (properties) | 484 | |||||
| HUD Financing or Insurance (properties) | 6 | |||||
| HUD Financing or Insurance (units) | 333 | |||||
| HUD Project-based Rental Assistance Program (properties) | 67 | |||||
| HUD Project-based Rental Assistance Program (units) | 2,910 | |||||
| Low Income Housing Tax Credit (properties) | 103 | |||||
| Low Income Housing Tax Credit (units) | 5,457 | |||||
| Public Housing (properties) | 23 | |||||
| Public Housing (units) | 620 | |||||
| Mitchell-Lama (properties) | 12 | |||||
| Mitchell-Lama (units) | 537 | |||||
| 421-a Tax Exemption (properties) | 27 | |||||
| 421-a Tax Exemption (units) | 1,220 | |||||
| 420-c Tax Exemption (properties) | 58 | |||||
| 420-c Tax Exemption (units) | 3,079 | |||||
| NYC Housing Production Programs and Zoning Incentives or Requirements (properties) | 191 | |||||
| Eligible to expire from housing programs between 2023 and 2028 (properties) | 6 | |||||
| Eligible to expire from housing programs between 2023 and 2028 (units) | 320 | |||||
| Eligible to expire from housing programs between 2029 and 2038 (properties) | 57 | |||||
| Eligible to expire from housing programs between 2029 and 2038 (units) | 2,537 | |||||
| Eligible to expire from housing programs in 2039 and later (properties) | 73 | |||||
| Eligible to expire from housing programs in 2039 and later (units) | 4,030 | |||||
| Indicator | 2000 | 2006 | 2010 | 2019 | 2021 | 2022 |
|---|---|---|---|---|---|---|
| Density | ||||||
| Population density (1,000 persons per square mile) info | 28.1 | 31.9 | 29.9 | 32.5 | ||
| Development | ||||||
| Units authorized by new residential building permits | 136 | 0 | 110 | 479 | 129 | 78 |
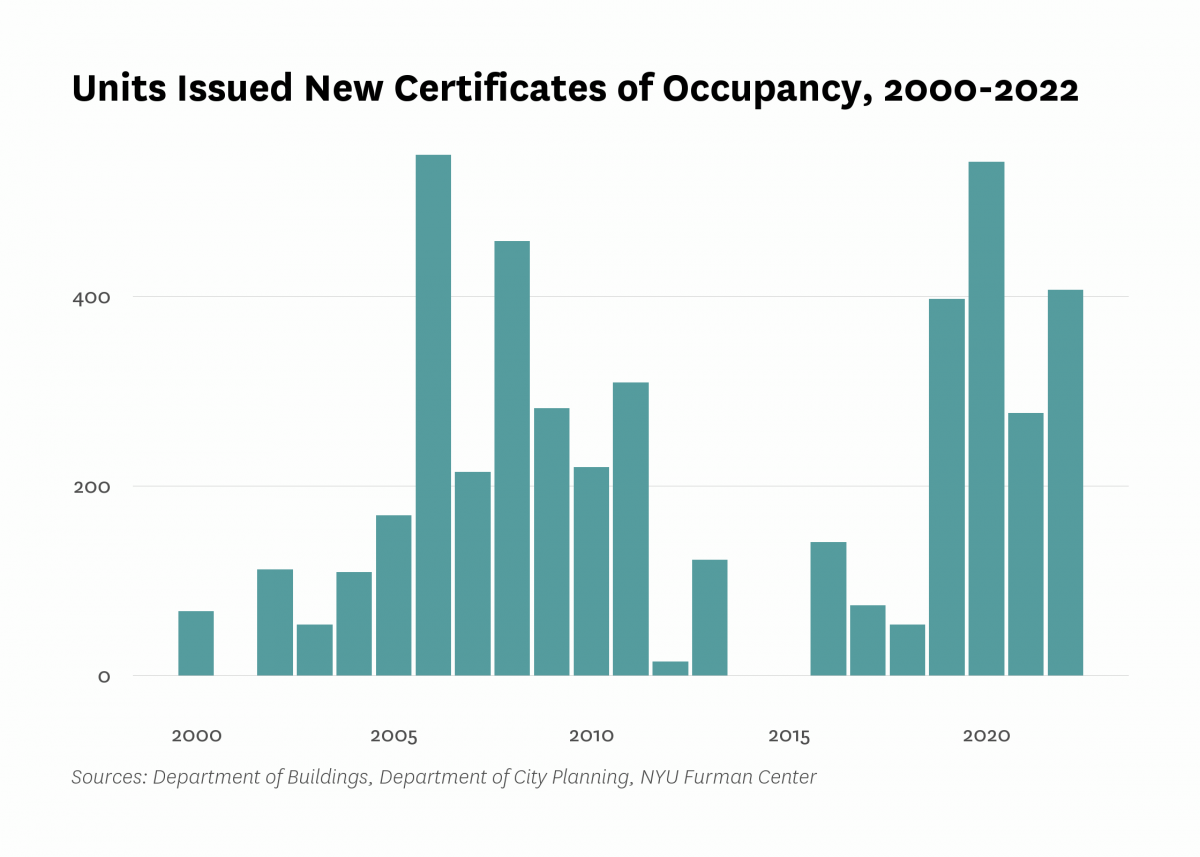
| Units issued new certificates of occupancy | 68 | 549 | 220 | 397 | 277 | 407 |
| Indicator | 2000 | 2006 | 2010 | 2019 | 2021 | 2022 |
|---|---|---|---|---|---|---|
| Commute | ||||||
| Car-free commute (% of commuters) info | 74.5% | 79.5% | 85.9% | 77.2% | ||
| Mean travel time to work (minutes) | 41.3 | 43.0 | 42.6 | 41.8 | ||
| Crime and Incarceration | ||||||
| Serious crime rate (per 1,000 residents) | 25.6 | 24.6 | 17.9 | 21.6 | 27.9 | |
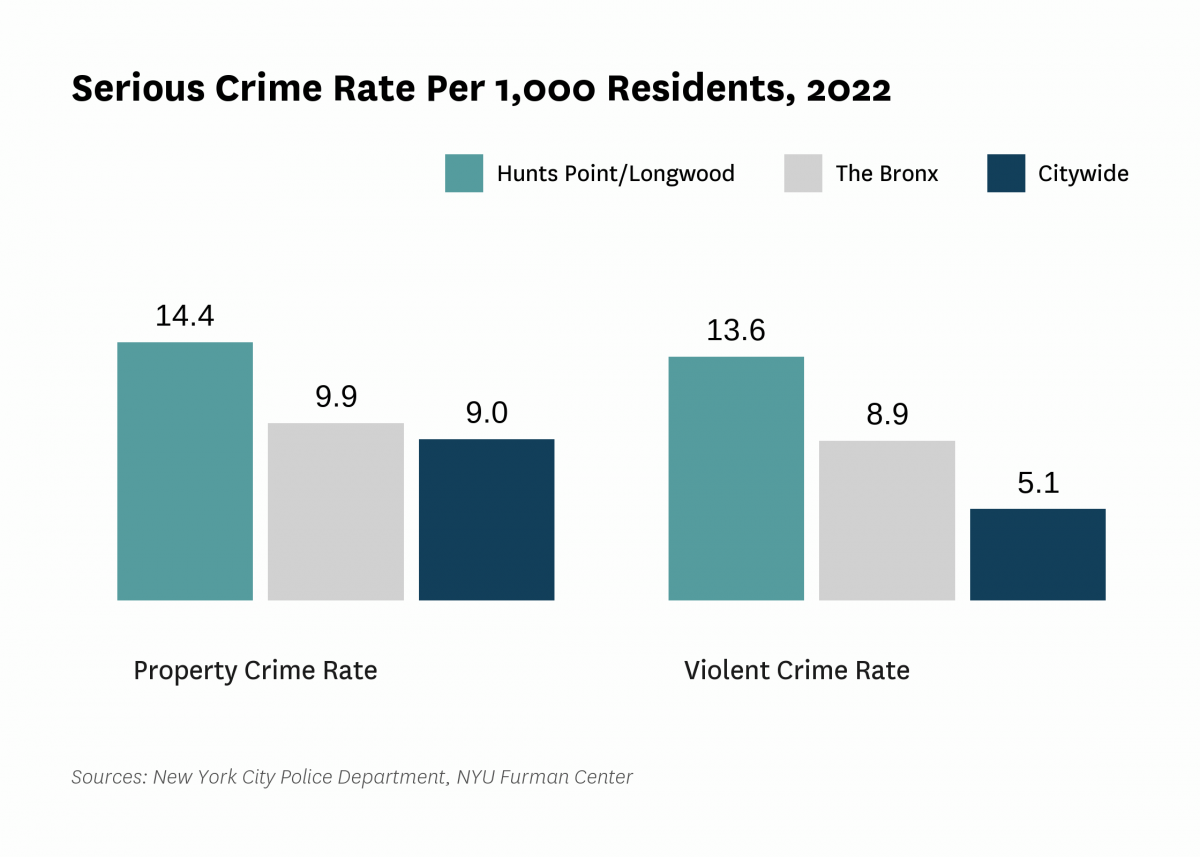
| Serious crime rate, property (per 1,000 residents) | 13.0 | 10.8 | 9.4 | 11.5 | 14.4 | |
| Serious crime rate, violent (per 1,000 residents) | 12.6 | 13.8 | 8.5 | 10.2 | 13.6 | |
| Schools | ||||||
| Students performing at grade level in English language arts, 4th grade | 25.2% | 15.1% | ||||
| Students performing at grade level in math, 4th grade | 23.4% | 12.5% | ||||
| Indicator | 2000 | 2006 | 2010 | 2019 | 2021 | 2022 |
|---|---|---|---|---|---|---|
| Median Rent | ||||||
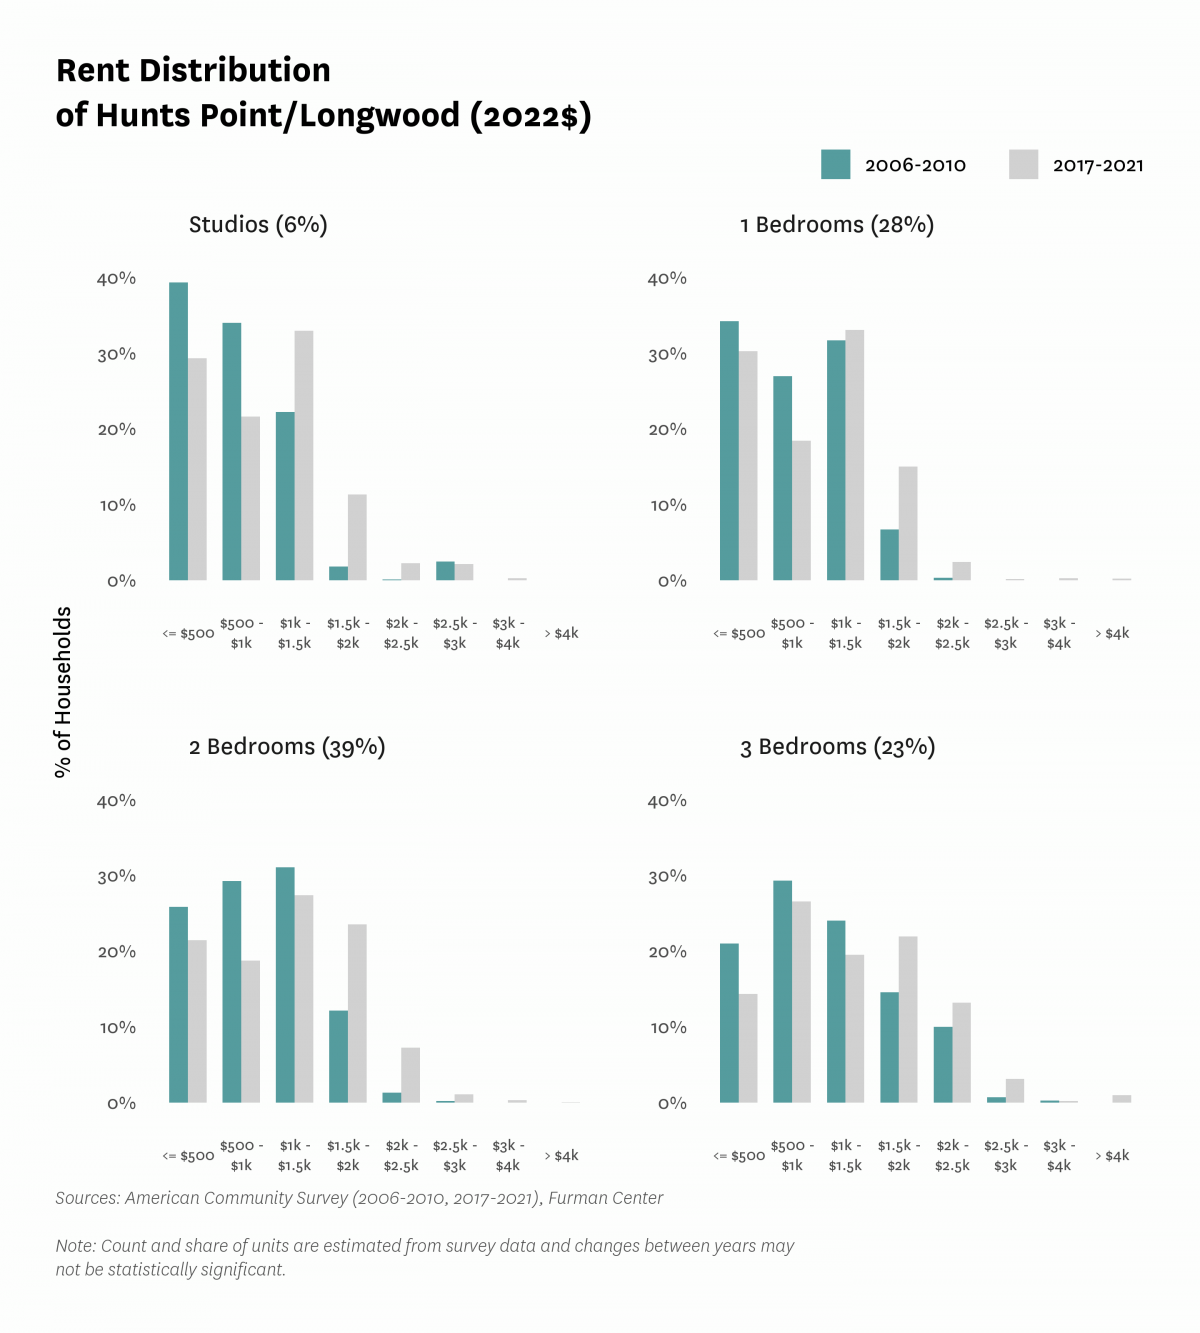
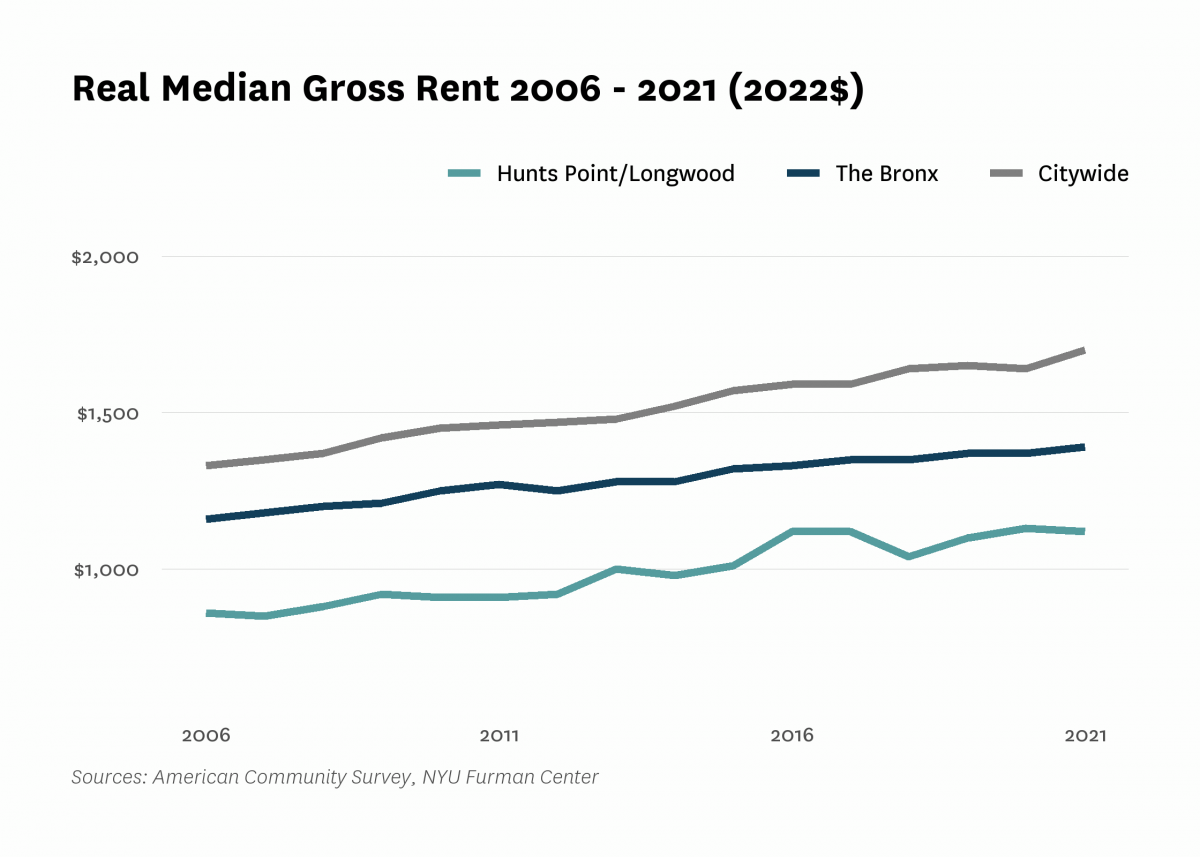
| Median rent, 2- and 3-bedrooms (2022$) info | $960 | $1,100 | $1,240 | |||
| Median rent, all (2022$) info | $650 | $860 | $910 | $1,100 | $1,120 | |
| Median rent, recent movers (2022$) info | $1,070 | $1,110 | $1,370 | |||
| Median rent, studios and 1-bedrooms (2022$) info | $800 | $860 | $1,020 | |||
| Change in collected rent (2019-2020) | 5.1% | |||||
| Affordability | ||||||
| Rental units affordable at 30% AMI (% of recently available units) | 23.4% | 36.1% | 29.9% | |||
| Rental units affordable at 80% AMI (% of recently available units) | 92.2% | 91.6% | 89.5% | |||
| Rental units affordable at 120% AMI (% of recently available units) | 99.3% | 99.6% | 98.9% | |||
| Rent Burden | ||||||
| Moderately rent-burdened households info | 23.0% | 25.6% | 31.4% | 25.5% | ||
| Moderately rent-burdened households, low income info | 27.1% | 29.5% | 29.6% | |||
| Moderately rent-burdened households, moderate income info | 2.3% | 4.5% | 4.8% | |||
| Severely rent-burdened households info | 24.8% | 32.2% | 33.5% | 36.5% | ||
| Severely rent-burdened households, low income info | 35.1% | 38.3% | 41.1% | |||
| Severely rent-burdened households, moderate income info | 0.0% | 0.0% | 0.0% | |||
| Rental Subsidy | ||||||
| Housing choice vouchers (% of occupied, privately owned rental units) info | 15.8% | 17.7% | ||||
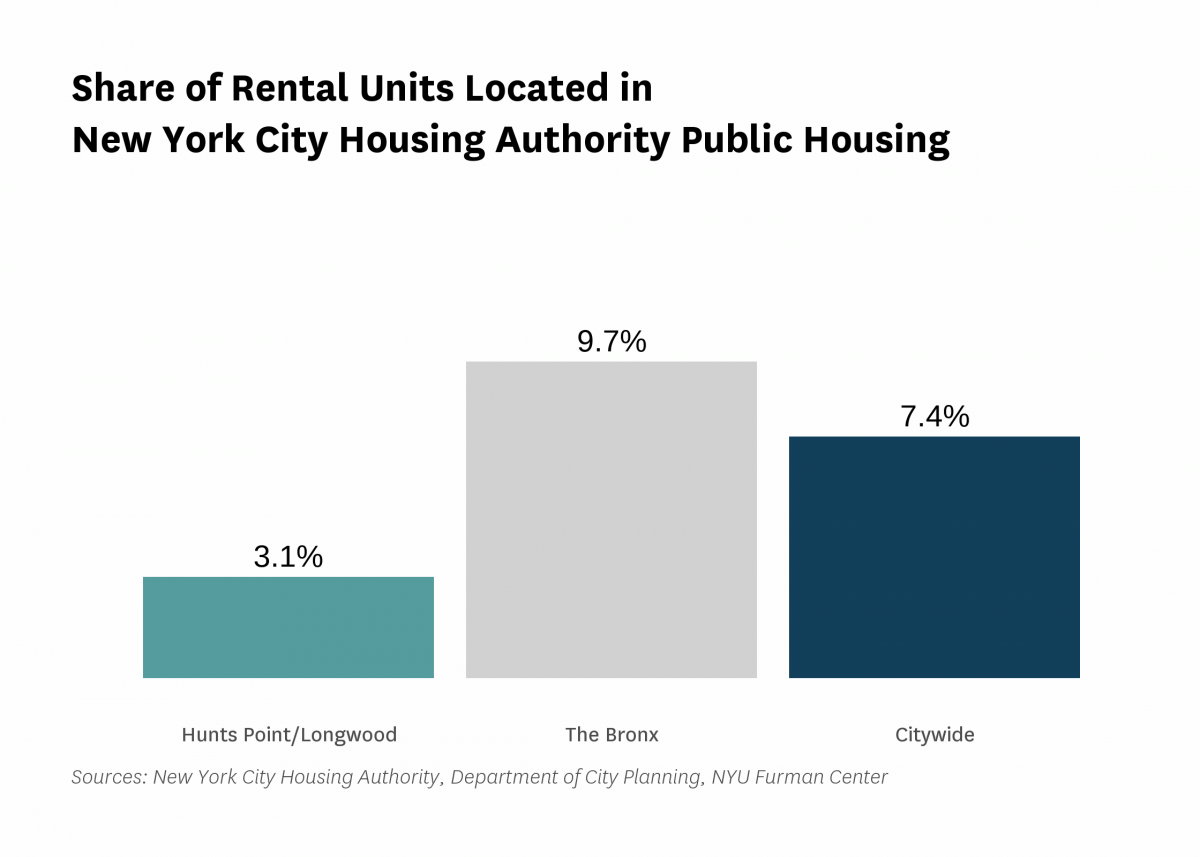
| Public housing (% of rental units) info | 3.1% | |||||
Data Notes: Community districts BX01 and BX02 both fall within sub-borough area 201. Data reported at the sub-borough level are identical. See CoreData User Guide for more information about indicator definitions and methods.
Indicators: The rental vacancy rate, severe crowding rate, and the severely rent-burdened households indicators use five-year American Community Survey (ACS) estimates. Data under the 2010 heading comes from the 2006 – 2010 ACS, data under the 2019 heading comes from the 2015 – 2019 ACS and data under the 2021 heading comes from 2017 – 2021 ACS .
All content © 2005 – 2024 Furman Center for Real Estate and Urban Policy | Top of page | Contact Us