| Indicator | 2000 | 2006 | 2010 | 2019 | 2021 | 2022 |
|---|---|---|---|---|---|---|
| Population | ||||||
| Born in New York State info | 38.8% | 34.7% | 37.2% | 38.5% | ||
| Disabled population info | 3.1% | 2.9% | 3.1% | |||
| Foreign-born population info | 23.3% | 25.9% | 23.1% | 22.6% | 22.7% | |
| Population info | 125,567 | 147,198 | 144,944 | 164,514 | 146,667 | |
| Population aged 65+ info | 10.5% | 9.8% | 11.2% | 13.5% | 17.6% | |
| Households | ||||||
| Households with children under 18 years old info | 11.4% | 13.9% | 12.7% | 15.3% | 12.9% | |
| Single-person households info | 51.4% | 49.4% | 48.0% | 51.0% | ||
| Race and Ethnicity | ||||||
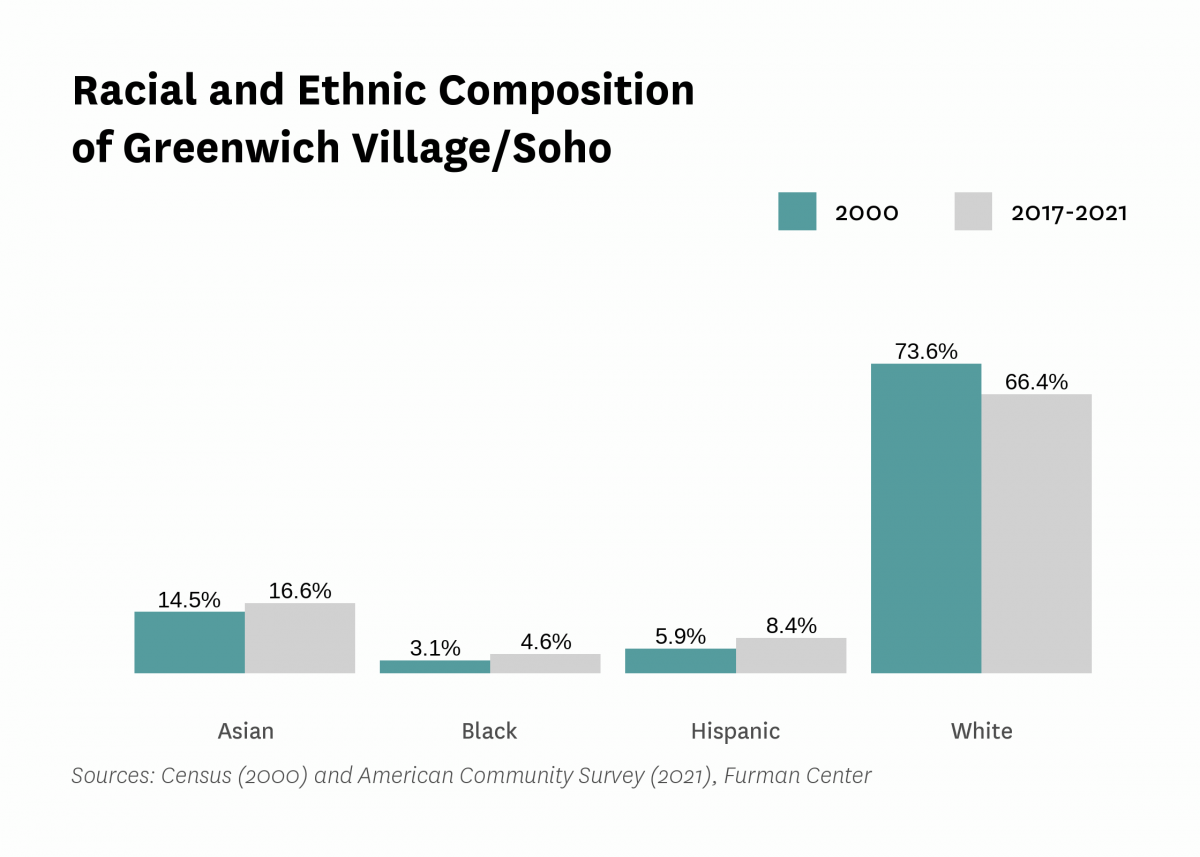
| Percent Asian info | 14.5% | 19.2% | 14.6% | 13.8% | 16.6% | |
| Percent Black info | 3.1% | 2.7% | 2.4% | 3.4% | 4.6% | |
| Percent Hispanic info | 5.9% | 4.9% | 5.6% | 11.4% | 8.4% | |
| Percent white info | 73.6% | 71.5% | 73.2% | 68.4% | 66.4% | |
| Racial diversity index info | 0.43 | 0.45 | 0.44 | 0.50 | 0.52 | |
| Income and Poverty | ||||||
| Income diversity ratio info | 6.7 | 6.0 | 5.0 | 6.5 | ||
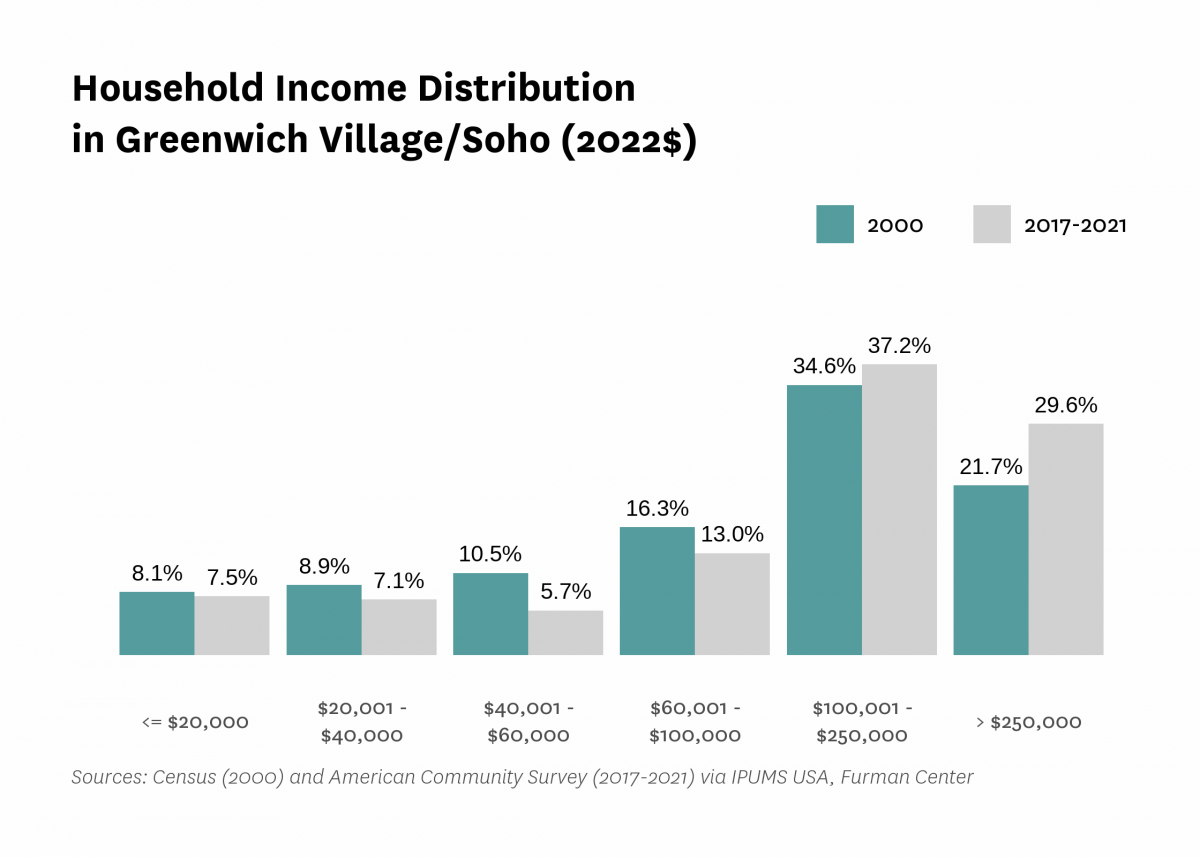
| Median household income (2022$) info | $121,250 | $133,320 | $131,490 | $180,730 | $151,240 | |
| Median household income, homeowners (2022$) info | $213,370 | $198,610 | $251,930 | $161,690 | ||
| Median household income, renters (2022$) info | $110,760 | $118,740 | $152,170 | $140,300 | ||
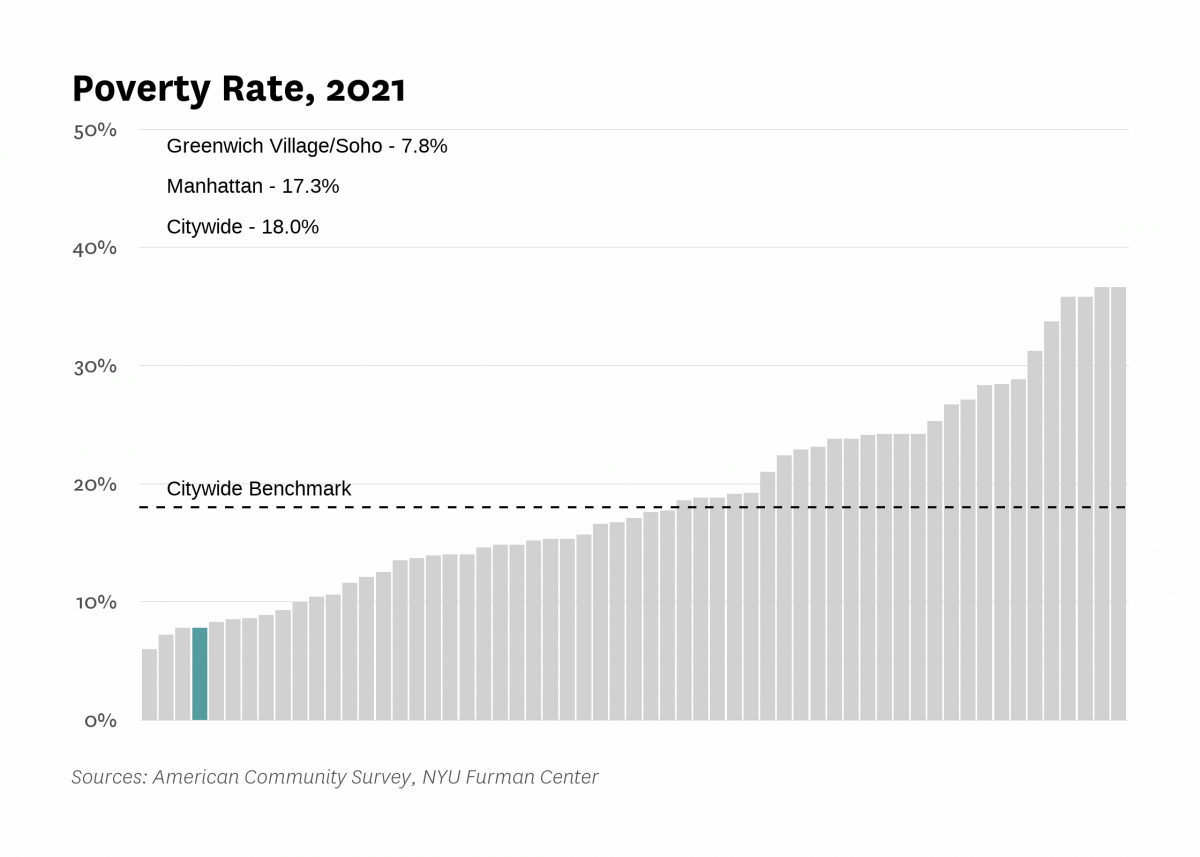
| Poverty rate info | 9.9% | 11.9% | 9.9% | 6.1% | 7.8% | |
| Poverty rate, population aged 65+ info | 23.4% | 8.7% | 8.7% | 13.3% | ||
| Poverty rate, population under 18 years old info | 15.3% | 7.5% | 3.8% | 3.6% | ||
| Labor Market | ||||||
| Labor force participation rate info | 75.5% | 77.6% | 76.6% | 74.6% | ||
| Population aged 25+ without a high school diploma info | 7.5% | 5.2% | 2.9% | 2.4% | ||
| Unemployment rate info | 5.78% | 4.77% | 6.08% | 4.32% | 5.41% | |
| Indicator | 2000 | 2006 | 2010 | 2019 | 2021 | 2022 |
|---|---|---|---|---|---|---|
| Housing Stock | ||||||
| Homeownership rate info | 25.9% | 29.8% | 25.3% | 31.6% | 34.6% | |
| Housing units info | 81,238 | 89,353 | 95,498 | 97,721 | ||
| Rental vacancy rate info | 5.0% | 4.7% | 5.6% | |||
| Serious housing code violations (per 1,000 privately owned rental units) | 22.6 | 13.9 | 29.9 | 29.6 | 39.1 | |
| Severe crowding rate (% of renter households) info | 3.2% | 4.1% | 3.1% | |||
| Total housing code violations (per 1,000 privately owned rental units) | 95.3 | 79.5 | 115.6 | 157.9 | 161.4 | |
| Finance - Distress | ||||||
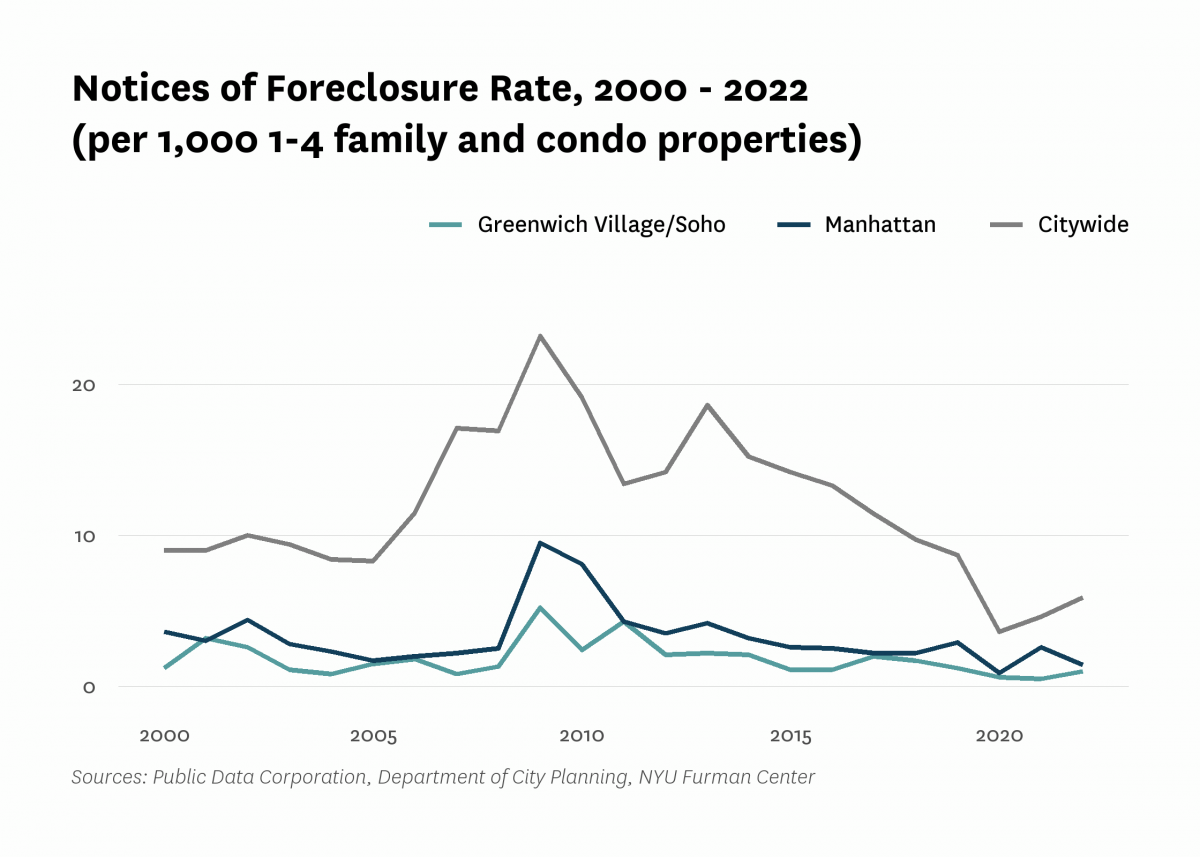
| Notices of foreclosure rate (per 1,000 1-4 family and condo properties) | 1.2 | 1.8 | 2.4 | 1.2 | 0.5 | 1.0 |
| Notices of foreclosure, all residential properties | 4 | 11 | 21 | 10 | 6 | 20 |
| Notices of foreclosure, initial, 1-4 family and condo properties | 3 | 8 | 14 | 5 | 2 | 6 |
| Notices of foreclosure, repeat, 1-4 family and condo properties | 1 | 3 | 3 | 4 | 2 | 2 |
| Pre-foreclosure notice rate (per 1,000 1-4 family and condo properties) | 11.5 | 8.0 | 14.8 | |||
| Pre-foreclosure notices, 1-4 family and condo properties | 87 | 66 | 123 | |||
| Properties entering REO, 1-4 family | 0 | 0 | 0 | |||
| Finance - Lending | ||||||
| FHA/VA-backed home purchase loans (% of home purchase loans) | 0.0% | 0.3% | 0.0% | 0.0% | ||
| Higher-cost home purchase loans (% of home purchase loans) | 1.8% | 1.2% | 0.5% | 0.6% | ||
| Higher-cost refinance loans (% of refinance loans) | 6.0% | 0.5% | 0.9% | 0.3% | ||
| Home purchase loan rate (per 1,000 properties) | 50.1 | 23.9 | 23.5 | 39.7 | ||
| Home purchase loans in LMI tracts (% of home purchase loans) | 3.4% | 0.3% | 1.0% | 1.5% | ||
| Home purchase loans to LMI borrowers (% of home purchase loans) | 1.3% | 0.8% | 0.6% | 0.4% | ||
| Refinance loan rate (per 1,000 properties) | 14.8 | 31.9 | 24.4 | 35.0 | ||
| Sales - Volume | ||||||
| Sales volume, 1 family building | 6 | 13 | 15 | 14 | 16 | 23 |
| Sales volume, 2-4 family building | 22 | 17 | 11 | 19 | 8 | 22 |
| Sales volume, 5+ family building | 26 | 62 | 23 | 32 | 49 | 43 |
| Sales volume, condominium | 217 | 429 | 477 | 370 | 709 | 444 |
| Sales volume, all property types | 271 | 521 | 526 | 435 | 782 | 532 |
| Sales - Median Prices | ||||||
| Median sales price per unit, 1 family building (2022$) | $2,719,040 | $7,096,570 | $8,775,120 | $11,707,050 | $10,451,100 | $8,250,000 |
| Median sales price per unit, 2-4 family building (2022$) | $1,826,860 | $2,388,940 | $1,255,430 | $2,527,240 | $2,788,510 | $3,408,330 |
| Median sales price per unit, 5+ family building (2022$) | $374,810 | $407,230 | $772,570 | $753,680 | $701,460 | $677,780 |
| Median sales price per unit, condominium (2022$) | $1,147,100 | $1,772,030 | $2,240,460 | $2,935,130 | $2,515,150 | $2,912,500 |
| Sales - Housing Price Index | ||||||
| Index of housing price appreciation, 1 family building | 100.0 | 185.2 | 252.9 | 295.9 | 259.0 | 334.0 |
| Index of housing price appreciation, 2-4 family building | 100.0 | 114.7 | 129.1 | 292.5 | 259.1 | 286.7 |
| Index of housing price appreciation, 5+ family building | 100.0 | 213.9 | 243.8 | 641.3 | 390.5 | 658.2 |
| Index of housing price appreciation, condominium | 100.0 | 216.4 | 210.8 | 284.8 | 294.7 | 331.6 |
| Index of housing price appreciation, all property types | 100.0 | 210.3 | 208.6 | 294.8 | 292.9 | 335.1 |
| Subsidized Housing | ||||||
| Total number of subsidized properties (properties) | 21 | |||||
| HUD Financing or Insurance (properties) | 1 | |||||
| HUD Financing or Insurance (units) | 152 | |||||
| HUD Project-based Rental Assistance Program (properties) | 2 | |||||
| HUD Project-based Rental Assistance Program (units) | 536 | |||||
| Low Income Housing Tax Credit (properties) | 5 | |||||
| Low Income Housing Tax Credit (units) | 395 | |||||
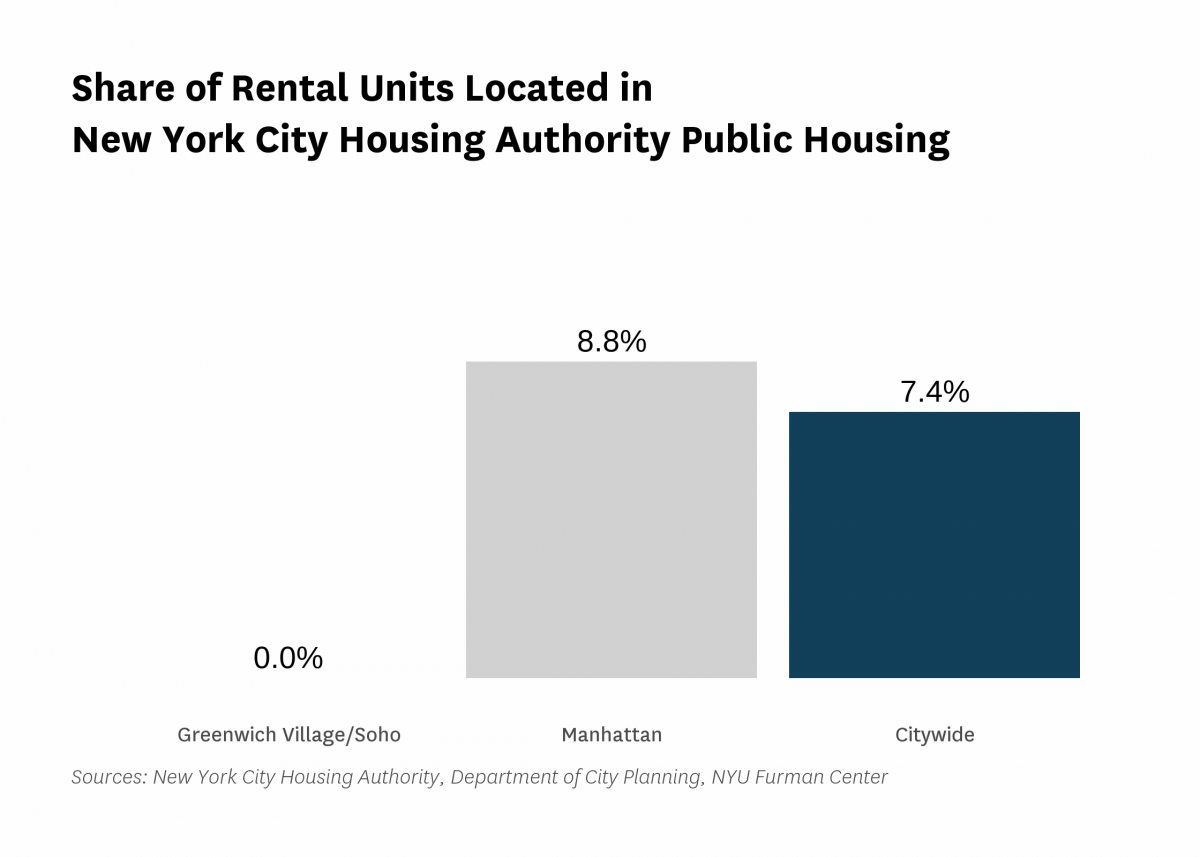
| Public Housing (properties) | 0 | |||||
| Public Housing (units) | 0 | |||||
| Mitchell-Lama (properties) | 2 | |||||
| Mitchell-Lama (units) | 174 | |||||
| 421-a Tax Exemption (properties) | 7 | |||||
| 421-a Tax Exemption (units) | 562 | |||||
| 420-c Tax Exemption (properties) | 0 | |||||
| 420-c Tax Exemption (units) | 0 | |||||
| NYC Housing Production Programs and Zoning Incentives or Requirements (properties) | 10 | |||||
| Eligible to expire from housing programs between 2023 and 2028 (properties) | 2 | |||||
| Eligible to expire from housing programs between 2023 and 2028 (units) | 148 | |||||
| Eligible to expire from housing programs between 2029 and 2038 (properties) | 4 | |||||
| Eligible to expire from housing programs between 2029 and 2038 (units) | 604 | |||||
| Eligible to expire from housing programs in 2039 and later (properties) | 3 | |||||
| Eligible to expire from housing programs in 2039 and later (units) | 353 | |||||
| Indicator | 2000 | 2006 | 2010 | 2019 | 2021 | 2022 |
|---|---|---|---|---|---|---|
| Density | ||||||
| Population density (1,000 persons per square mile) info | 50.9 | 50.2 | 56.9 | 50.8 | ||
| Development | ||||||
| Units authorized by new residential building permits | 31 | 0 | 0 | 49 | 125 | 26 |
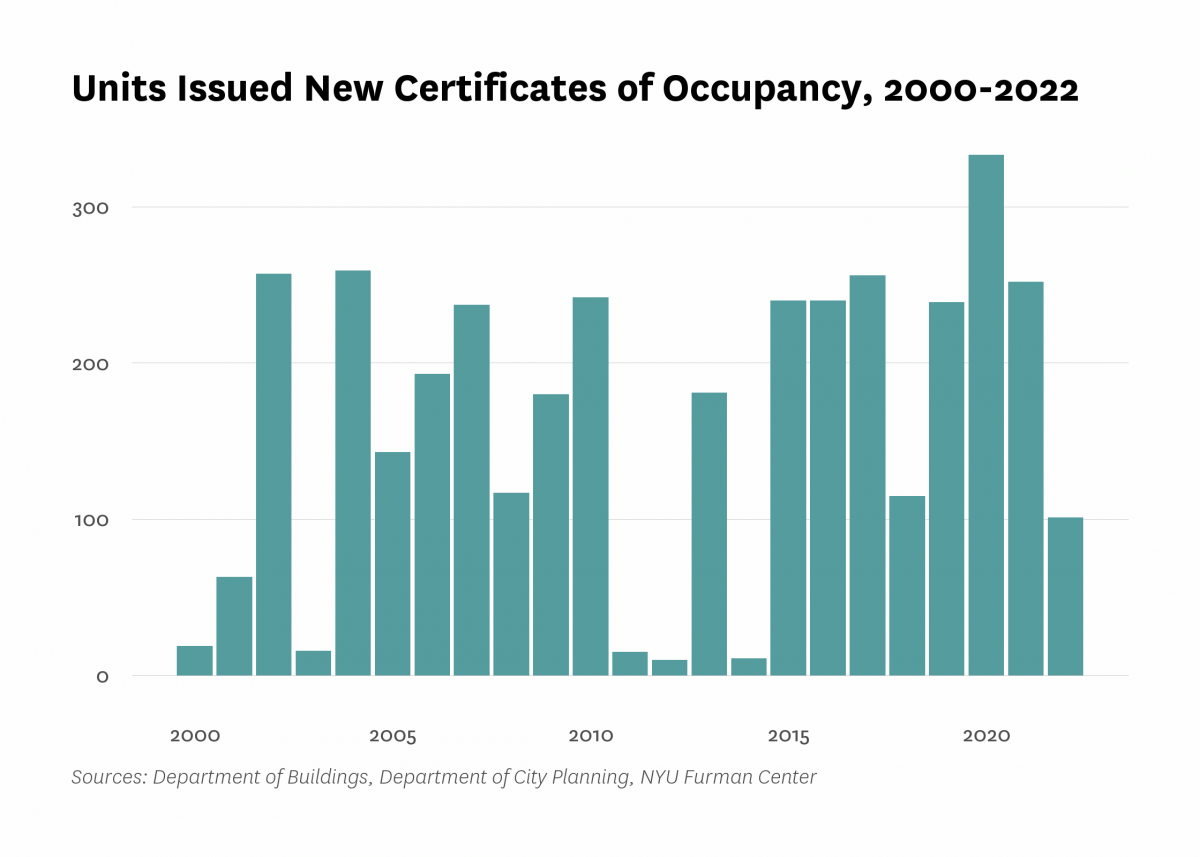
| Units issued new certificates of occupancy | 19 | 193 | 242 | 239 | 252 | 101 |
| Indicator | 2000 | 2006 | 2010 | 2019 | 2021 | 2022 |
|---|---|---|---|---|---|---|
| Commute | ||||||
| Car-free commute (% of commuters) info | 85.9% | 84.5% | 88.3% | 88.5% | 88.6% | |
| Mean travel time to work (minutes) | 24.4 | 26.1 | 24.3 | 26.3 | 25.6 | |
| Crime and Incarceration | ||||||
| Serious crime rate (per 1,000 residents) | 34.5 | 29.3 | 27.1 | 27.3 | 40.4 | |
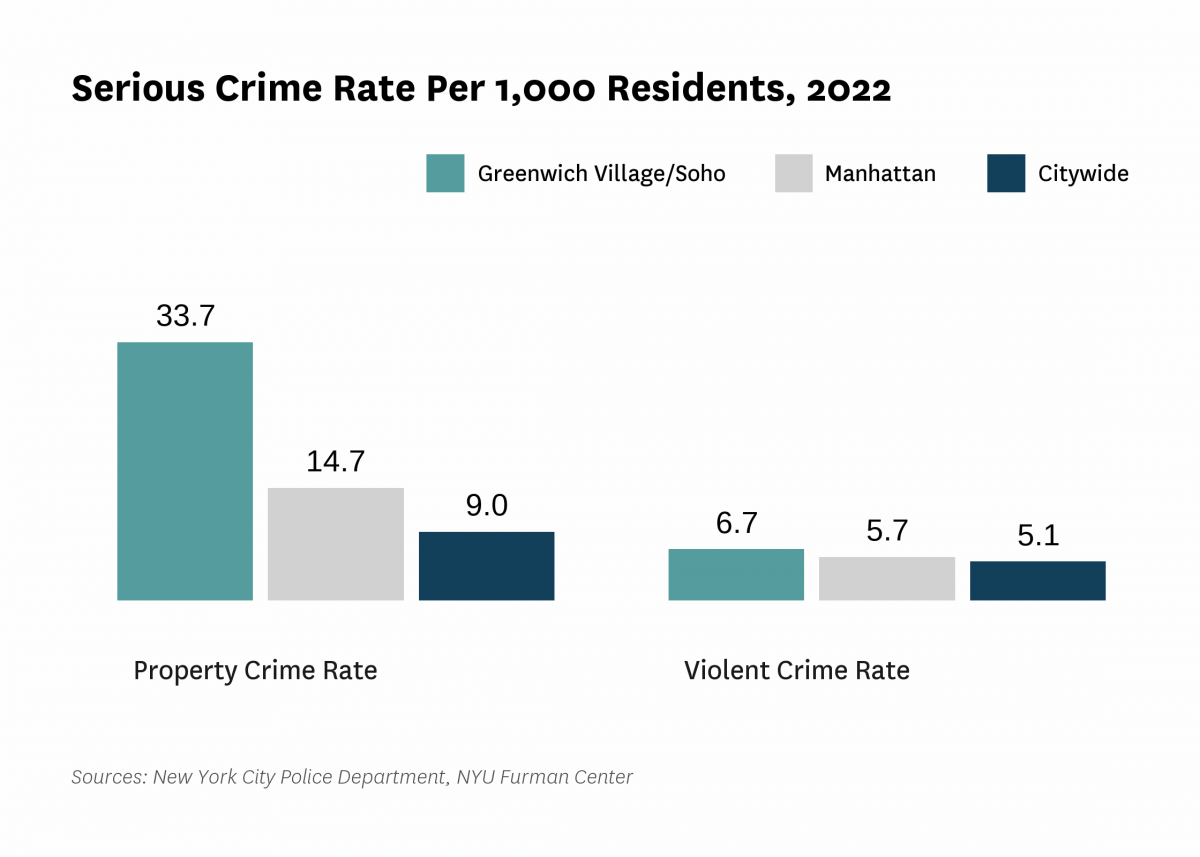
| Serious crime rate, property (per 1,000 residents) | 29.3 | 25.2 | 22.7 | 21.9 | 33.7 | |
| Serious crime rate, violent (per 1,000 residents) | 5.2 | 4.1 | 4.5 | 5.4 | 6.7 | |
| Schools | ||||||
| Students performing at grade level in English language arts, 4th grade | 80.3% | 78.1% | ||||
| Students performing at grade level in math, 4th grade | 85.8% | 83.5% | ||||
| Indicator | 2000 | 2006 | 2010 | 2019 | 2021 | 2022 |
|---|---|---|---|---|---|---|
| Median Rent | ||||||
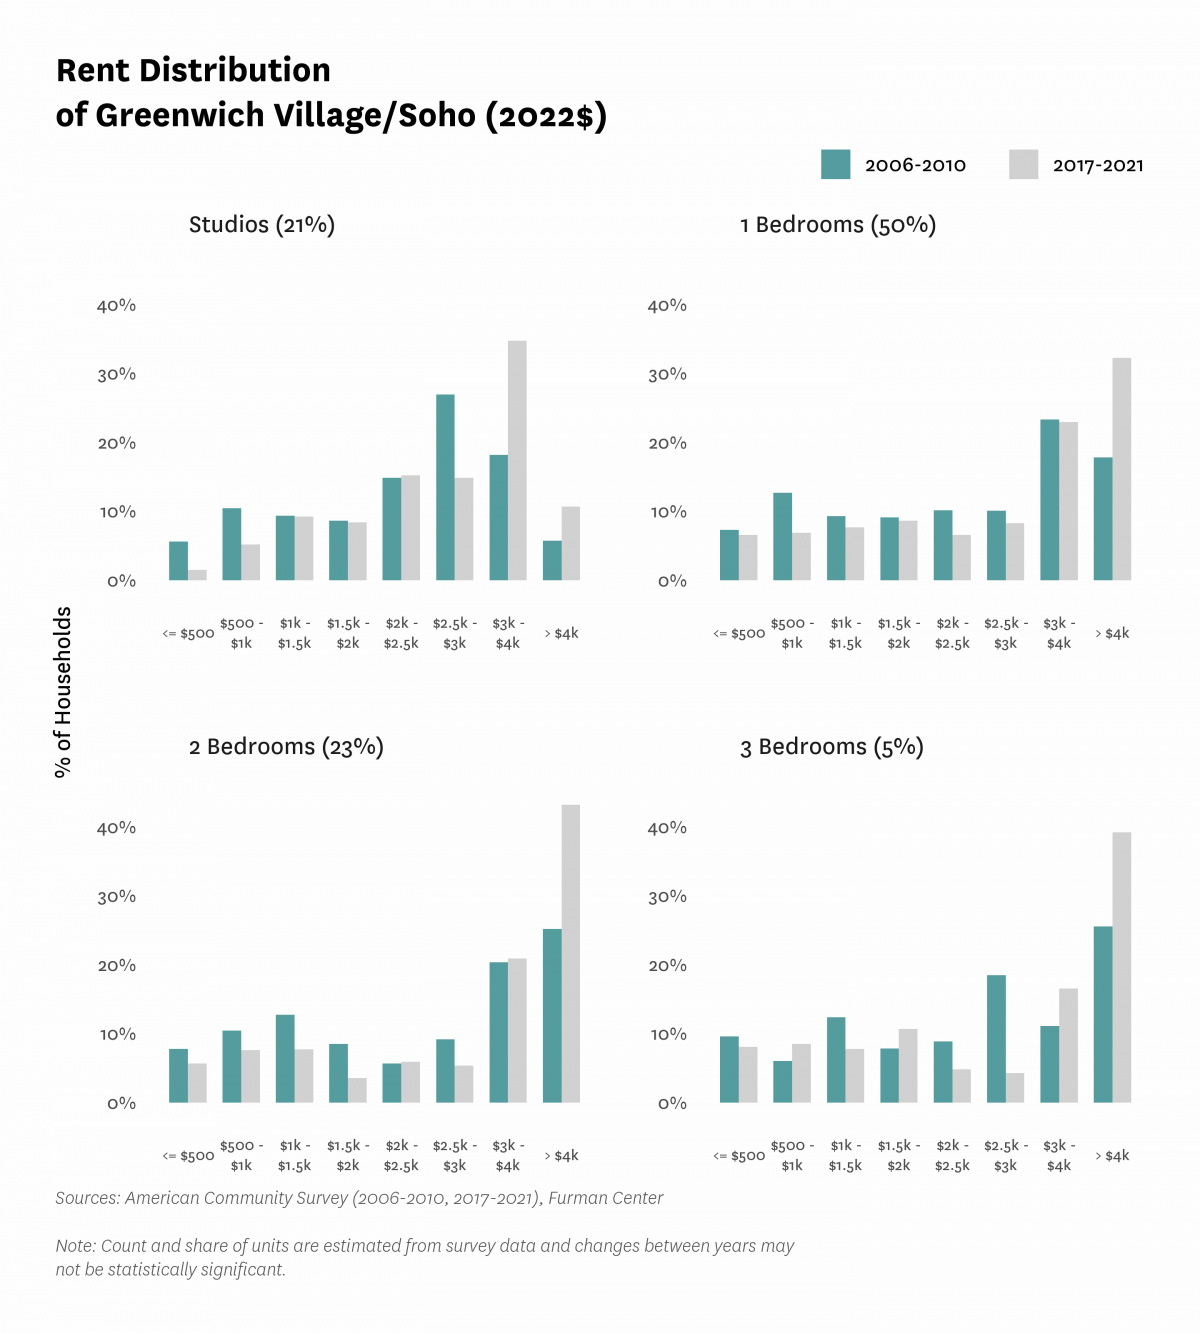
| Median rent, 2- and 3-bedrooms (2022$) info | $2,830 | $3,100 | $3,790 | |||
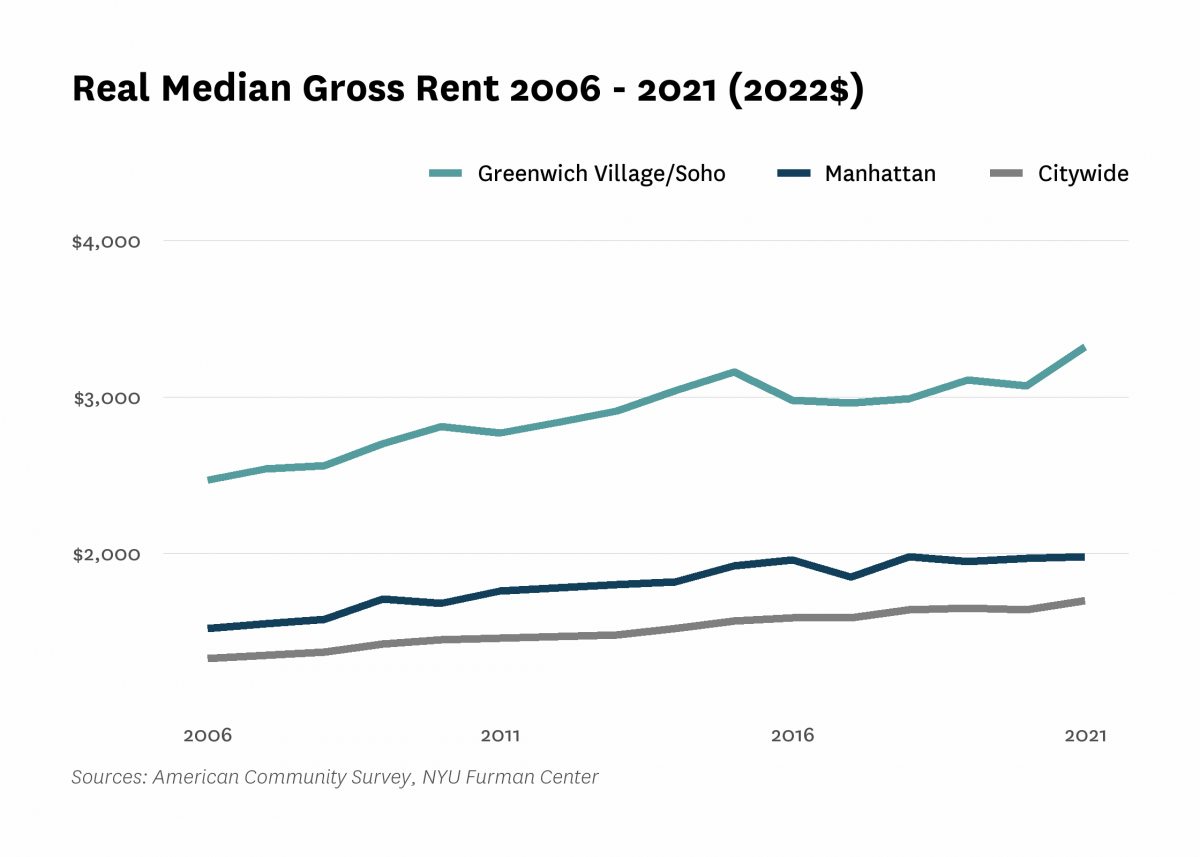
| Median rent, all (2022$) info | $1,980 | $2,470 | $2,810 | $3,110 | $3,320 | |
| Median rent, recent movers (2022$) info | $3,190 | $3,220 | $3,620 | |||
| Median rent, studios and 1-bedrooms (2022$) info | $2,590 | $2,900 | $3,100 | |||
| Change in collected rent (2019-2020) | -3.0% | |||||
| Affordability | ||||||
| Rental units affordable at 30% AMI (% of recently available units) | 1.5% | 4.7% | 3.9% | |||
| Rental units affordable at 80% AMI (% of recently available units) | 10.8% | 20.4% | 13.2% | |||
| Rental units affordable at 120% AMI (% of recently available units) | 22.3% | 39.7% | 31.3% | |||
| Rent Burden | ||||||
| Moderately rent-burdened households info | 20.6% | 20.3% | 20.8% | 21.5% | ||
| Moderately rent-burdened households, low income info | 21.7% | 24.1% | 24.5% | |||
| Moderately rent-burdened households, moderate income info | 36.5% | 49.1% | 44.5% | |||
| Severely rent-burdened households info | 19.3% | 22.0% | 16.6% | 16.5% | ||
| Severely rent-burdened households, low income info | 60.2% | 56.9% | 57.5% | |||
| Severely rent-burdened households, moderate income info | 28.0% | 14.5% | 18.3% | |||
| Rental Subsidy | ||||||
| Housing choice vouchers (% of occupied, privately owned rental units) info | 1.0% | 0.6% | ||||
| Public housing (% of rental units) info | 0.0% | |||||
Data Notes: Community districts MN01 and MN02 both fall within sub-borough area 101. Data reported at the sub-borough level are identical. See CoreData User Guide for more information about indicator definitions and methods.
Indicators: The rental vacancy rate, severe crowding rate, and the severely rent-burdened households indicators use five-year American Community Survey (ACS) estimates. Data under the 2010 heading comes from the 2006 – 2010 ACS, data under the 2019 heading comes from the 2015 – 2019 ACS and data under the 2021 heading comes from 2017 – 2021 ACS .
All content © 2005 – 2024 Furman Center for Real Estate and Urban Policy | Top of page | Contact Us