| Indicator | 2000 | 2006 | 2010 | 2019 | 2021 | 2022 |
|---|---|---|---|---|---|---|
| Population | ||||||
| Born in New York State | 50.8% | 52.0% | 47.4% | 43.1% | ||
| Disabled population | 5.0% | 4.9% | 6.6% | |||
| Foreign-born population | 33.5% | 29.1% | 25.8% | 24.2% | 23.6% | |
| Population | 142,098 | 141,513 | 146,253 | 151,308 | 159,580 | |
| Population aged 65+ | 9.9% | 12.5% | 9.1% | 10.3% | 8.7% | |
| Households | ||||||
| Households with children under 18 years old | 35.0% | 24.2% | 25.2% | 20.7% | 19.3% | |
| Single-person households | 35.0% | 31.3% | 29.6% | 32.4% | ||
| Race and Ethnicity | ||||||
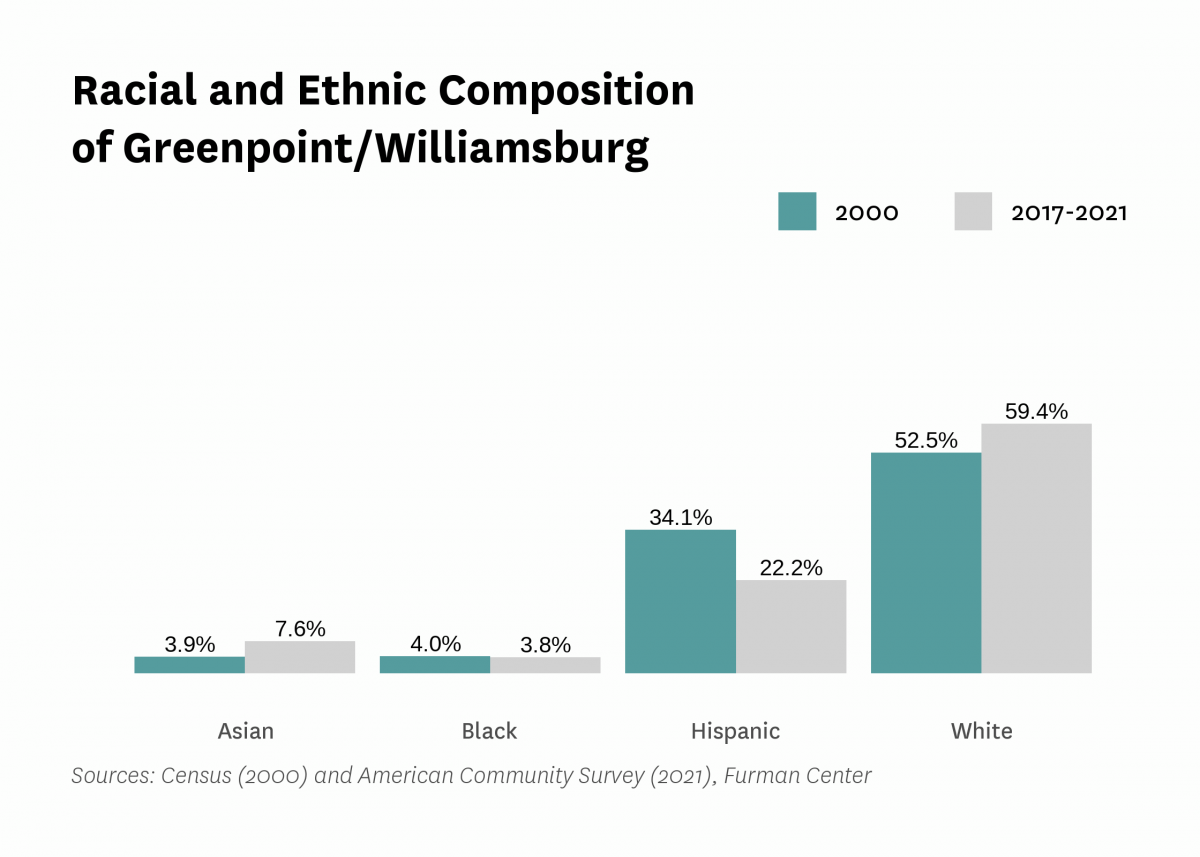
| Percent Asian | 3.9% | 5.2% | 5.2% | 6.6% | 7.6% | |
| Percent Black | 4.0% | 2.3% | 2.6% | 4.5% | 3.8% | |
| Percent Hispanic | 34.1% | 26.8% | 30.0% | 25.0% | 22.2% | |
| Percent white | 52.5% | 64.0% | 60.7% | 61.3% | 59.4% | |
| Racial diversity index | 0.61 | 0.52 | 0.54 | 0.56 | 0.59 | |
| Income and Poverty | ||||||
| Income diversity ratio | 7.0 | 6.5 | 6.9 | 8.5 | ||
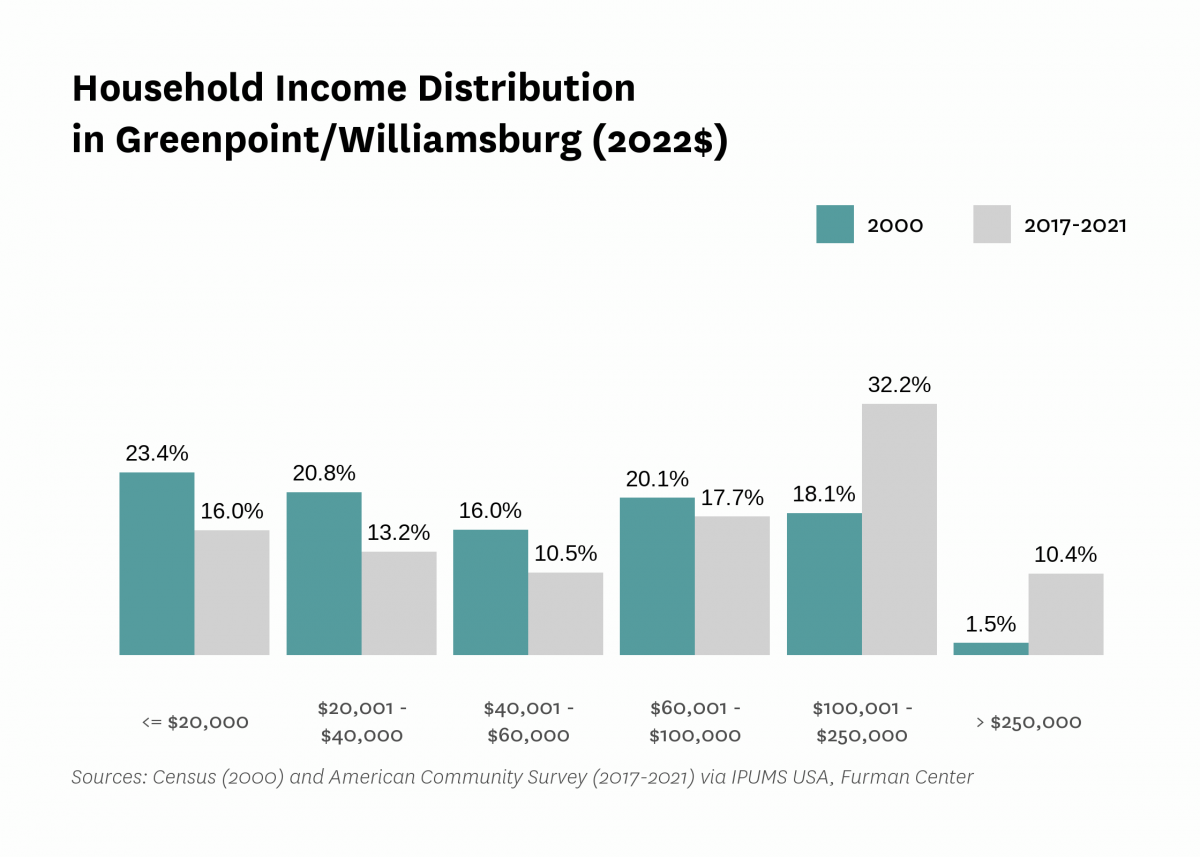
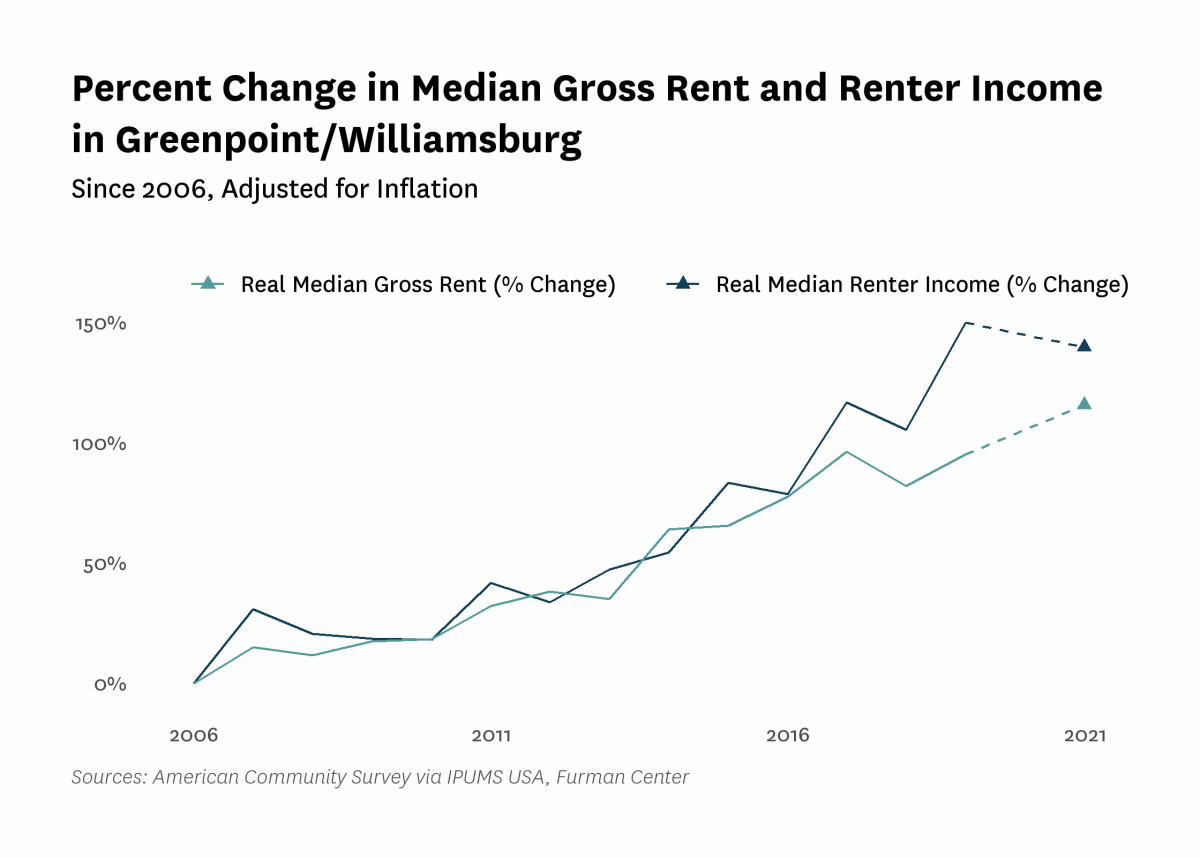
| Median household income (2022$) | $47,310 | $45,400 | $53,920 | $109,580 | $107,630 | |
| Median household income, homeowners (2022$) | $71,900 | $93,150 | $152,740 | $148,380 | ||
| Median household income, renters (2022$) | $40,380 | $47,750 | $100,920 | $96,820 | ||
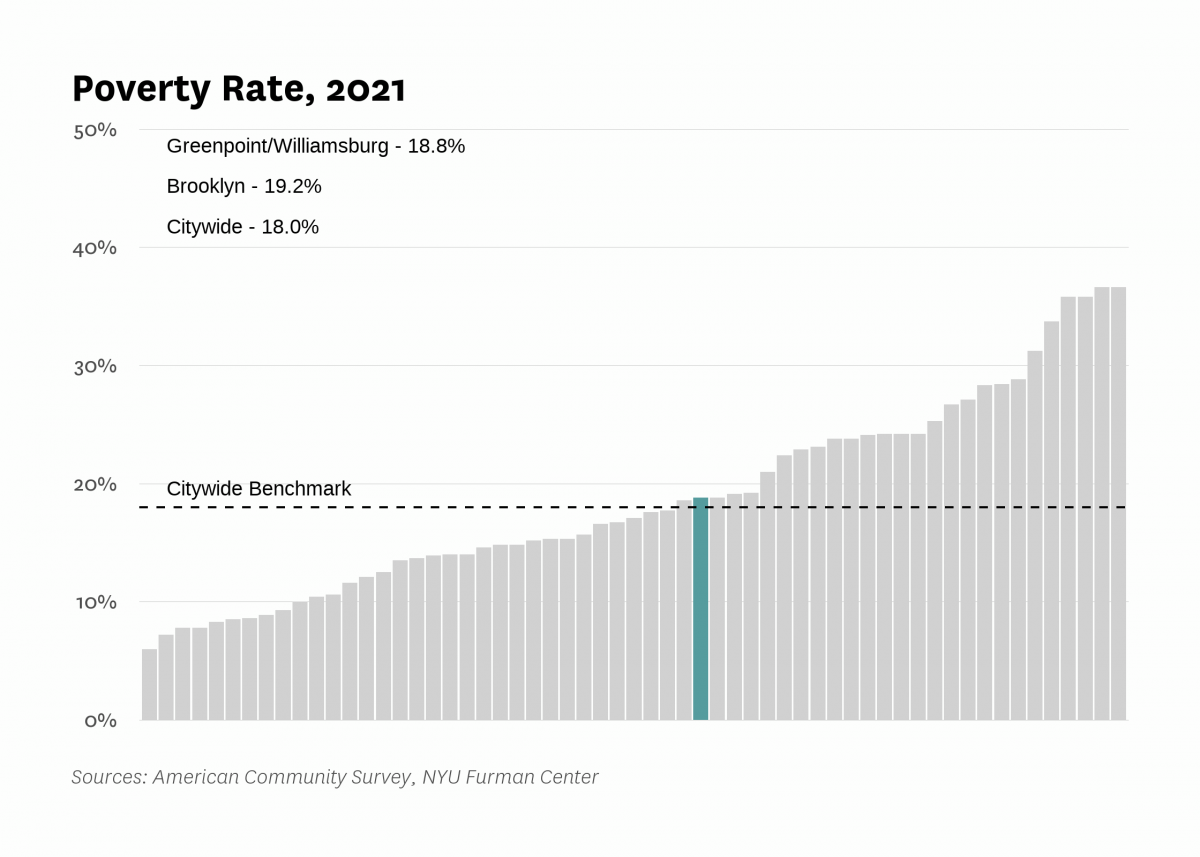
| Poverty rate | 33.8% | 35.2% | 26.5% | 20.1% | 18.8% | |
| Poverty rate, population aged 65+ | 26.5% | 28.7% | 19.2% | 33.7% | ||
| Poverty rate, population under 18 years old | 58.2% | 40.9% | 45.2% | 33.3% | ||
| Labor Market | ||||||
| Labor force participation rate | 57.7% | 66.4% | 73.9% | 77.4% | ||
| Population aged 25+ without a high school diploma | 32.7% | 21.1% | 15.5% | 10.7% | ||
| Unemployment rate | 9.77% | 6.13% | 8.20% | 3.99% | 10.95% | |
| Indicator | 2000 | 2006 | 2010 | 2019 | 2021 | 2022 |
|---|---|---|---|---|---|---|
| Housing Stock | ||||||
| Homeownership rate | 14.5% | 18.1% | 17.7% | 17.7% | 14.6% | |
| Housing units | 55,769 | 65,586 | 69,661 | 77,305 | ||
| Rental vacancy rate | 3.0% | 2.8% | 2.7% | |||
| Serious housing code violations (per 1,000 privately owned rental units) | 23.3 | 29.3 | 45.0 | 38.9 | 44.1 | |
| Severe crowding rate (% of renter households) | 9.7% | 3.6% | 3.6% | |||
| Total housing code violations (per 1,000 privately owned rental units) | 130.3 | 131.3 | 197.5 | 244.2 | 227.9 | |
| Finance - Distress | ||||||
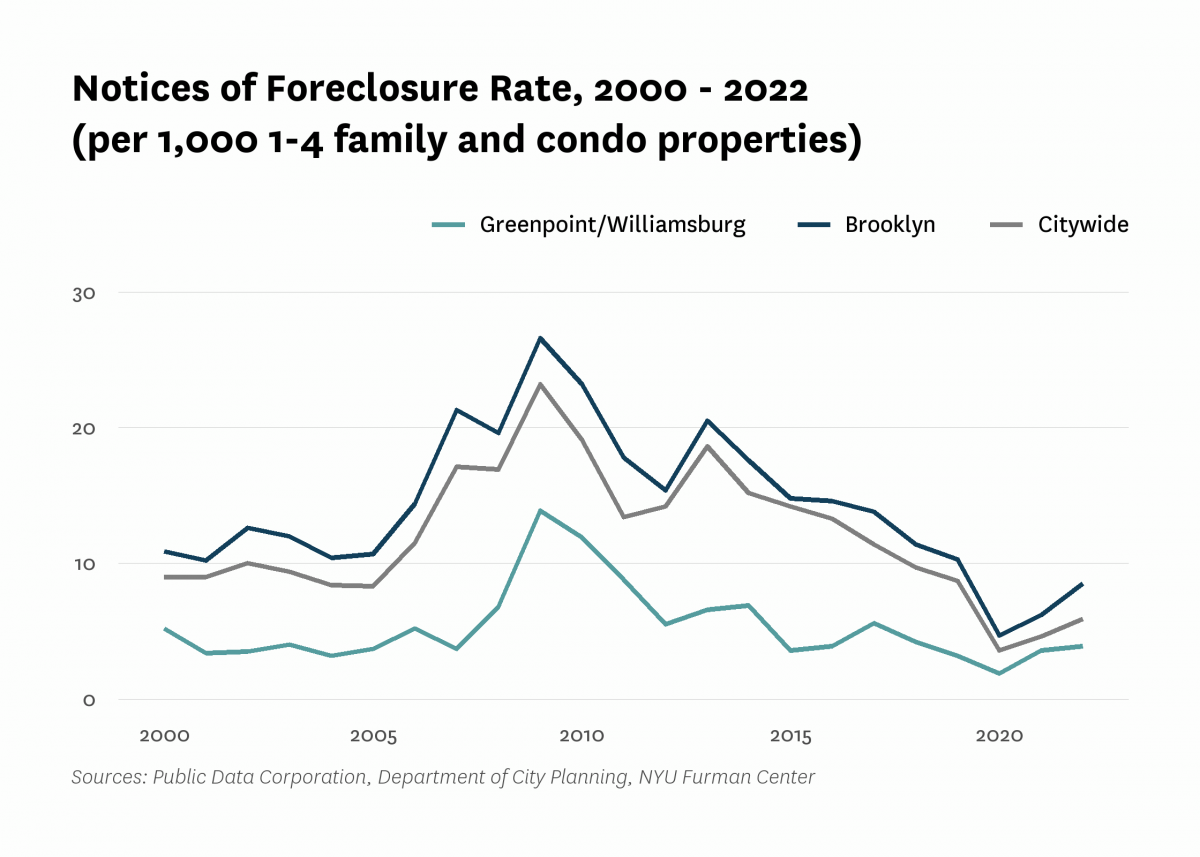
| Notices of foreclosure rate (per 1,000 1-4 family and condo properties) | 5.2 | 5.2 | 11.9 | 3.2 | 3.6 | 3.9 |
| Notices of foreclosure, all residential properties | 56 | 70 | 211 | 69 | 85 | 88 |
| Notices of foreclosure, initial, 1-4 family and condo properties | 27 | 37 | 143 | 23 | 31 | 34 |
| Notices of foreclosure, repeat, 1-4 family and condo properties | 7 | 14 | 25 | 30 | 29 | 33 |
| Pre-foreclosure notice rate (per 1,000 1-4 family and condo properties) | 17.2 | 12.7 | 21.6 | |||
| Pre-foreclosure notices, 1-4 family and condo properties | 281 | 218 | 368 | |||
| Properties entering REO, 1-4 family | 5 | 0 | 0 | |||
| Finance - Lending | ||||||
| FHA/VA-backed home purchase loans (% of home purchase loans) | 0.0% | 17.3% | 0.4% | 0.5% | ||
| Higher-cost home purchase loans (% of home purchase loans) | 3.8% | 0.4% | 0.8% | 0.3% | ||
| Higher-cost refinance loans (% of refinance loans) | 23.2% | 1.7% | 1.3% | 0.4% | ||
| Home purchase loan rate (per 1,000 properties) | 40.1 | 40.4 | 26.9 | 40.0 | ||
| Home purchase loans in LMI tracts (% of home purchase loans) | 59.5% | 4.8% | 19.5% | 16.1% | ||
| Home purchase loans to LMI borrowers (% of home purchase loans) | 2.4% | 48.3% | 1.4% | 1.9% | ||
| Refinance loan rate (per 1,000 properties) | 23.1 | 10.3 | 15.9 | 40.4 | ||
| Sales - Volume | ||||||
| Sales volume, 1 family building | 12 | 16 | 12 | 10 | 12 | 10 |
| Sales volume, 2-4 family building | 131 | 163 | 74 | 68 | 81 | 143 |
| Sales volume, 5+ family building | 63 | 81 | 53 | 46 | 72 | 93 |
| Sales volume, condominium | 72 | 737 | 761 | 606 | 803 | 528 |
| Sales volume, all property types | 278 | 997 | 900 | 730 | 968 | 774 |
| Sales - Median Prices | ||||||
| Median sales price per unit, 1 family building (2022$) | $401,910 | $835,430 | $871,720 | $1,756,060 | $1,915,150 | $2,327,500 |
| Median sales price per unit, 2-4 family building (2022$) | $181,270 | $404,010 | $363,750 | $872,180 | $742,720 | $832,500 |
| Median sales price per unit, 5+ family building (2022$) | $63,730 | $173,900 | $160,950 | $446,740 | $400,310 | $436,360 |
| Median sales price per unit, condominium (2022$) | $450,910 | $709,660 | $652,820 | $1,187,430 | $1,172,430 | $1,166,300 |
| Sales - Housing Price Index | ||||||
| Index of housing price appreciation, 1 family building | 100.0 | 237.3 | 257.8 | 624.7 | 713.3 | 686.4 |
| Index of housing price appreciation, 2-4 family building | 100.0 | 255.2 | 219.7 | 697.8 | 774.1 | 776.1 |
| Index of housing price appreciation, 5+ family building | 100.0 | 286.0 | 305.2 | 796.1 | 771.0 | 836.3 |
| Index of housing price appreciation, condominium | 100.0 | 138.1 | 119.4 | 231.6 | 240.7 | 252.3 |
| Index of housing price appreciation, all property types | 100.0 | 270.5 | 243.1 | 492.0 | 514.7 | 549.4 |
| Subsidized Housing | ||||||
| Total number of subsidized properties (properties) | 428 | |||||
| HUD Financing or Insurance (properties) | 24 | |||||
| HUD Financing or Insurance (units) | 1,697 | |||||
| HUD Project-based Rental Assistance Program (properties) | 32 | |||||
| HUD Project-based Rental Assistance Program (units) | 1,708 | |||||
| Low Income Housing Tax Credit (properties) | 45 | |||||
| Low Income Housing Tax Credit (units) | 3,909 | |||||
| Public Housing (properties) | 23 | |||||
| Public Housing (units) | 3,790 | |||||
| Mitchell-Lama (properties) | 11 | |||||
| Mitchell-Lama (units) | 4,021 | |||||
| 421-a Tax Exemption (properties) | 729 | |||||
| 421-a Tax Exemption (units) | 20,424 | |||||
| 420-c Tax Exemption (properties) | 66 | |||||
| 420-c Tax Exemption (units) | 1,781 | |||||
| NYC Housing Production Programs and Zoning Incentives or Requirements (properties) | 199 | |||||
| Eligible to expire from housing programs between 2023 and 2028 (properties) | 15 | |||||
| Eligible to expire from housing programs between 2023 and 2028 (units) | 427 | |||||
| Eligible to expire from housing programs between 2029 and 2038 (properties) | 15 | |||||
| Eligible to expire from housing programs between 2029 and 2038 (units) | 1,263 | |||||
| Eligible to expire from housing programs in 2039 and later (properties) | 54 | |||||
| Eligible to expire from housing programs in 2039 and later (units) | 6,599 | |||||
| Indicator | 2000 | 2006 | 2010 | 2019 | 2021 | 2022 |
|---|---|---|---|---|---|---|
| Density | ||||||
| Population density (1,000 persons per square mile) | 34.3 | 35.5 | 36.7 | 38.7 | ||
| Development | ||||||
| Units authorized by new residential building permits | 757 | 0 | 227 | 1,839 | 1,449 | 5,238 |
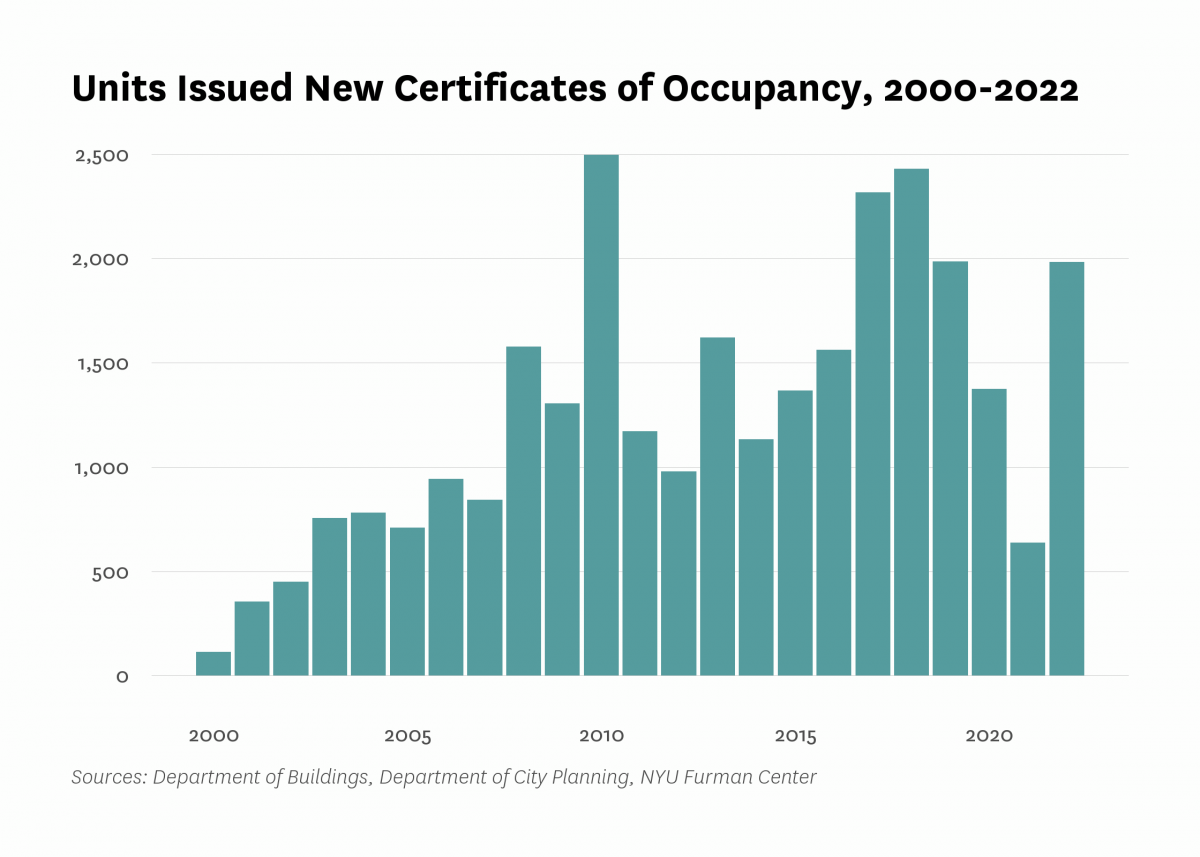
| Units issued new certificates of occupancy | 114 | 942 | 2,496 | 1,985 | 638 | 1,983 |
| Indicator | 2000 | 2006 | 2010 | 2019 | 2021 | 2022 |
|---|---|---|---|---|---|---|
| Commute | ||||||
| Car-free commute (% of commuters) | 76.6% | 79.3% | 85.2% | 85.8% | 75.0% | |
| Mean travel time to work (minutes) | 35.3 | 33.4 | 31.5 | 34.5 | 34.6 | |
| Crime and Incarceration | ||||||
| Serious crime rate (per 1,000 residents) | 17.2 | 15.3 | 11.7 | 11.0 | 14.1 | |
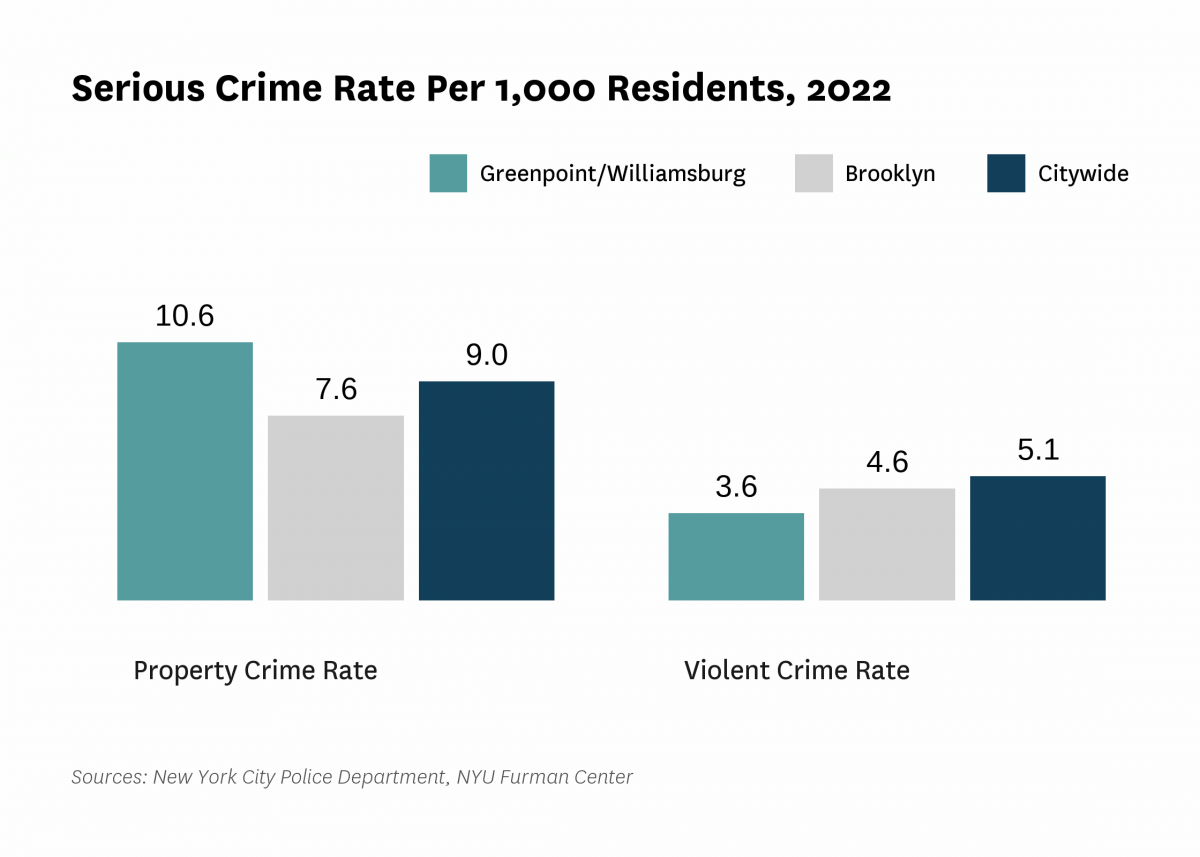
| Serious crime rate, property (per 1,000 residents) | 12.3 | 10.7 | 8.5 | 8.4 | 10.6 | |
| Serious crime rate, violent (per 1,000 residents) | 4.9 | 4.6 | 3.2 | 2.6 | 3.6 | |
| Schools | ||||||
| Students performing at grade level in English language arts, 4th grade | 54.6% | 41.5% | ||||
| Students performing at grade level in math, 4th grade | 57.8% | 37.0% | ||||
| Indicator | 2000 | 2006 | 2010 | 2019 | 2021 | 2022 |
|---|---|---|---|---|---|---|
| Median Rent | ||||||
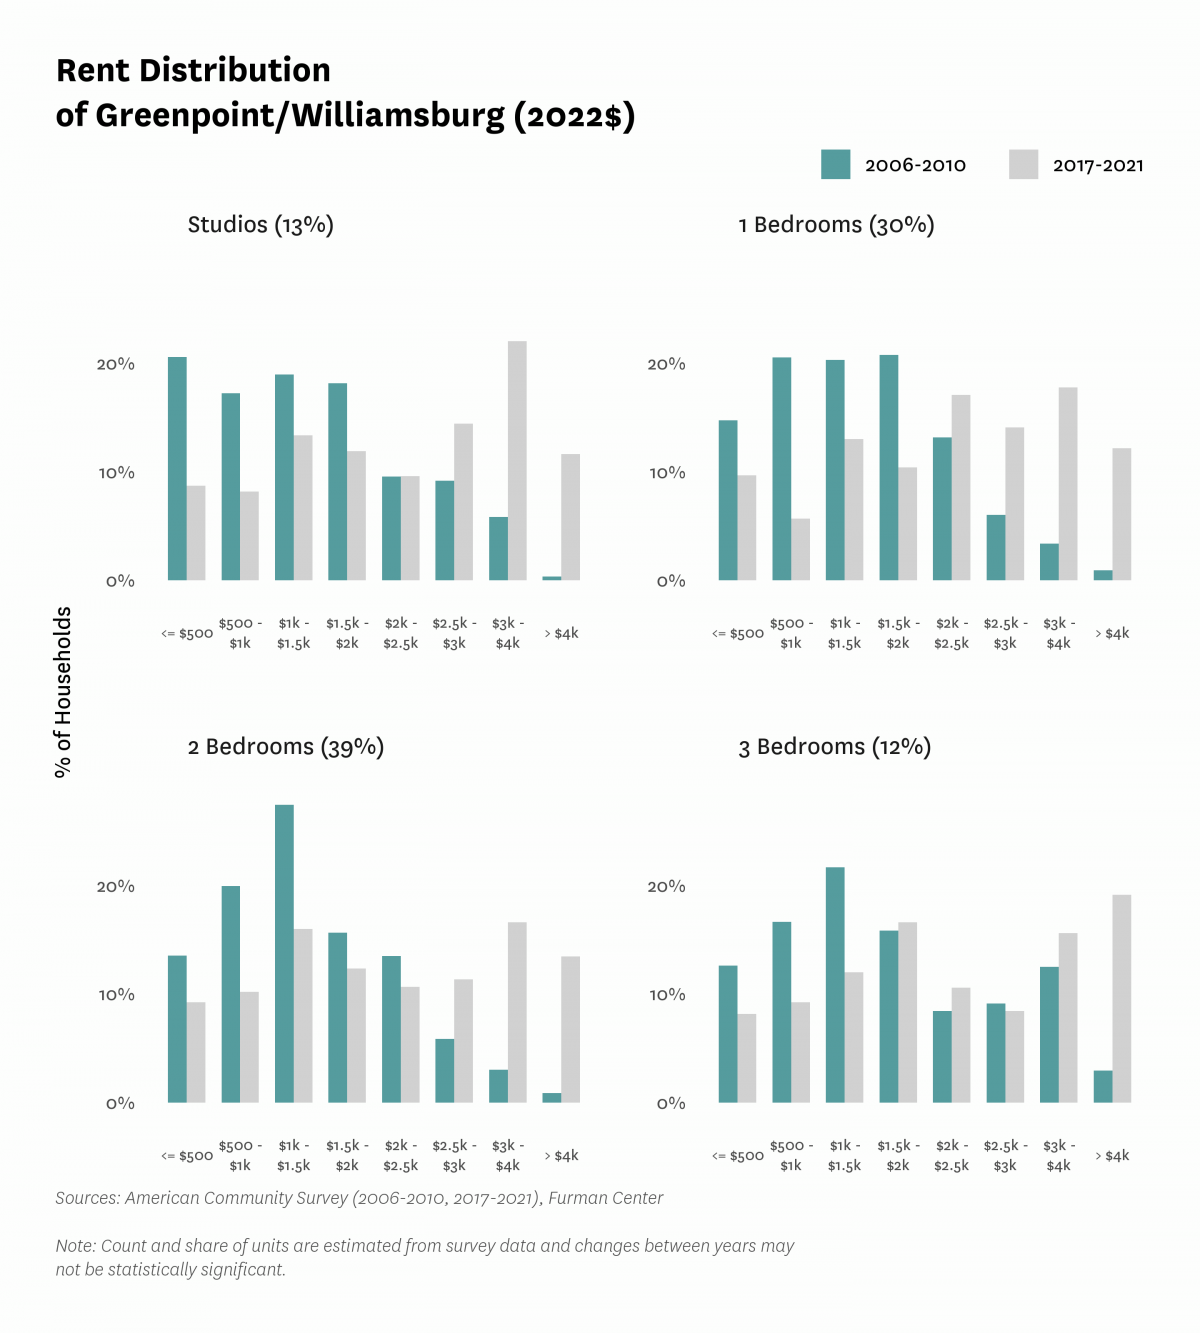
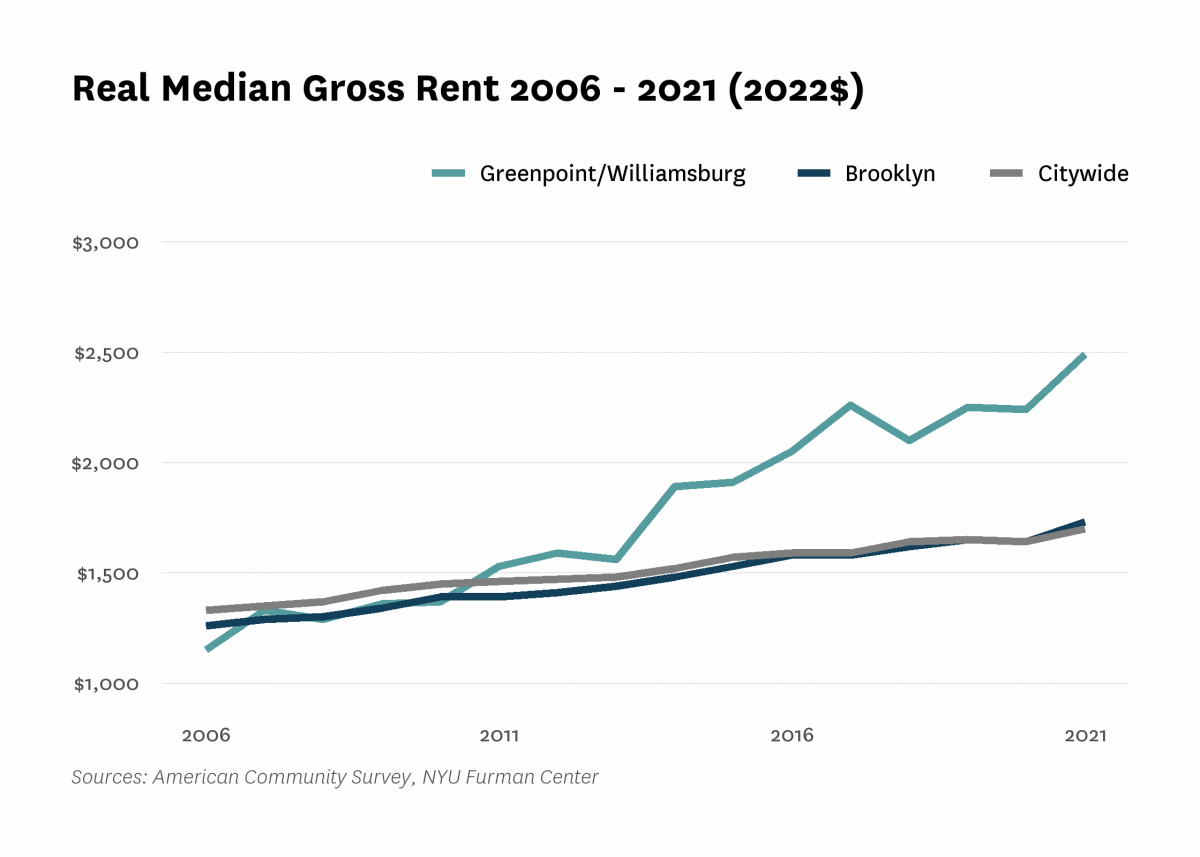
| Median rent, 2- and 3-bedrooms (2022$) | $1,350 | $1,860 | $2,210 | |||
| Median rent, all (2022$) | $1,020 | $1,150 | $1,370 | $2,250 | $2,490 | |
| Median rent, recent movers (2022$) | $2,010 | $2,990 | $3,280 | |||
| Median rent, studios and 1-bedrooms (2022$) | $1,370 | $2,230 | $2,390 | |||
| Change in collected rent (2019-2020) | 0.8% | |||||
| Affordability | ||||||
| Rental units affordable at 30% AMI (% of recently available units) | 7.6% | 5.1% | 4.5% | |||
| Rental units affordable at 80% AMI (% of recently available units) | 36.9% | 19.6% | 15.2% | |||
| Rental units affordable at 120% AMI (% of recently available units) | 74.3% | 52.6% | 47.0% | |||
| Rent Burden | ||||||
| Moderately rent-burdened households | 24.8% | 21.9% | 17.5% | 21.2% | ||
| Moderately rent-burdened households, low income | 27.3% | 25.5% | 24.5% | |||
| Moderately rent-burdened households, moderate income | 32.7% | 36.7% | 36.4% | |||
| Severely rent-burdened households | 23.7% | 27.6% | 24.3% | 22.6% | ||
| Severely rent-burdened households, low income | 44.6% | 46.3% | 47.4% | |||
| Severely rent-burdened households, moderate income | 4.2% | 8.1% | 7.4% | |||
| Rental Subsidy | ||||||
| Housing choice vouchers (% of occupied, privately owned rental units) | 8.6% | 8.7% | ||||
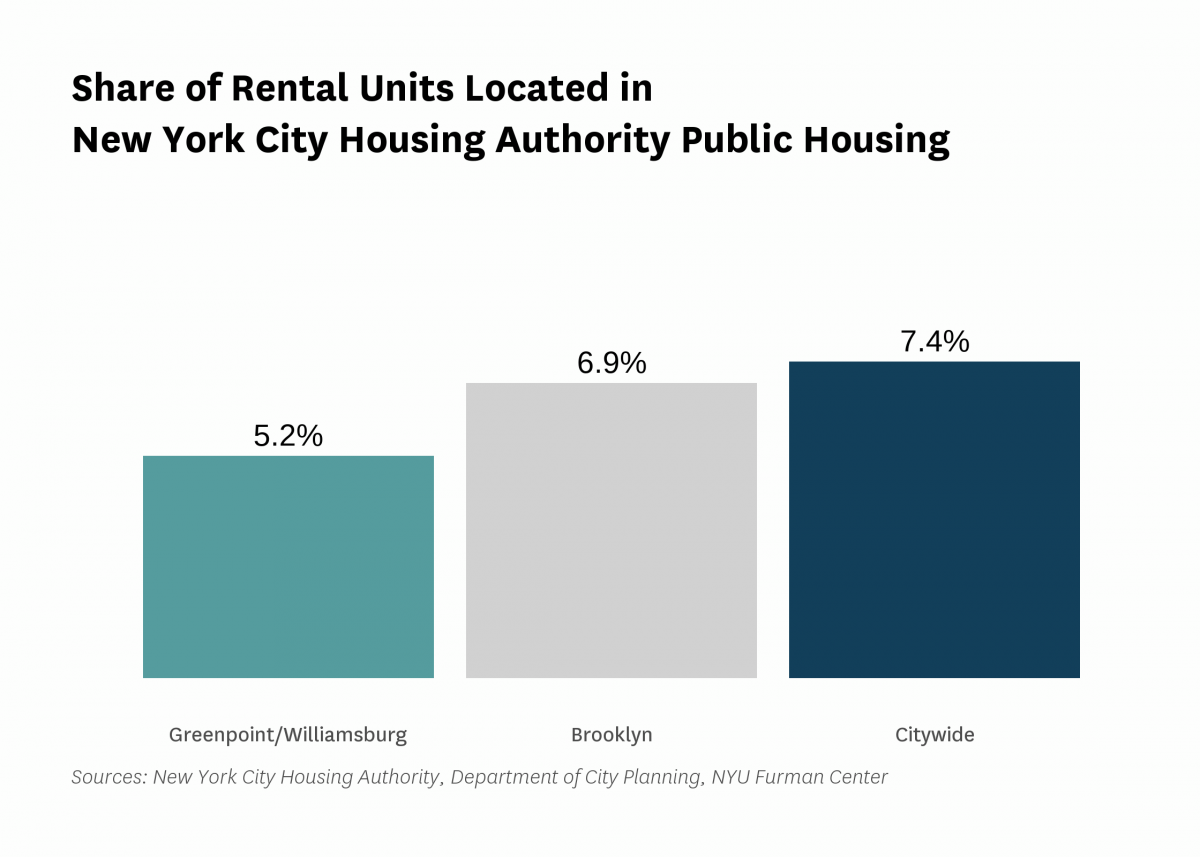
| Public housing (% of rental units) | 5.2% | |||||
Data Notes: See CoreData User Guide for more information about indicator definitions and methods.
Indicators: The rental vacancy rate, severe crowding rate, and the severely rent-burdened households indicators use five-year American Community Survey (ACS) estimates. Data under the 2010 heading comes from the 2006 – 2010 ACS, data under the 2019 heading comes from the 2015 – 2019 ACS and data under the 2021 heading comes from 2017 – 2021 ACS .
All content © 2005 – 2024 Furman Center for Real Estate and Urban Policy | Top of page | Contact Us