| Indicator | 2000 | 2006 | 2010 | 2019 | 2021 | 2022 |
|---|---|---|---|---|---|---|
| Population | ||||||
| Born in New York State | 38.3% | 42.2% | 40.4% | 38.9% | ||
| Disabled population | 5.6% | 4.6% | 6.1% | |||
| Foreign-born population | 50.3% | 58.2% | 53.0% | 55.9% | 56.7% | |
| Population | 243,690 | 246,542 | 257,327 | 239,869 | 242,765 | |
| Population aged 65+ | 15.8% | 17.8% | 16.0% | 21.7% | 24.0% | |
| Households | ||||||
| Households with children under 18 years old | 31.5% | 28.6% | 29.9% | 26.1% | 19.4% | |
| Single-person households | 25.2% | 22.8% | 25.4% | 32.9% | ||
| Race and Ethnicity | ||||||
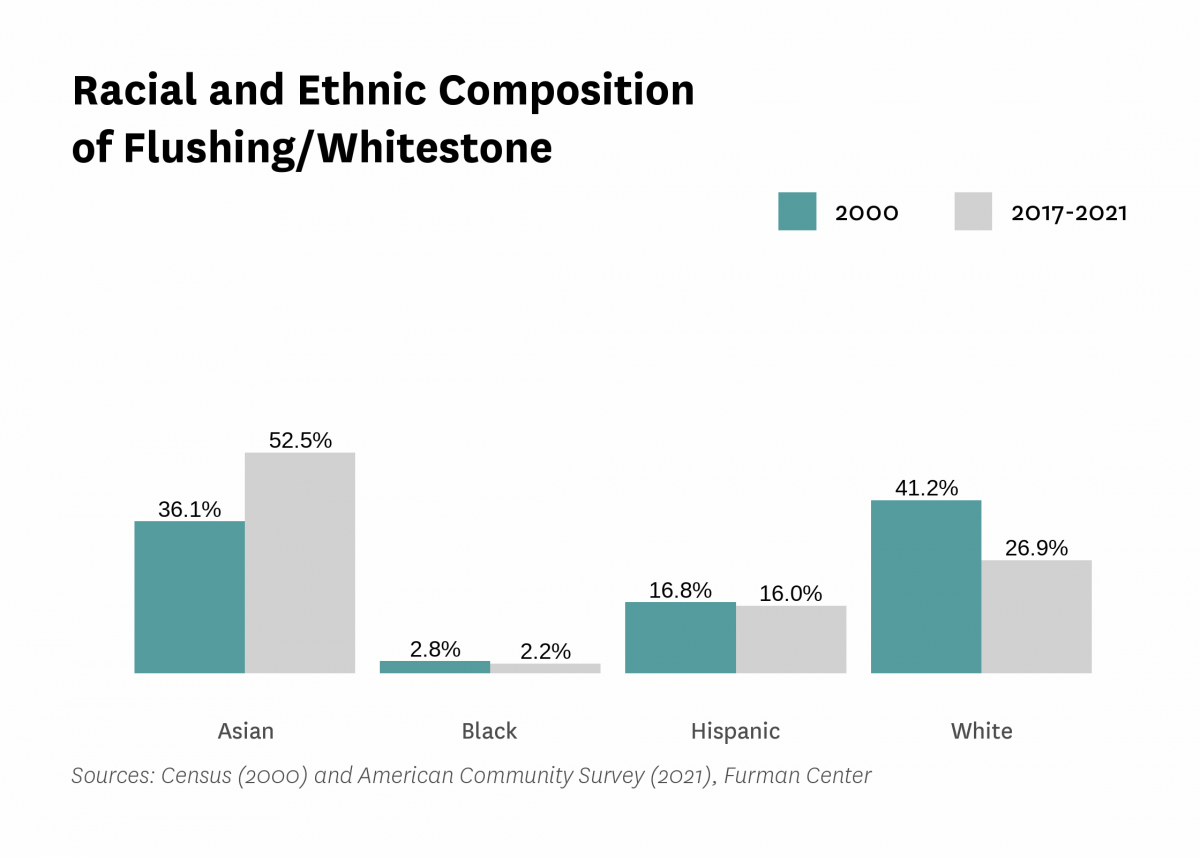
| Percent Asian | 36.1% | 45.3% | 50.2% | 56.4% | 52.5% | |
| Percent Black | 2.8% | 2.9% | 2.0% | 1.7% | 2.2% | |
| Percent Hispanic | 16.8% | 16.1% | 15.0% | 15.6% | 16.0% | |
| Percent white | 41.2% | 34.4% | 30.0% | 24.3% | 26.9% | |
| Racial diversity index | 0.67 | 0.65 | 0.64 | 0.60 | 0.63 | |
| Income and Poverty | ||||||
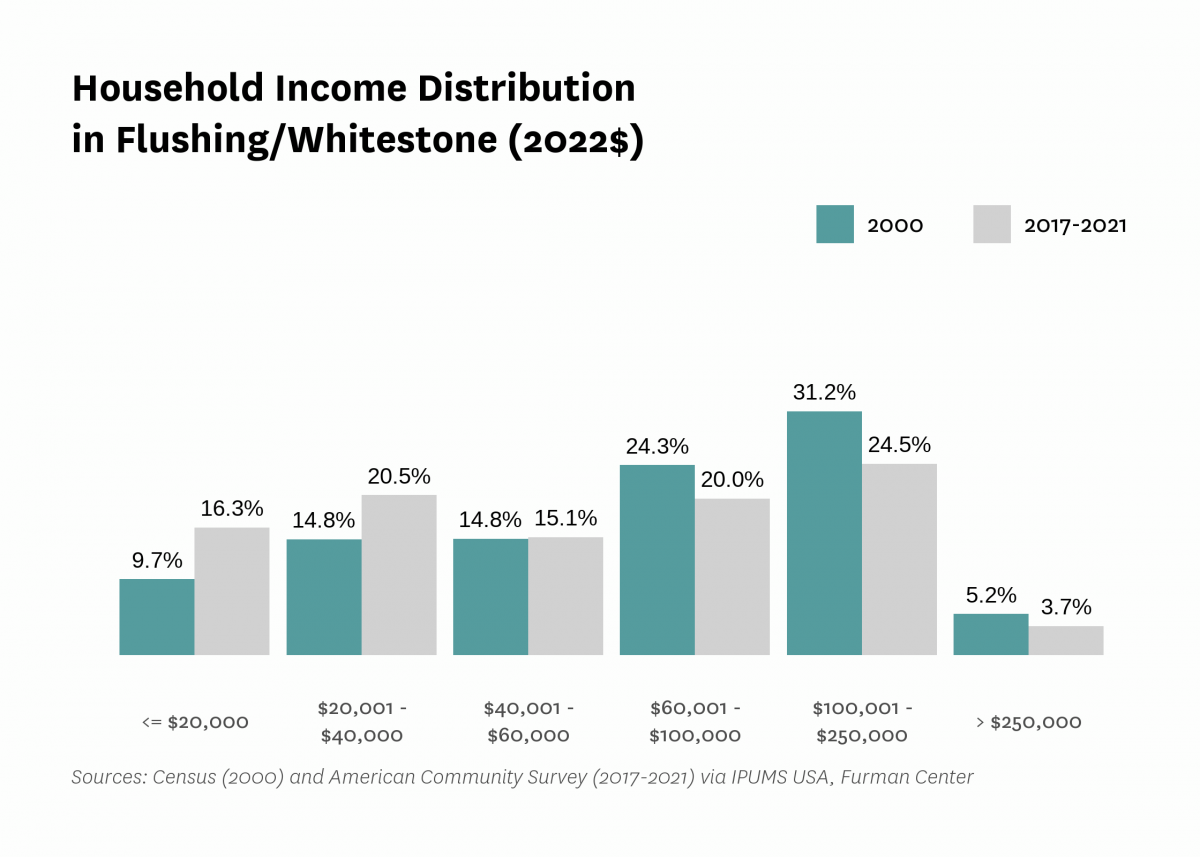
| Income diversity ratio | 4.5 | 4.8 | 6.0 | 5.7 | ||
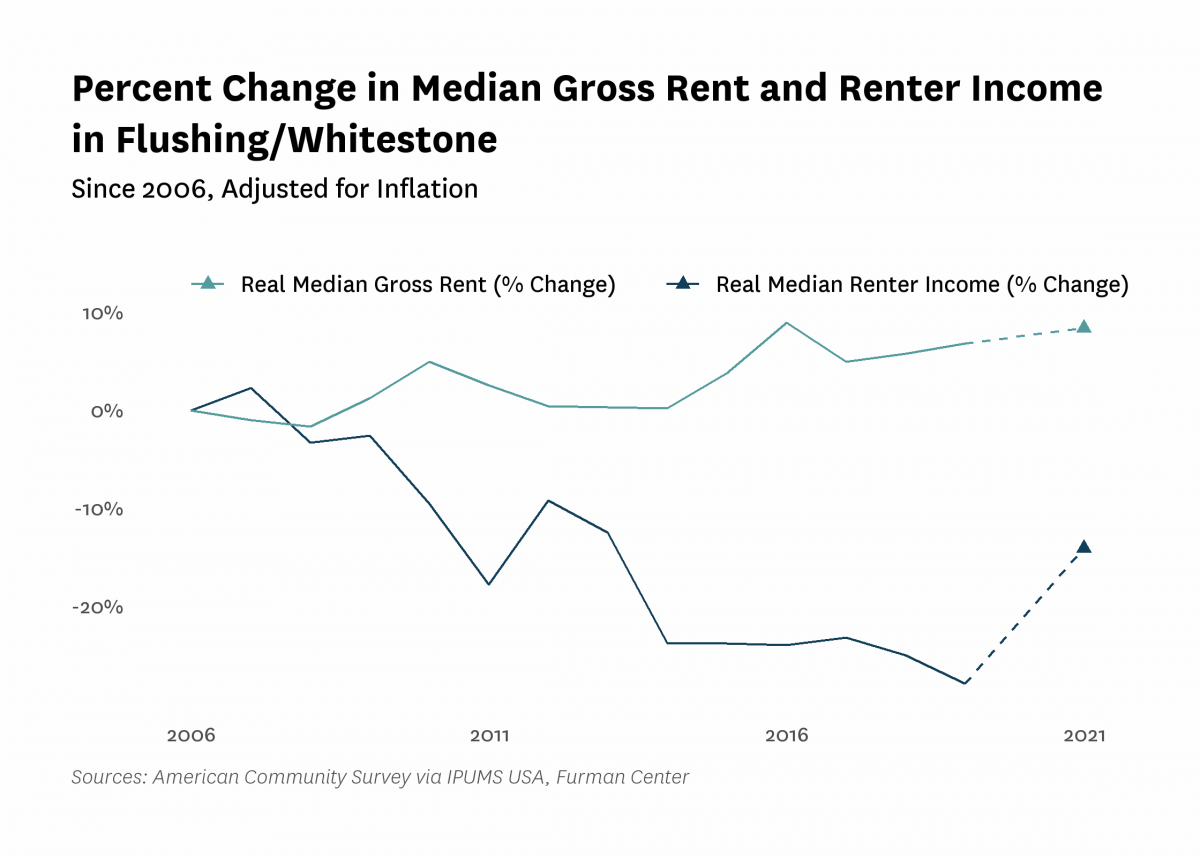
| Median household income (2022$) | $77,100 | $71,160 | $67,090 | $61,250 | $64,610 | |
| Median household income, homeowners (2022$) | $96,870 | $91,580 | $97,700 | $81,310 | ||
| Median household income, renters (2022$) | $56,490 | $51,110 | $40,760 | $48,560 | ||
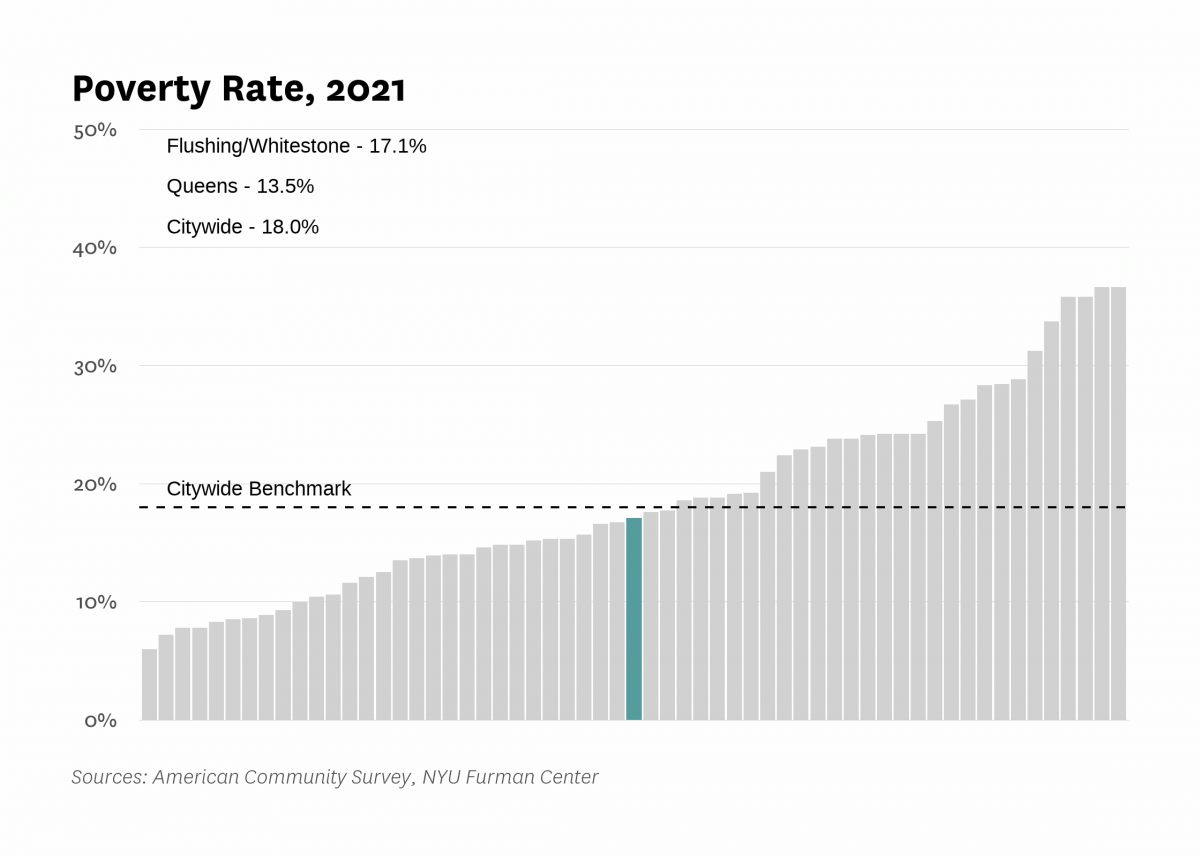
| Poverty rate | 13.2% | 10.6% | 14.3% | 14.8% | 17.1% | |
| Poverty rate, population aged 65+ | 14.5% | 12.6% | 23.2% | 18.0% | ||
| Poverty rate, population under 18 years old | 14.1% | 14.5% | 18.1% | 21.7% | ||
| Labor Market | ||||||
| Labor force participation rate | 62.1% | 63.1% | 57.5% | 56.3% | ||
| Population aged 25+ without a high school diploma | 16.5% | 19.9% | 21.9% | 21.0% | ||
| Unemployment rate | 5.52% | 7.83% | 11.57% | 4.53% | 12.77% | |
| Indicator | 2000 | 2006 | 2010 | 2019 | 2021 | 2022 |
|---|---|---|---|---|---|---|
| Housing Stock | ||||||
| Homeownership rate | 47.3% | 50.2% | 49.0% | 44.1% | 52.2% | |
| Housing units | 92,769 | 93,631 | 98,172 | 98,610 | ||
| Rental vacancy rate | 2.9% | 4.1% | 3.6% | |||
| Serious housing code violations (per 1,000 privately owned rental units) | 16.8 | 9.4 | 23.8 | 37.5 | 54.1 | |
| Severe crowding rate (% of renter households) | 4.9% | 5.2% | 5.7% | |||
| Total housing code violations (per 1,000 privately owned rental units) | 138.1 | 59.8 | 91.7 | 167.0 | 195.7 | |
| Finance - Distress | ||||||
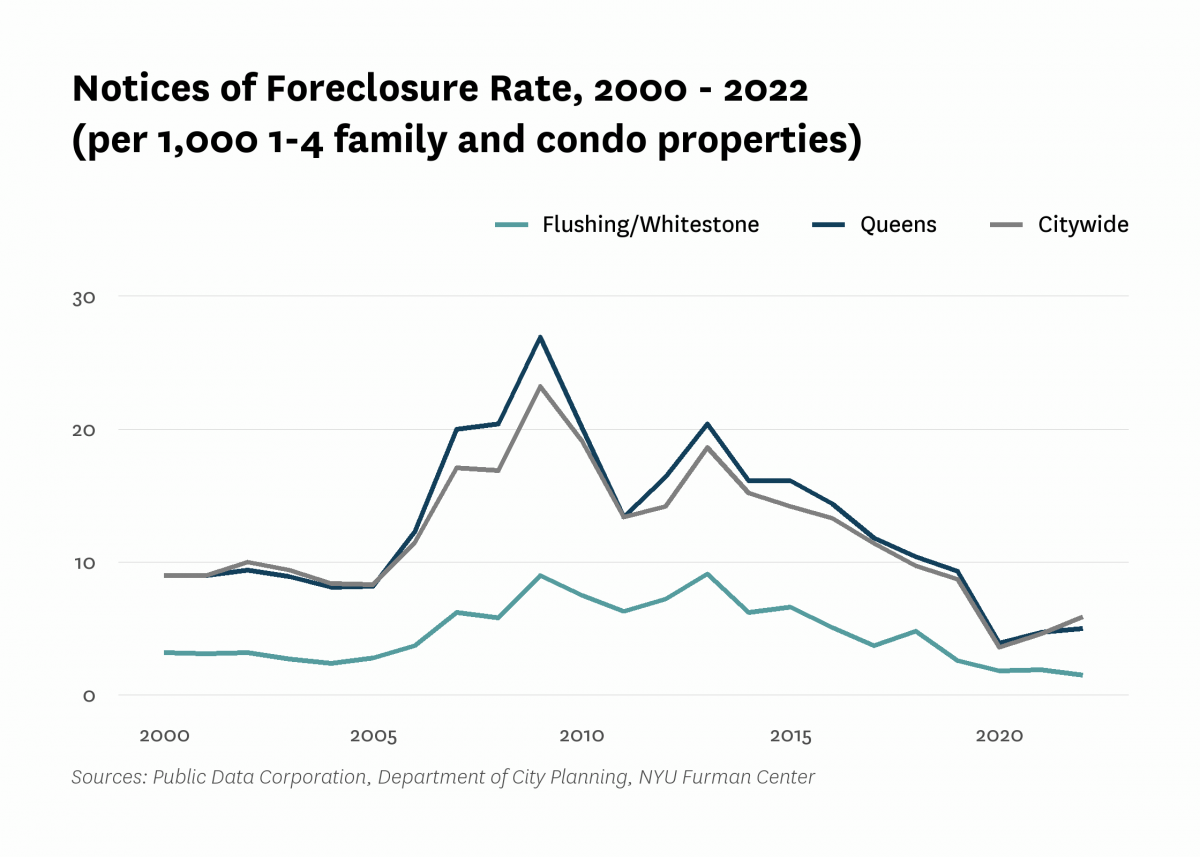
| Notices of foreclosure rate (per 1,000 1-4 family and condo properties) | 3.2 | 3.7 | 7.5 | 2.6 | 1.9 | 1.5 |
| Notices of foreclosure, all residential properties | 112 | 133 | 287 | 106 | 79 | 62 |
| Notices of foreclosure, initial, 1-4 family and condo properties | 75 | 113 | 221 | 42 | 40 | 32 |
| Notices of foreclosure, repeat, 1-4 family and condo properties | 35 | 20 | 61 | 62 | 37 | 30 |
| Pre-foreclosure notice rate (per 1,000 1-4 family and condo properties) | 19.1 | 7.0 | 16.2 | |||
| Pre-foreclosure notices, 1-4 family and condo properties | 774 | 293 | 680 | |||
| Properties entering REO, 1-4 family | 0 | 4 | 7 | |||
| Finance - Lending | ||||||
| FHA/VA-backed home purchase loans (% of home purchase loans) | 0.0% | 2.9% | 0.6% | 0.5% | ||
| Higher-cost home purchase loans (% of home purchase loans) | 8.3% | 1.1% | 6.8% | 14.1% | ||
| Higher-cost refinance loans (% of refinance loans) | 19.0% | 1.1% | 4.9% | 2.8% | ||
| Home purchase loan rate (per 1,000 properties) | 41.0 | 21.0 | 16.5 | 28.2 | ||
| Home purchase loans in LMI tracts (% of home purchase loans) | 19.2% | 15.5% | 26.5% | 34.4% | ||
| Home purchase loans to LMI borrowers (% of home purchase loans) | 5.7% | 10.9% | 9.0% | 12.6% | ||
| Refinance loan rate (per 1,000 properties) | 24.5 | 15.9 | 12.1 | 25.5 | ||
| Sales - Volume | ||||||
| Sales volume, 1 family building | 685 | 752 | 406 | 377 | 569 | 644 |
| Sales volume, 2-4 family building | 519 | 593 | 257 | 215 | 312 | 395 |
| Sales volume, 5+ family building | 11 | 24 | 7 | 14 | 10 | 11 |
| Sales volume, condominium | 400 | 383 | 393 | 334 | 698 | 645 |
| Sales volume, all property types | 1,615 | 1,752 | 1,063 | 940 | 1,589 | 1,695 |
| Sales - Median Prices | ||||||
| Median sales price per unit, 1 family building (2022$) | $509,820 | $864,240 | $759,700 | $1,003,460 | $997,360 | $990,000 |
| Median sales price per unit, 2-4 family building (2022$) | $271,900 | $477,790 | $424,910 | $593,710 | $612,630 | $595,000 |
| Median sales price per unit, 5+ family building (2022$) | $101,400 | $198,490 | $160,950 | $257,140 | $251,990 | $213,330 |
| Median sales price per unit, condominium (2022$) | $343,280 | $541,030 | $475,130 | $702,420 | $637,620 | $613,000 |
| Sales - Housing Price Index | ||||||
| Index of housing price appreciation, 1 family building | 100.0 | 206.3 | 188.2 | 296.1 | 319.9 | 319.4 |
| Index of housing price appreciation, 2-4 family building | 100.0 | 208.4 | 192.1 | 333.0 | 334.8 | 341.1 |
| Index of housing price appreciation, 5+ family building | 100.0 | 264.7 | 135.7 | 419.5 | 509.7 | 399.0 |
| Index of housing price appreciation, condominium | 100.0 | 205.4 | 200.1 | 301.2 | 294.1 | 306.2 |
| Index of housing price appreciation, all property types | 100.0 | 207.4 | 194.7 | 306.5 | 314.4 | 320.2 |
| Subsidized Housing | ||||||
| Total number of subsidized properties (properties) | 40 | |||||
| HUD Financing or Insurance (properties) | 4 | |||||
| HUD Financing or Insurance (units) | 191 | |||||
| HUD Project-based Rental Assistance Program (properties) | 4 | |||||
| HUD Project-based Rental Assistance Program (units) | 503 | |||||
| Low Income Housing Tax Credit (properties) | 8 | |||||
| Low Income Housing Tax Credit (units) | 1,260 | |||||
| Public Housing (properties) | 4 | |||||
| Public Housing (units) | 930 | |||||
| Mitchell-Lama (properties) | 2 | |||||
| Mitchell-Lama (units) | 424 | |||||
| 421-a Tax Exemption (properties) | 159 | |||||
| 421-a Tax Exemption (units) | 5,427 | |||||
| 420-c Tax Exemption (properties) | 6 | |||||
| 420-c Tax Exemption (units) | 968 | |||||
| NYC Housing Production Programs and Zoning Incentives or Requirements (properties) | 11 | |||||
| Eligible to expire from housing programs between 2023 and 2028 (properties) | 3 | |||||
| Eligible to expire from housing programs between 2023 and 2028 (units) | 228 | |||||
| Eligible to expire from housing programs between 2029 and 2038 (properties) | 3 | |||||
| Eligible to expire from housing programs between 2029 and 2038 (units) | 500 | |||||
| Eligible to expire from housing programs in 2039 and later (properties) | 8 | |||||
| Eligible to expire from housing programs in 2039 and later (units) | 885 | |||||
| Indicator | 2000 | 2006 | 2010 | 2019 | 2021 | 2022 |
|---|---|---|---|---|---|---|
| Density | ||||||
| Population density (1,000 persons per square mile) | 20.9 | 21.9 | 20.4 | 20.6 | ||
| Development | ||||||
| Units authorized by new residential building permits | 529 | 0 | 481 | 486 | 330 | 620 |
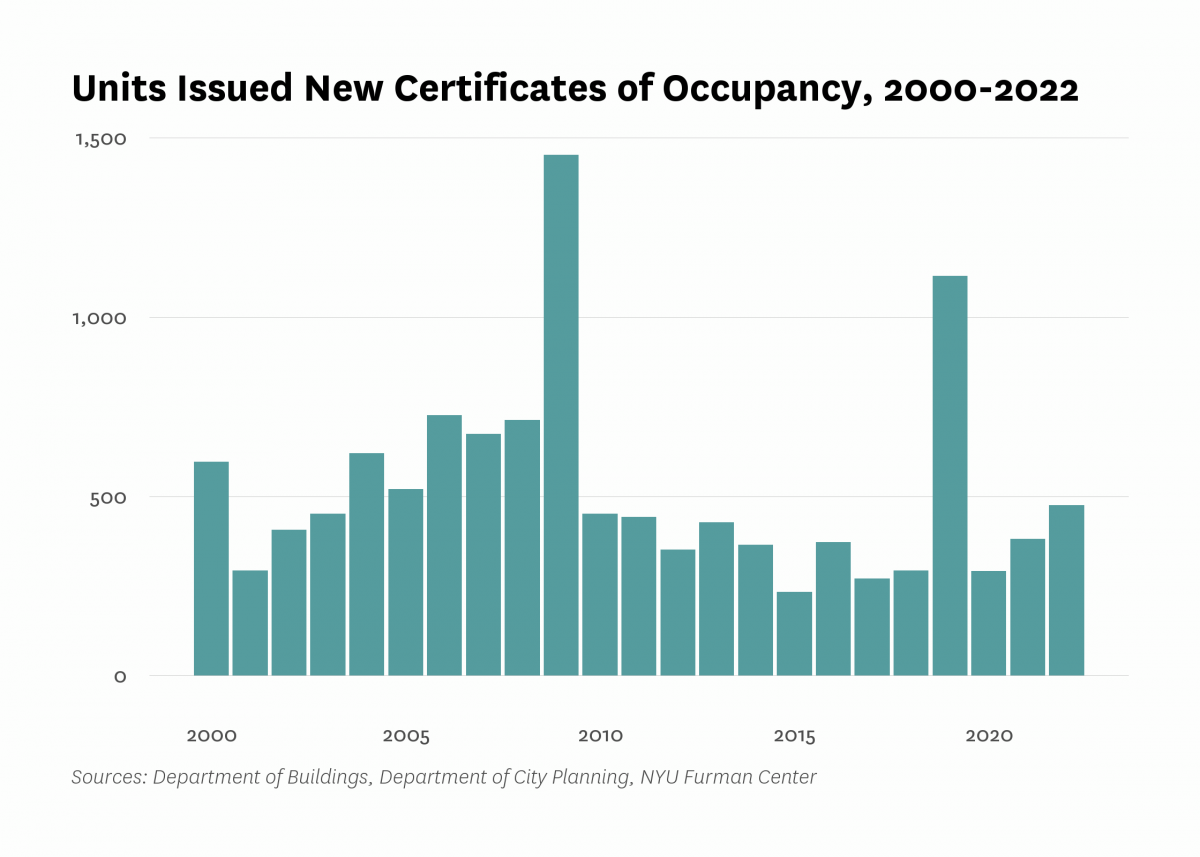
| Units issued new certificates of occupancy | 596 | 727 | 451 | 1,115 | 381 | 476 |
| Indicator | 2000 | 2006 | 2010 | 2019 | 2021 | 2022 |
|---|---|---|---|---|---|---|
| Commute | ||||||
| Car-free commute (% of commuters) | 42.4% | 46.3% | 47.4% | 49.4% | 41.6% | |
| Mean travel time to work (minutes) | 40.5 | 41.1 | 40.1 | 41.7 | 37.2 | |
| Crime and Incarceration | ||||||
| Serious crime rate (per 1,000 residents) | 9.7 | 7.7 | 7.6 | 8.1 | 11.1 | |
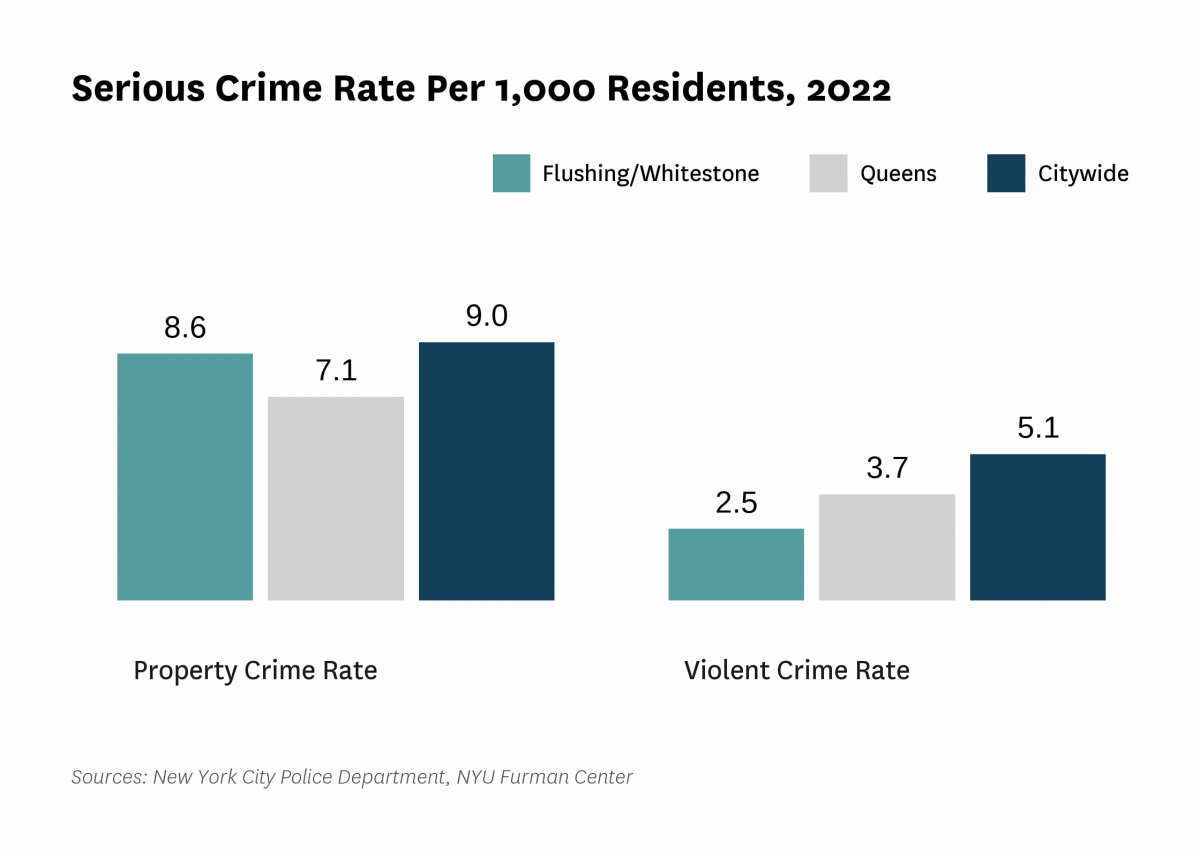
| Serious crime rate, property (per 1,000 residents) | 7.8 | 5.9 | 5.5 | 6.8 | 8.6 | |
| Serious crime rate, violent (per 1,000 residents) | 1.9 | 1.8 | 2.1 | 1.3 | 2.5 | |
| Schools | ||||||
| Students performing at grade level in English language arts, 4th grade | 67.3% | 59.2% | ||||
| Students performing at grade level in math, 4th grade | 72.3% | 63.8% | ||||
| Indicator | 2000 | 2006 | 2010 | 2019 | 2021 | 2022 |
|---|---|---|---|---|---|---|
| Median Rent | ||||||
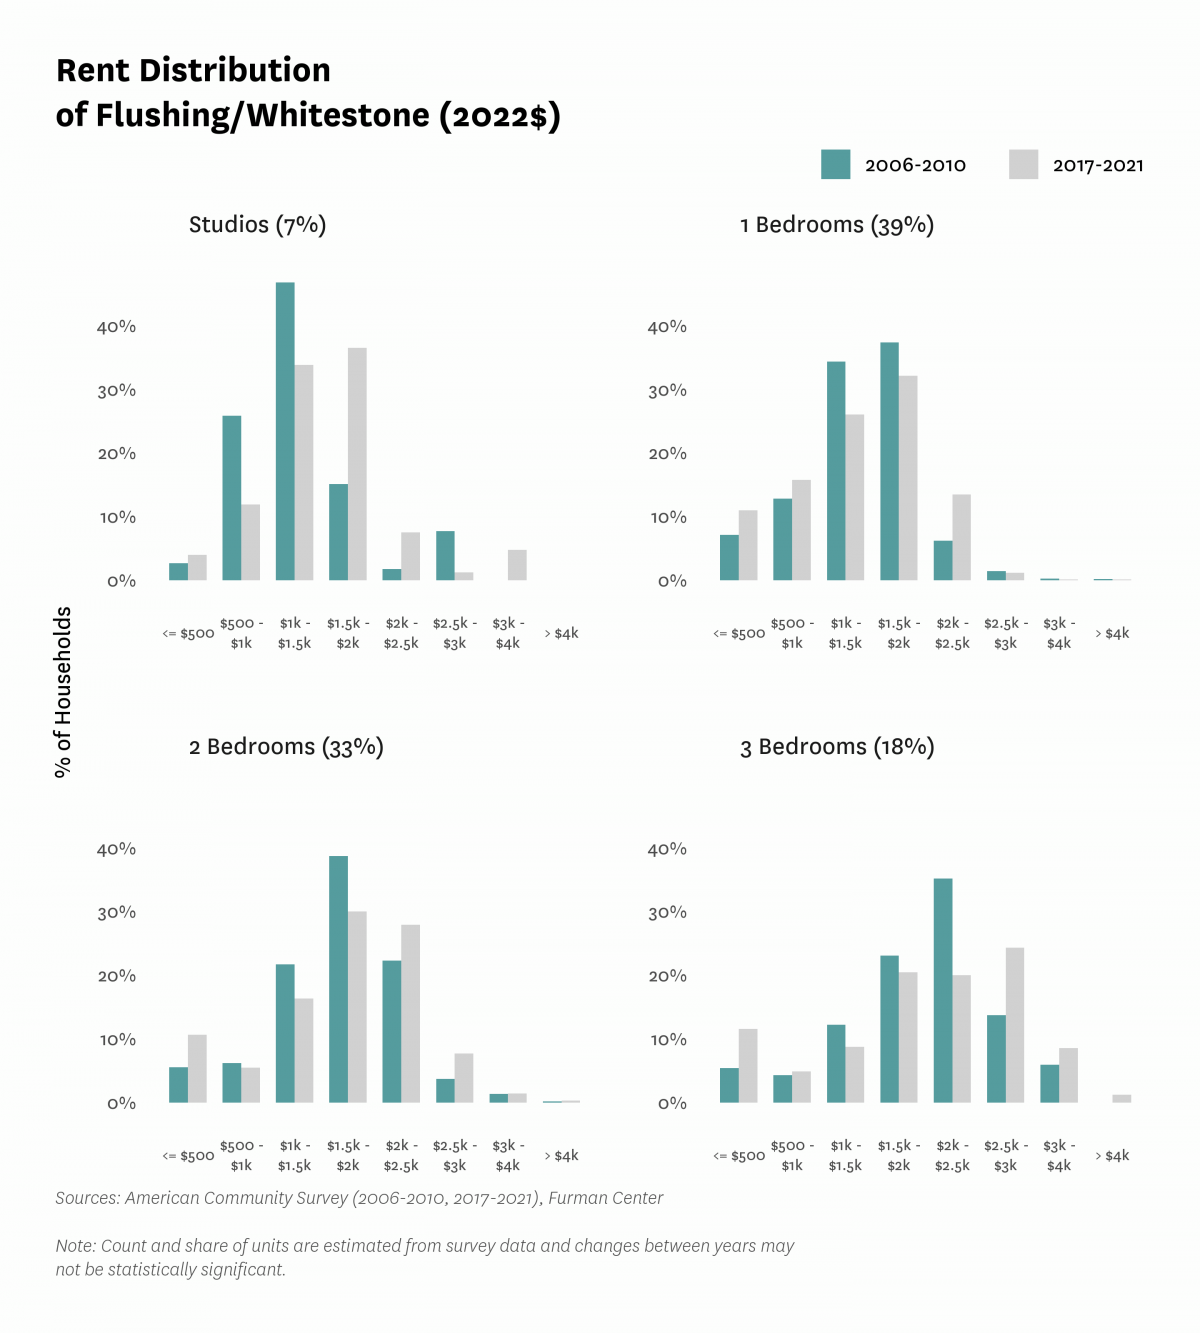
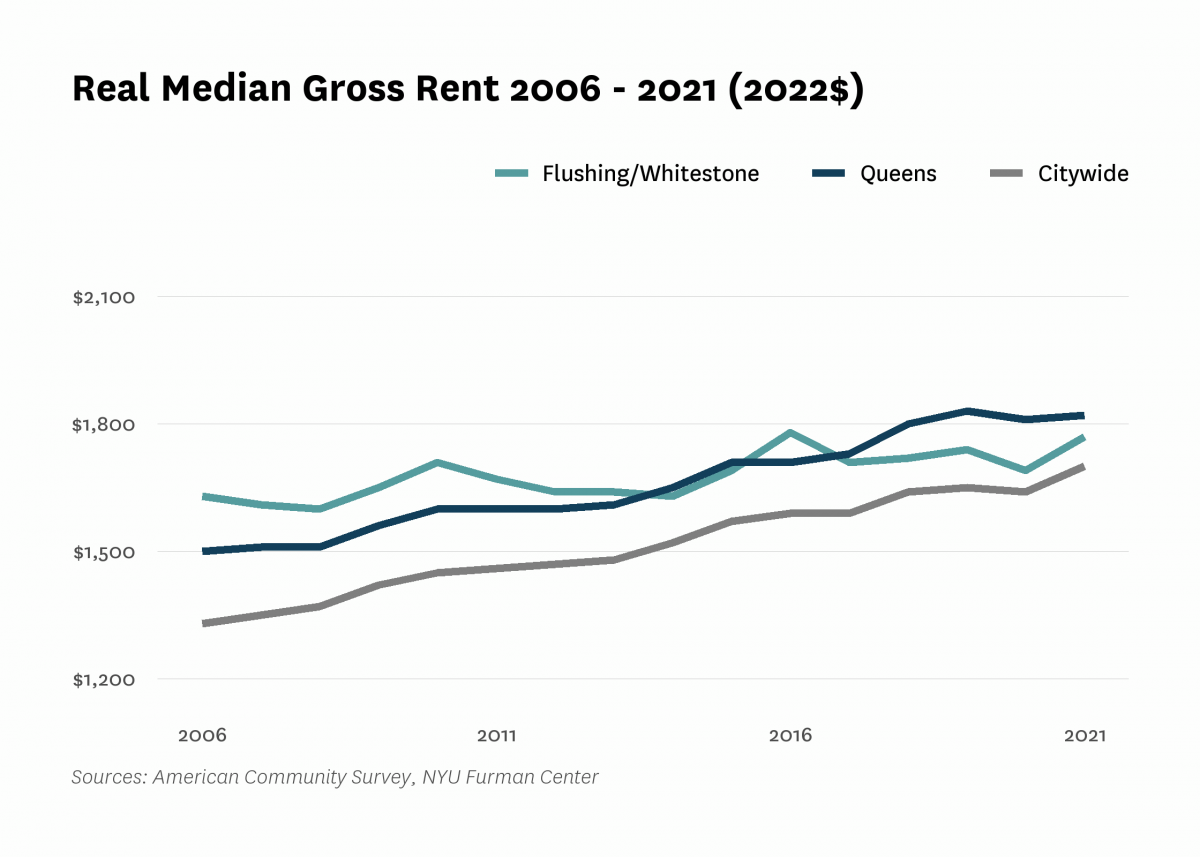
| Median rent, 2- and 3-bedrooms (2022$) | $1,850 | $1,840 | $1,960 | |||
| Median rent, all (2022$) | $1,410 | $1,630 | $1,710 | $1,740 | $1,770 | |
| Median rent, recent movers (2022$) | $1,810 | $1,870 | $2,110 | |||
| Median rent, studios and 1-bedrooms (2022$) | $1,410 | $1,440 | $1,510 | |||
| Change in collected rent (2019-2020) | 0.4% | |||||
| Affordability | ||||||
| Rental units affordable at 30% AMI (% of recently available units) | 3.5% | 5.9% | 2.9% | |||
| Rental units affordable at 80% AMI (% of recently available units) | 43.6% | 63.7% | 50.6% | |||
| Rental units affordable at 120% AMI (% of recently available units) | 93.7% | 97.5% | 96.5% | |||
| Rent Burden | ||||||
| Moderately rent-burdened households | 26.3% | 22.0% | 20.5% | 23.6% | ||
| Moderately rent-burdened households, low income | 34.9% | 30.3% | 31.3% | |||
| Moderately rent-burdened households, moderate income | 17.9% | 14.3% | 13.6% | |||
| Severely rent-burdened households | 23.7% | 31.3% | 41.1% | 37.8% | ||
| Severely rent-burdened households, low income | 50.3% | 54.4% | 51.0% | |||
| Severely rent-burdened households, moderate income | 0.3% | 0.2% | 0.7% | |||
| Rental Subsidy | ||||||
| Housing choice vouchers (% of occupied, privately owned rental units) | 0.9% | 0.5% | ||||
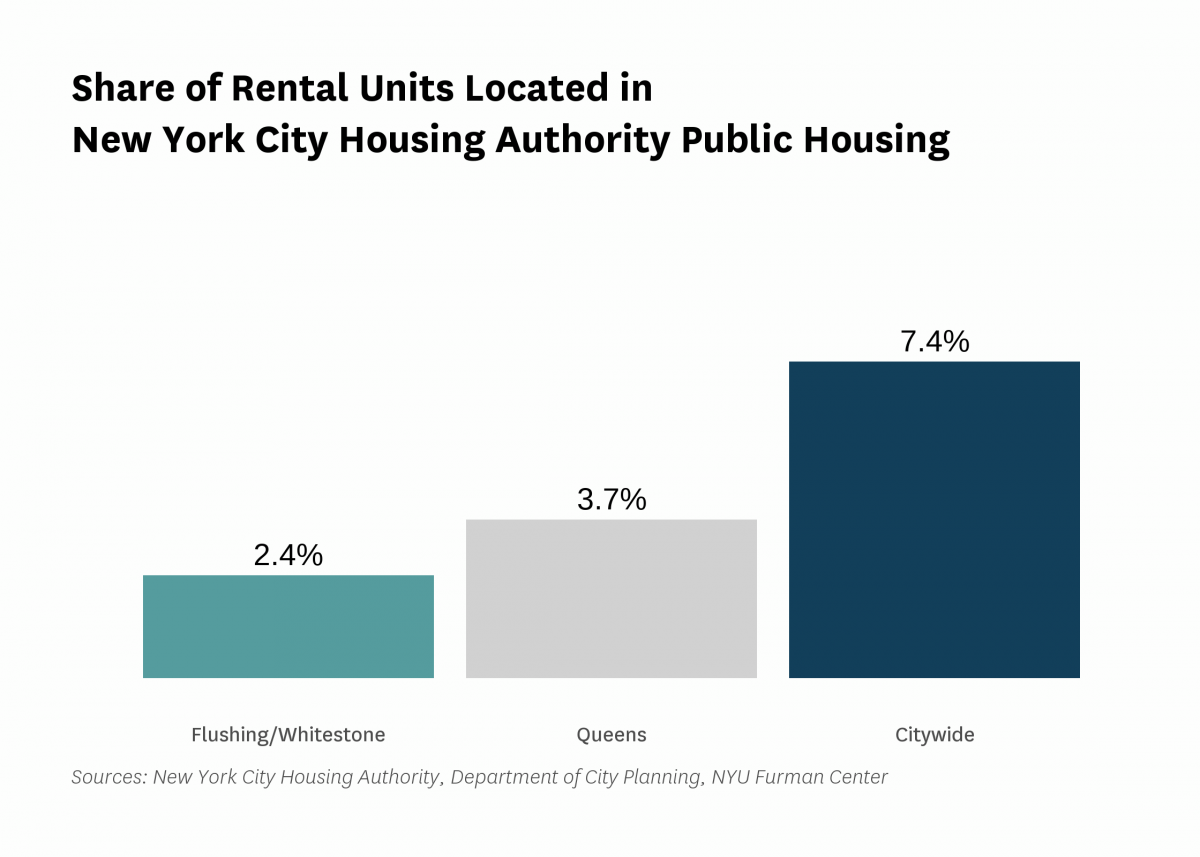
| Public housing (% of rental units) | 2.4% | |||||
Data Notes: See CoreData User Guide for more information about indicator definitions and methods.
Indicators: The rental vacancy rate, severe crowding rate, and the severely rent-burdened households indicators use five-year American Community Survey (ACS) estimates. Data under the 2010 heading comes from the 2006 – 2010 ACS, data under the 2019 heading comes from the 2015 – 2019 ACS and data under the 2021 heading comes from 2017 – 2021 ACS .
All content © 2005 – 2024 Furman Center for Real Estate and Urban Policy | Top of page | Contact Us