| Indicator | 2000 | 2006 | 2010 | 2019 | 2021 | 2022 |
|---|---|---|---|---|---|---|
| Population | ||||||
| Born in New York State | 47.1% | 45.6% | 49.0% | 47.5% | ||
| Disabled population | 5.7% | 5.2% | 7.4% | |||
| Foreign-born population | 49.4% | 45.6% | 46.6% | 39.9% | 38.8% | |
| Population | 166,315 | 163,099 | 162,715 | 156,866 | 173,007 | |
| Population aged 65+ | 10.8% | 12.2% | 9.8% | 14.8% | 17.3% | |
| Households | ||||||
| Households with children under 18 years old | 41.8% | 35.2% | 37.1% | 34.2% | 27.7% | |
| Single-person households | 28.1% | 27.1% | 31.3% | 31.1% | ||
| Race and Ethnicity | ||||||
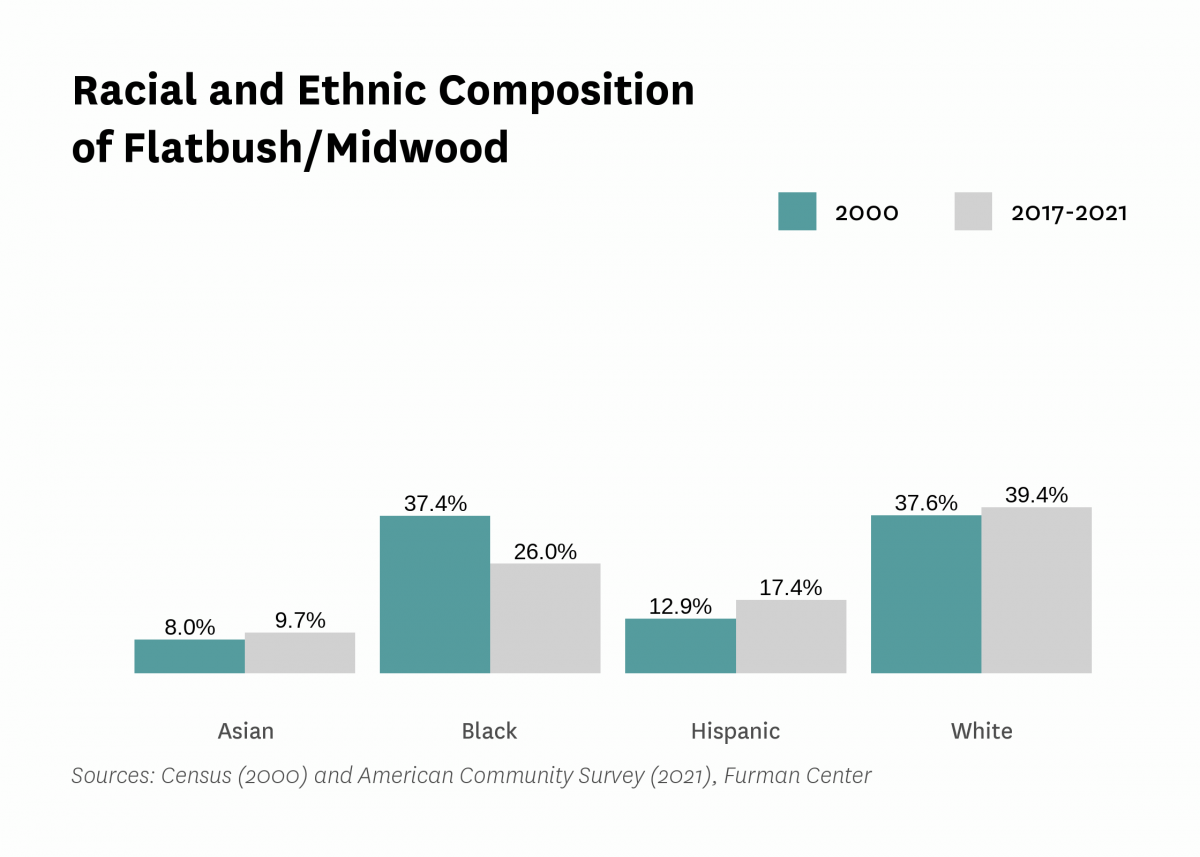
| Percent Asian | 8.0% | 8.3% | 8.1% | 9.5% | 9.7% | |
| Percent Black | 37.4% | 38.3% | 34.9% | 33.6% | 26.0% | |
| Percent Hispanic | 12.9% | 10.9% | 12.7% | 13.8% | 17.4% | |
| Percent white | 37.6% | 40.6% | 42.0% | 39.8% | 39.4% | |
| Racial diversity index | 0.70 | 0.67 | 0.68 | 0.70 | 0.74 | |
| Income and Poverty | ||||||
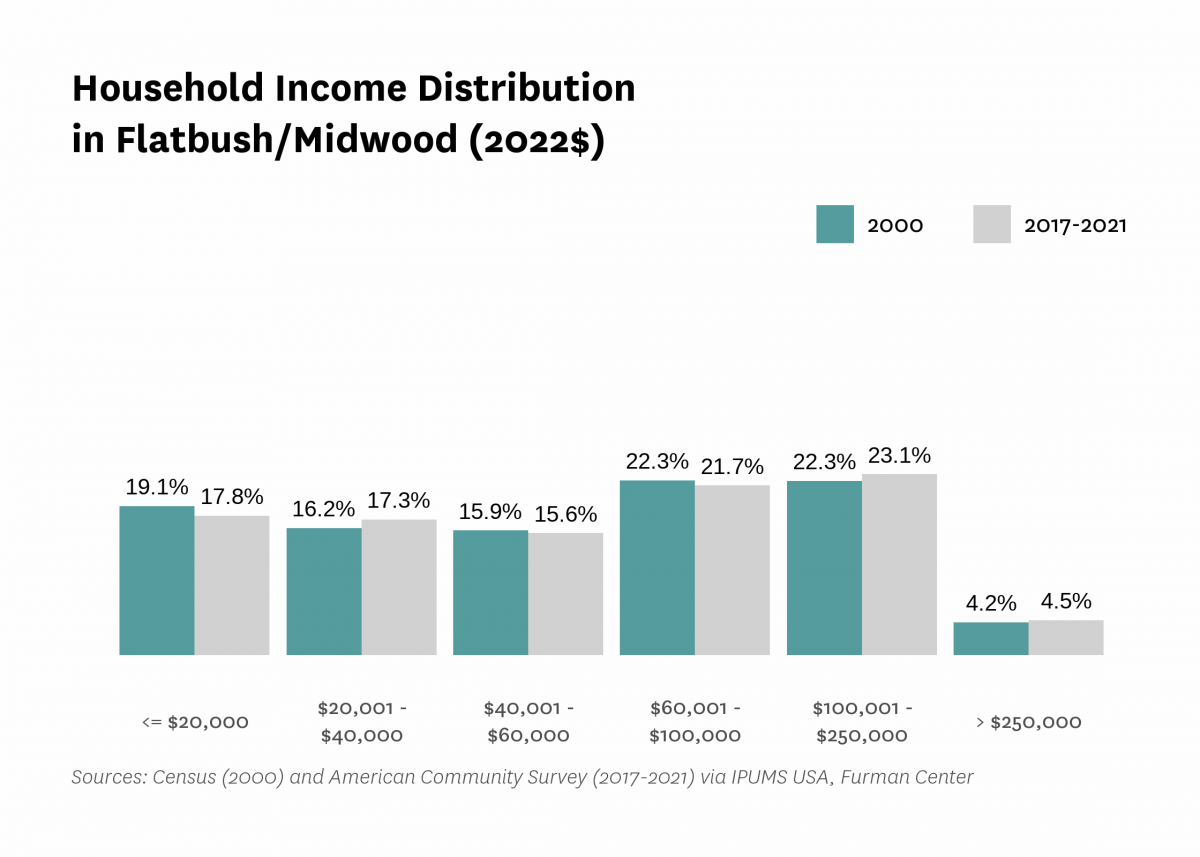
| Income diversity ratio | 4.6 | 5.3 | 5.0 | 5.3 | ||
| Median household income (2022$) | $61,330 | $56,380 | $55,460 | $73,140 | $70,130 | |
| Median household income, homeowners (2022$) | $97,840 | $107,640 | $136,370 | $126,740 | ||
| Median household income, renters (2022$) | $49,480 | $46,410 | $62,290 | $57,740 | ||
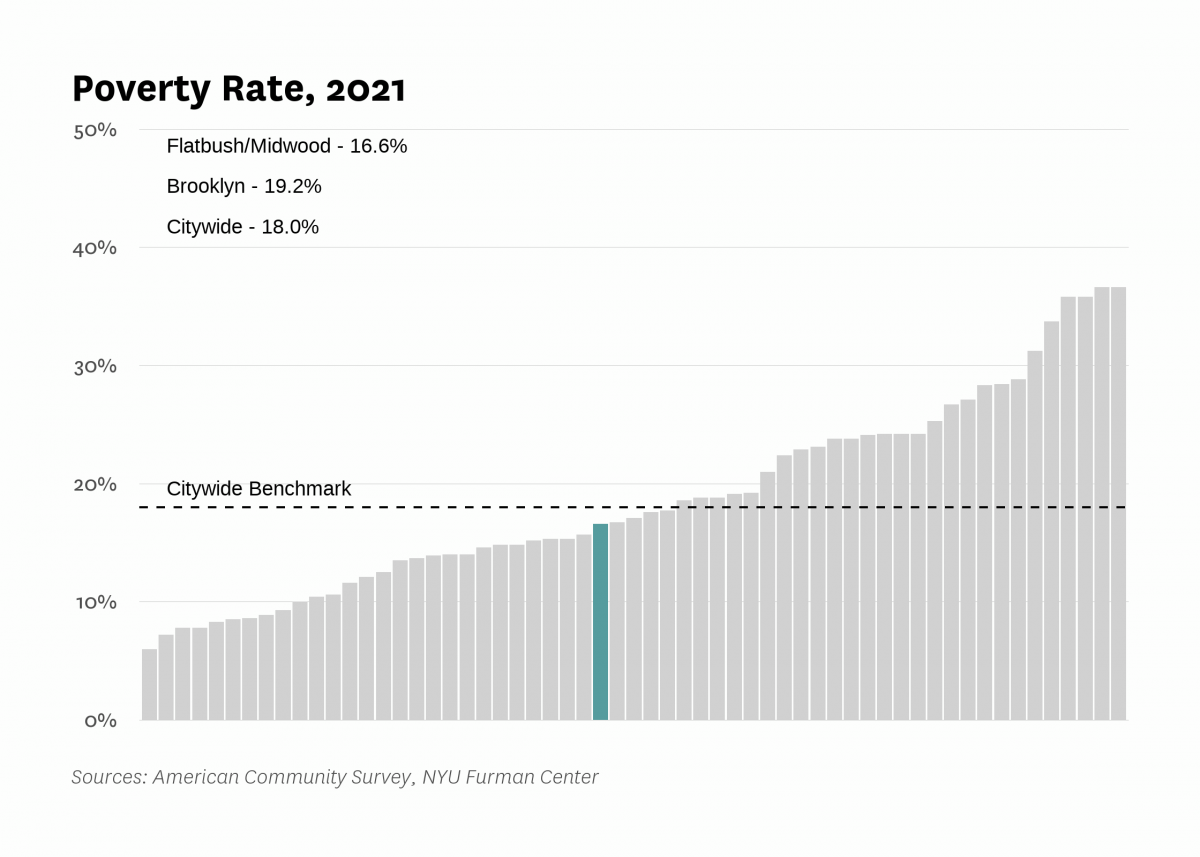
| Poverty rate | 22.8% | 18.1% | 22.4% | 12.0% | 16.6% | |
| Poverty rate, population aged 65+ | 28.0% | 25.7% | 23.0% | 21.5% | ||
| Poverty rate, population under 18 years old | 23.3% | 31.8% | 7.9% | 18.1% | ||
| Labor Market | ||||||
| Labor force participation rate | 58.6% | 62.6% | 64.5% | 61.5% | ||
| Population aged 25+ without a high school diploma | 17.7% | 17.3% | 13.6% | 12.4% | ||
| Unemployment rate | 10.70% | 7.37% | 11.12% | 3.62% | 8.38% | |
| Indicator | 2000 | 2006 | 2010 | 2019 | 2021 | 2022 |
|---|---|---|---|---|---|---|
| Housing Stock | ||||||
| Homeownership rate | 20.4% | 22.8% | 24.3% | 24.6% | 23.6% | |
| Housing units | 61,145 | 60,011 | 60,160 | 68,790 | ||
| Rental vacancy rate | 3.2% | 2.7% | 2.1% | |||
| Serious housing code violations (per 1,000 privately owned rental units) | 103.6 | 109.7 | 178.9 | 181.5 | 192.1 | |
| Severe crowding rate (% of renter households) | 5.7% | 7.4% | 6.6% | |||
| Total housing code violations (per 1,000 privately owned rental units) | 562.0 | 506.3 | 667.7 | 632.5 | 607.7 | |
| Finance - Distress | ||||||
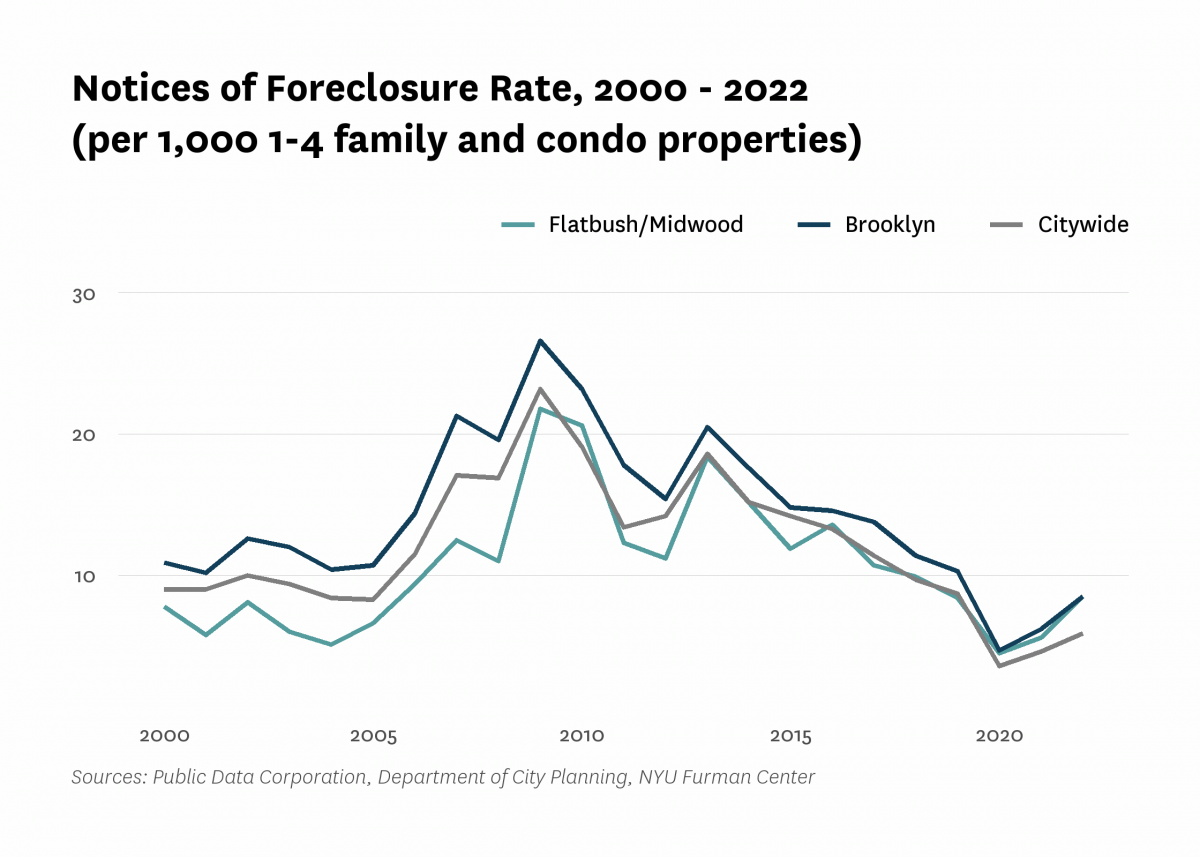
| Notices of foreclosure rate (per 1,000 1-4 family and condo properties) | 7.8 | 9.4 | 20.6 | 8.4 | 5.6 | 8.5 |
| Notices of foreclosure, all residential properties | 79 | 99 | 222 | 95 | 64 | 93 |
| Notices of foreclosure, initial, 1-4 family and condo properties | 59 | 57 | 127 | 36 | 18 | 31 |
| Notices of foreclosure, repeat, 1-4 family and condo properties | 10 | 27 | 63 | 45 | 37 | 55 |
| Pre-foreclosure notice rate (per 1,000 1-4 family and condo properties) | 56.1 | 21.8 | 49.9 | |||
| Pre-foreclosure notices, 1-4 family and condo properties | 541 | 220 | 504 | |||
| Properties entering REO, 1-4 family | 3 | 1 | 0 | |||
| Finance - Lending | ||||||
| FHA/VA-backed home purchase loans (% of home purchase loans) | 0.2% | 11.0% | 1.0% | 0.6% | ||
| Higher-cost home purchase loans (% of home purchase loans) | 11.5% | 0.4% | 1.9% | 1.4% | ||
| Higher-cost refinance loans (% of refinance loans) | 21.7% | 1.1% | 4.2% | 0.3% | ||
| Home purchase loan rate (per 1,000 properties) | 34.0 | 16.2 | 23.3 | 35.8 | ||
| Home purchase loans in LMI tracts (% of home purchase loans) | 62.8% | 7.5% | 47.1% | 43.6% | ||
| Home purchase loans to LMI borrowers (% of home purchase loans) | 11.4% | 48.0% | 6.2% | 9.8% | ||
| Refinance loan rate (per 1,000 properties) | 38.9 | 20.2 | 18.7 | 42.1 | ||
| Sales - Volume | ||||||
| Sales volume, 1 family building | 183 | 187 | 89 | 90 | 122 | 155 |
| Sales volume, 2-4 family building | 129 | 131 | 55 | 58 | 58 | 99 |
| Sales volume, 5+ family building | 13 | 59 | 26 | 32 | 17 | 25 |
| Sales volume, condominium | 10 | 18 | 47 | 123 | 120 | 114 |
| Sales volume, all property types | 335 | 395 | 217 | 303 | 317 | 393 |
| Sales - Median Prices | ||||||
| Median sales price per unit, 1 family building (2022$) | $628,780 | $1,022,330 | $965,710 | $1,201,370 | $1,326,280 | $1,295,000 |
| Median sales price per unit, 2-4 family building (2022$) | $237,920 | $425,090 | $347,660 | $638,310 | $675,610 | $599,500 |
| Median sales price per unit, 5+ family building (2022$) | $66,280 | $119,300 | $122,100 | $168,800 | $193,570 | $169,790 |
| Median sales price per unit, condominium (2022$) | $176,310 | $564,970 | $508,610 | $675,510 | $641,920 | $602,300 |
| Sales - Housing Price Index | ||||||
| Index of housing price appreciation, 1 family building | 100.0 | 212.2 | 178.2 | 335.1 | 380.0 | 383.5 |
| Index of housing price appreciation, 2-4 family building | 100.0 | 219.1 | 155.0 | 364.6 | 383.1 | 399.0 |
| Index of housing price appreciation, 5+ family building | 100.0 | 253.9 | 288.9 | 630.8 | 647.4 | 459.9 |
| Index of housing price appreciation, condominium | 100.0 | 380.3 | 322.8 | 626.9 | 639.7 | 665.3 |
| Index of housing price appreciation, all property types | 100.0 | 213.1 | 183.8 | 374.9 | 386.3 | 392.6 |
| Subsidized Housing | ||||||
| Total number of subsidized properties (properties) | 78 | |||||
| HUD Financing or Insurance (properties) | 3 | |||||
| HUD Financing or Insurance (units) | 196 | |||||
| HUD Project-based Rental Assistance Program (properties) | 5 | |||||
| HUD Project-based Rental Assistance Program (units) | 356 | |||||
| Low Income Housing Tax Credit (properties) | 7 | |||||
| Low Income Housing Tax Credit (units) | 400 | |||||
| Public Housing (properties) | 0 | |||||
| Public Housing (units) | 0 | |||||
| Mitchell-Lama (properties) | 0 | |||||
| Mitchell-Lama (units) | 0 | |||||
| 421-a Tax Exemption (properties) | 108 | |||||
| 421-a Tax Exemption (units) | 3,049 | |||||
| 420-c Tax Exemption (properties) | 8 | |||||
| 420-c Tax Exemption (units) | 589 | |||||
| NYC Housing Production Programs and Zoning Incentives or Requirements (properties) | 54 | |||||
| Eligible to expire from housing programs between 2023 and 2028 (properties) | 3 | |||||
| Eligible to expire from housing programs between 2023 and 2028 (units) | 168 | |||||
| Eligible to expire from housing programs between 2029 and 2038 (properties) | 4 | |||||
| Eligible to expire from housing programs between 2029 and 2038 (units) | 336 | |||||
| Eligible to expire from housing programs in 2039 and later (properties) | 5 | |||||
| Eligible to expire from housing programs in 2039 and later (units) | 260 | |||||
| Indicator | 2000 | 2006 | 2010 | 2019 | 2021 | 2022 |
|---|---|---|---|---|---|---|
| Density | ||||||
| Population density (1,000 persons per square mile) | 56.1 | 56.0 | 54.0 | 59.5 | ||
| Development | ||||||
| Units authorized by new residential building permits | 0 | 0 | 6 | 660 | 129 | 1,406 |
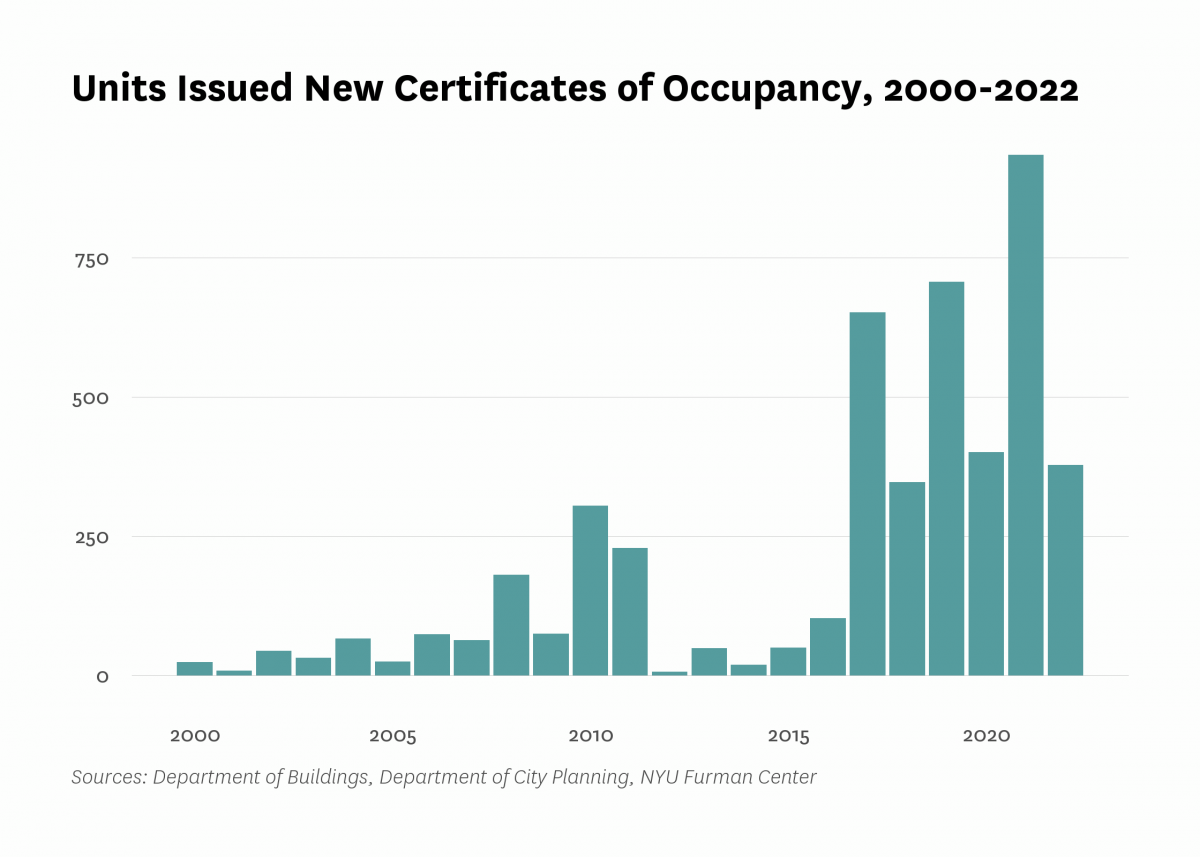
| Units issued new certificates of occupancy | 24 | 74 | 305 | 706 | 934 | 378 |
| Indicator | 2000 | 2006 | 2010 | 2019 | 2021 | 2022 |
|---|---|---|---|---|---|---|
| Commute | ||||||
| Car-free commute (% of commuters) | 68.1% | 70.6% | 73.8% | 73.5% | 62.4% | |
| Mean travel time to work (minutes) | 46.0 | 44.4 | 41.7 | 43.9 | 44.7 | |
| Crime and Incarceration | ||||||
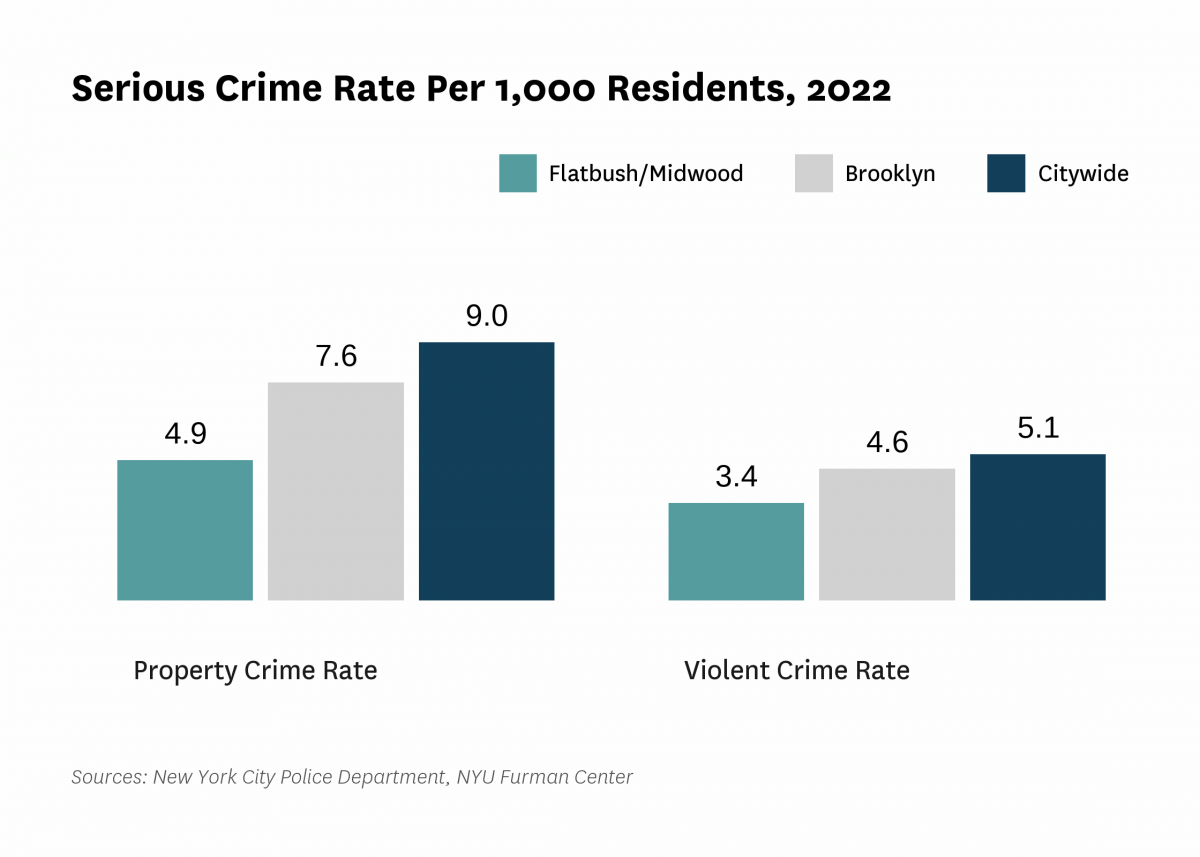
| Serious crime rate (per 1,000 residents) | 15.1 | 12.3 | 7.4 | 8.6 | 8.4 | |
| Serious crime rate, property (per 1,000 residents) | 9.6 | 7.5 | 4.8 | 5.4 | 4.9 | |
| Serious crime rate, violent (per 1,000 residents) | 5.5 | 4.8 | 2.6 | 3.3 | 3.4 | |
| Schools | ||||||
| Students performing at grade level in English language arts, 4th grade | 52.7% | 46.0% | ||||
| Students performing at grade level in math, 4th grade | 50.9% | 46.2% | ||||
| Indicator | 2000 | 2006 | 2010 | 2019 | 2021 | 2022 |
|---|---|---|---|---|---|---|
| Median Rent | ||||||
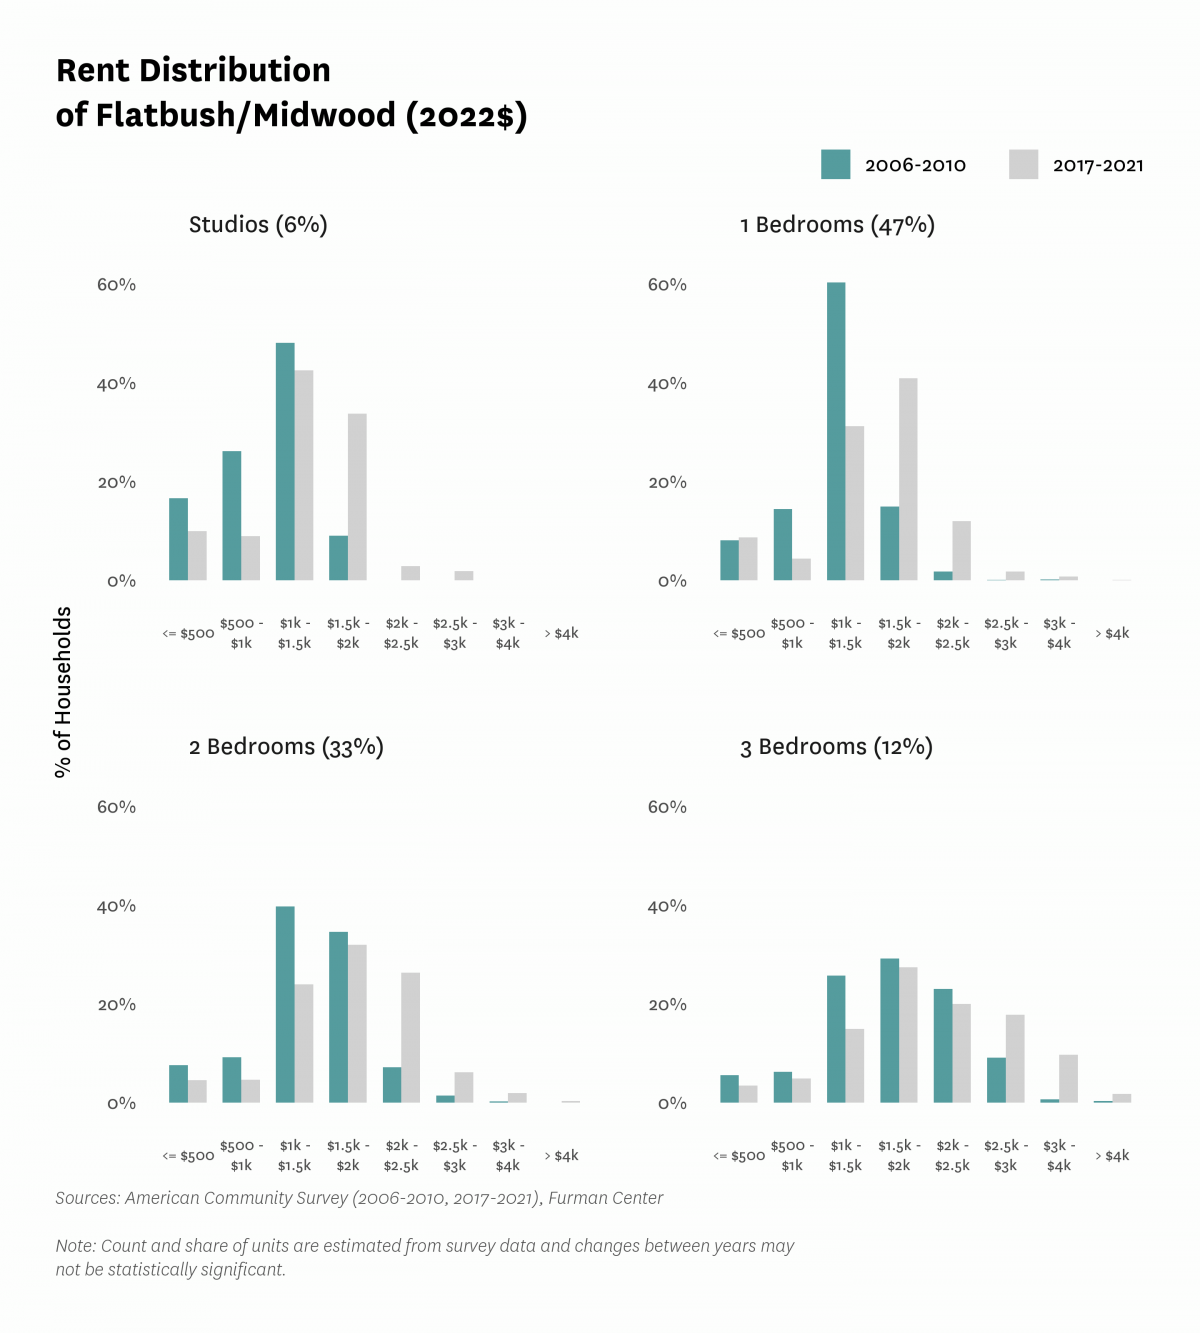
| Median rent, 2- and 3-bedrooms (2022$) | $1,500 | $1,720 | $1,850 | |||
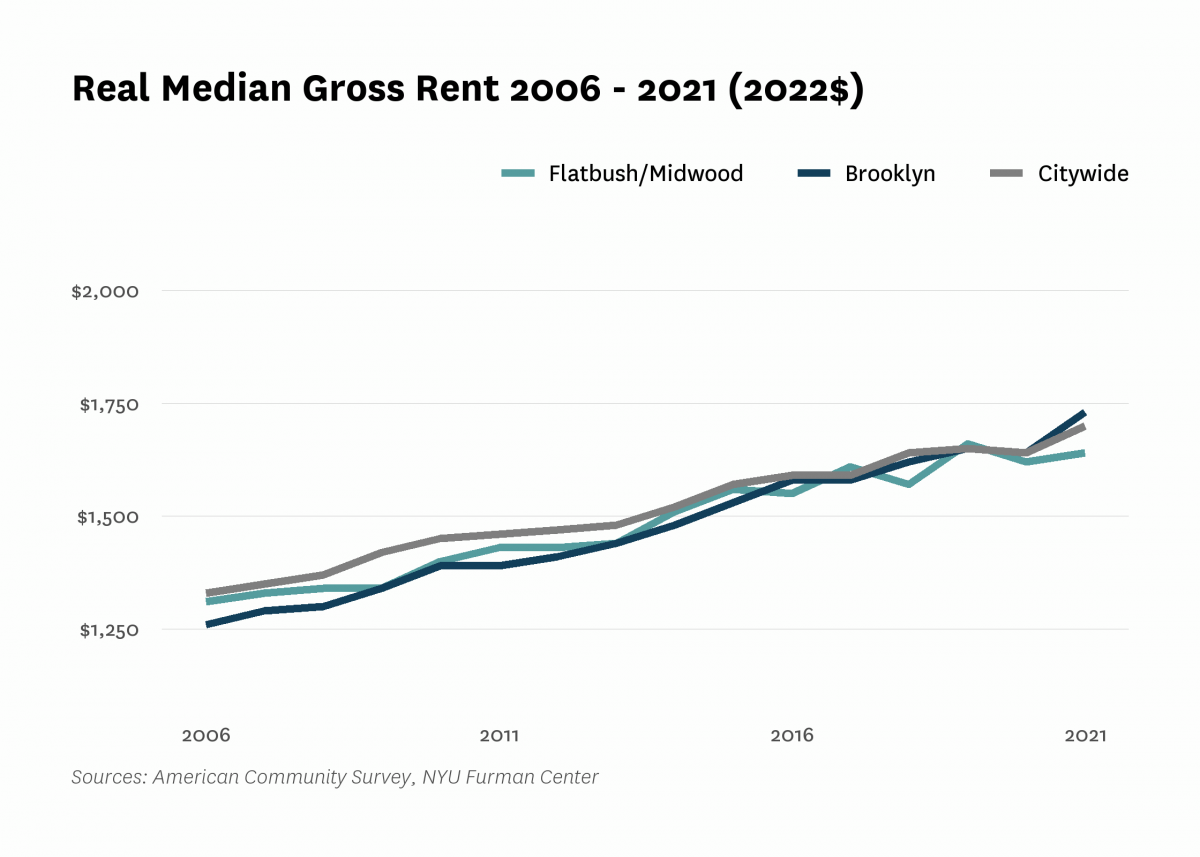
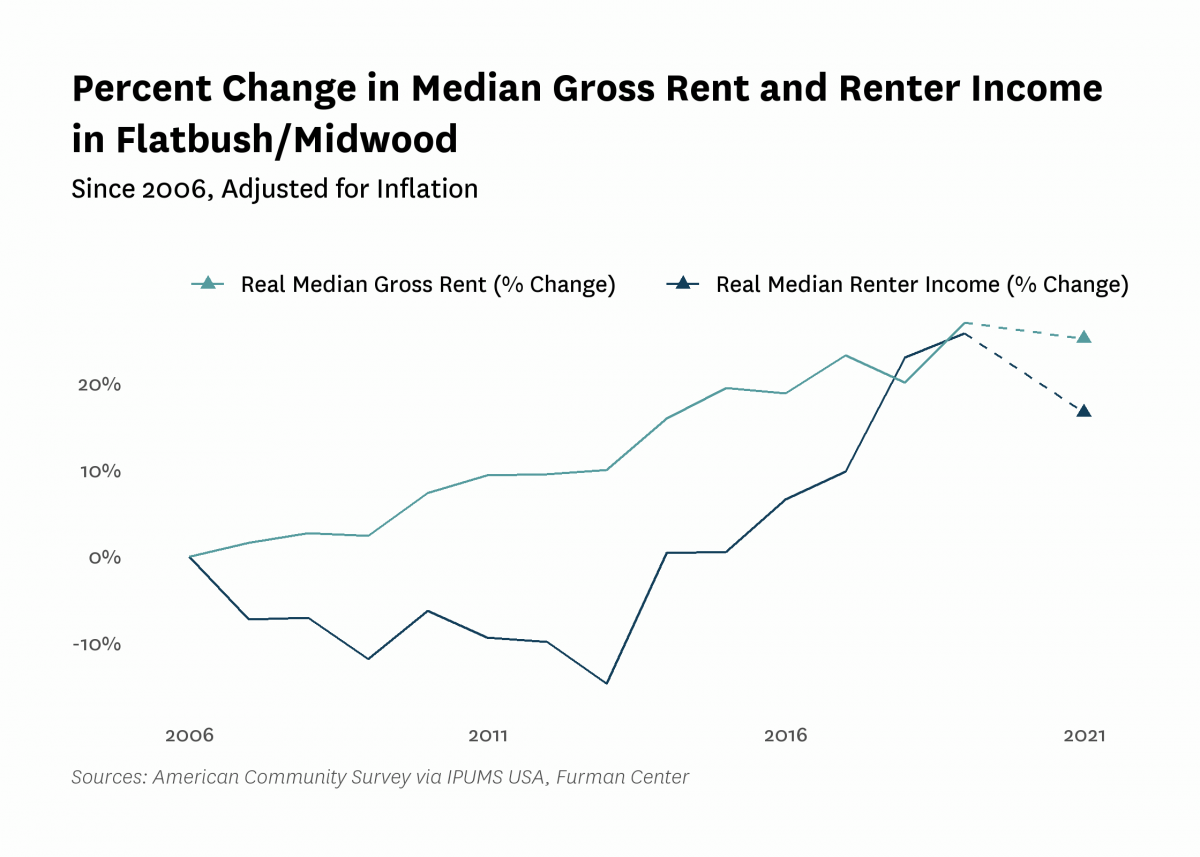
| Median rent, all (2022$) | $1,180 | $1,310 | $1,400 | $1,660 | $1,640 | |
| Median rent, recent movers (2022$) | $1,410 | $1,850 | $1,990 | |||
| Median rent, studios and 1-bedrooms (2022$) | $1,240 | $1,440 | $1,540 | |||
| Change in collected rent (2019-2020) | 1.5% | |||||
| Affordability | ||||||
| Rental units affordable at 30% AMI (% of recently available units) | 4.9% | 3.9% | 6.6% | |||
| Rental units affordable at 80% AMI (% of recently available units) | 70.3% | 57.0% | 60.5% | |||
| Rental units affordable at 120% AMI (% of recently available units) | 98.0% | 97.9% | 96.4% | |||
| Rent Burden | ||||||
| Moderately rent-burdened households | 24.6% | 26.7% | 25.9% | 21.4% | ||
| Moderately rent-burdened households, low income | 34.4% | 30.5% | 31.1% | |||
| Moderately rent-burdened households, moderate income | 9.6% | 12.5% | 12.8% | |||
| Severely rent-burdened households | 28.2% | 29.7% | 32.5% | 29.6% | ||
| Severely rent-burdened households, low income | 44.2% | 47.0% | 44.9% | |||
| Severely rent-burdened households, moderate income | 0.3% | 0.0% | 0.0% | |||
| Rental Subsidy | ||||||
| Housing choice vouchers (% of occupied, privately owned rental units) | 7.8% | 5.8% | ||||
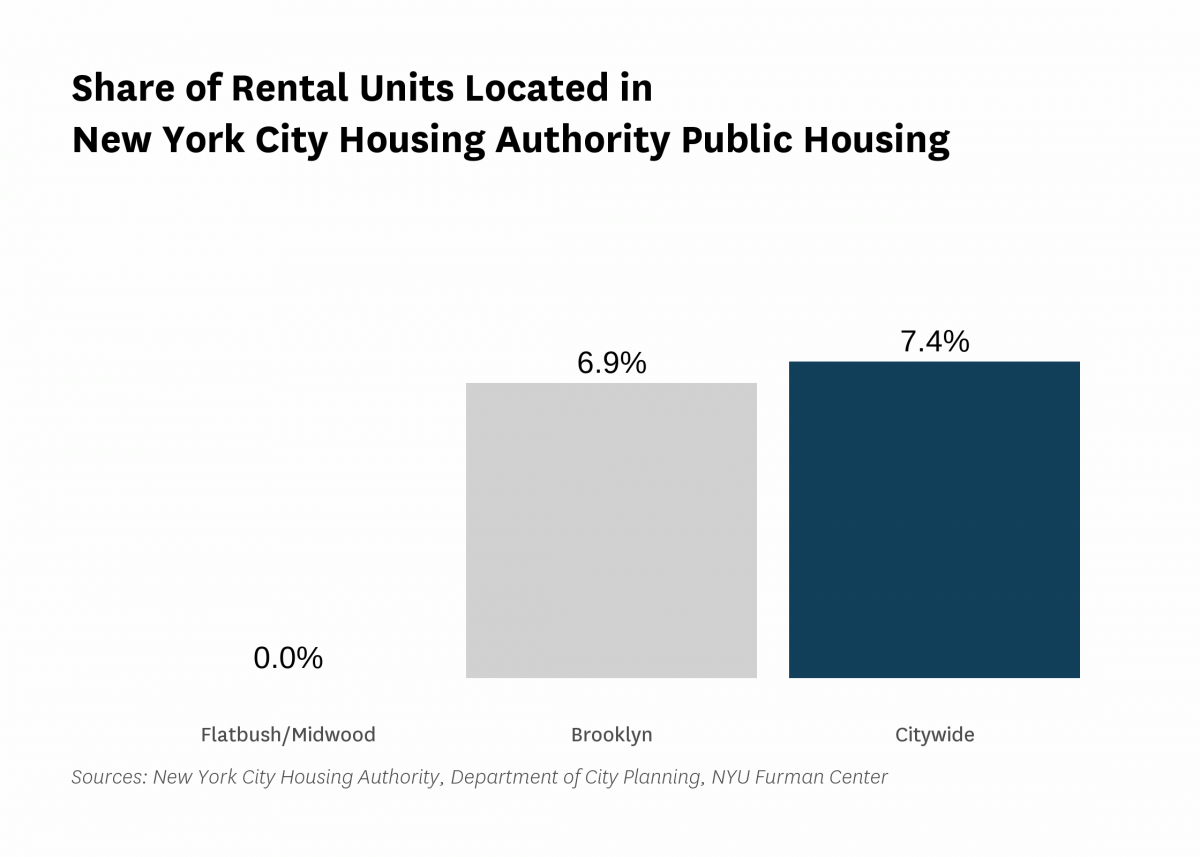
| Public housing (% of rental units) | 0.0% | |||||
Data Notes: See CoreData User Guide for more information about indicator definitions and methods.
Indicators: The rental vacancy rate, severe crowding rate, and the severely rent-burdened households indicators use five-year American Community Survey (ACS) estimates. Data under the 2010 heading comes from the 2006 – 2010 ACS, data under the 2019 heading comes from the 2015 – 2019 ACS and data under the 2021 heading comes from 2017 – 2021 ACS .
All content © 2005 – 2024 Furman Center for Real Estate and Urban Policy | Top of page | Contact Us