| Indicator | 2000 | 2006 | 2010 | 2019 | 2021 | 2022 |
|---|---|---|---|---|---|---|
| Population | ||||||
| Born in New York State | 55.0% | 54.3% | 59.5% | 55.8% | ||
| Disabled population | 6.8% | 8.8% | 7.3% | |||
| Foreign-born population | 33.8% | 34.1% | 32.9% | 32.5% | 36.1% | |
| Population | 146,857 | 161,064 | 146,614 | 180,811 | 178,925 | |
| Population aged 65+ | 8.3% | 7.9% | 10.6% | 13.0% | 14.6% | |
| Households | ||||||
| Households with children under 18 years old | 50.3% | 48.7% | 47.0% | 40.9% | 38.4% | |
| Single-person households | 23.3% | 25.0% | 25.6% | 30.0% | ||
| Race and Ethnicity | ||||||
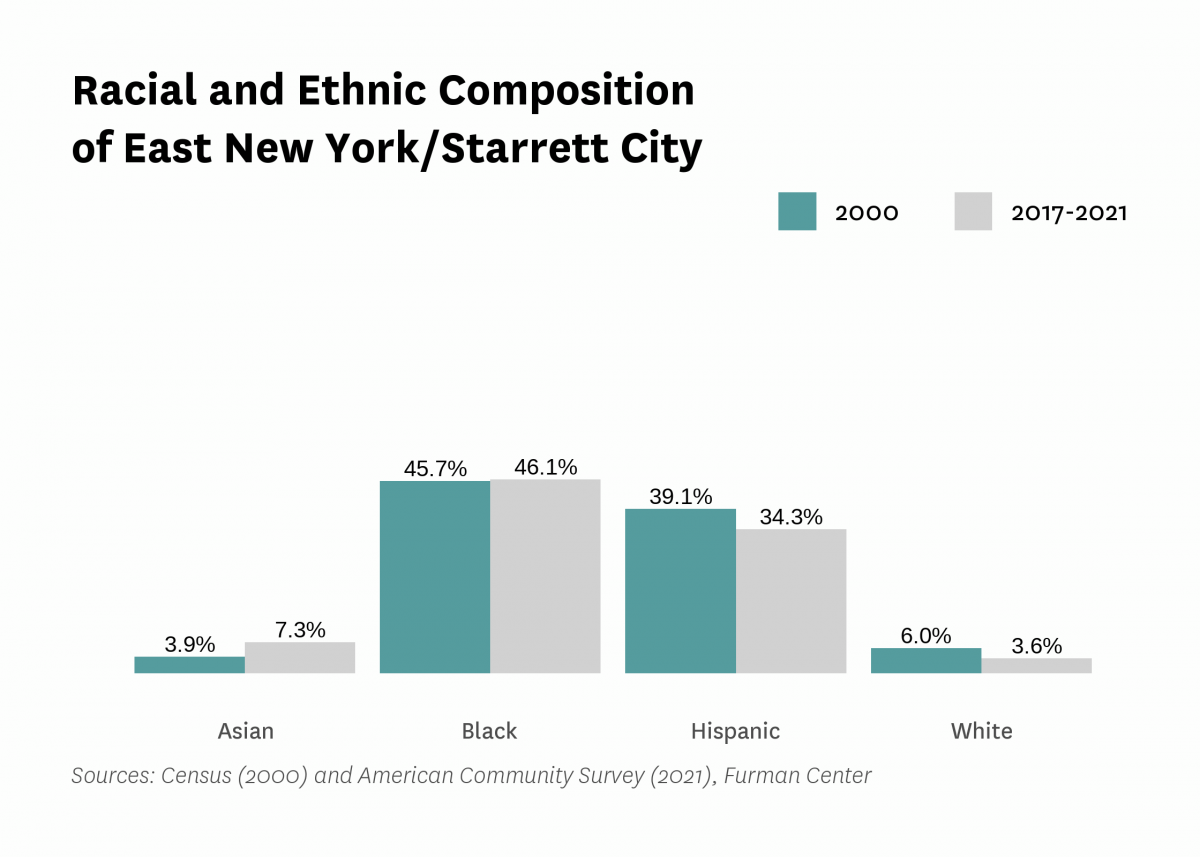
| Percent Asian | 3.9% | 6.2% | 2.9% | 4.0% | 7.3% | |
| Percent Black | 45.7% | 45.6% | 54.7% | 55.4% | 46.1% | |
| Percent Hispanic | 39.1% | 38.5% | 36.9% | 34.9% | 34.3% | |
| Percent white | 6.0% | 5.1% | 4.7% | 4.2% | 3.6% | |
| Racial diversity index | 0.63 | 0.64 | 0.56 | 0.57 | 0.66 | |
| Income and Poverty | ||||||
| Income diversity ratio | 6.1 | 6.0 | 5.0 | 5.4 | ||
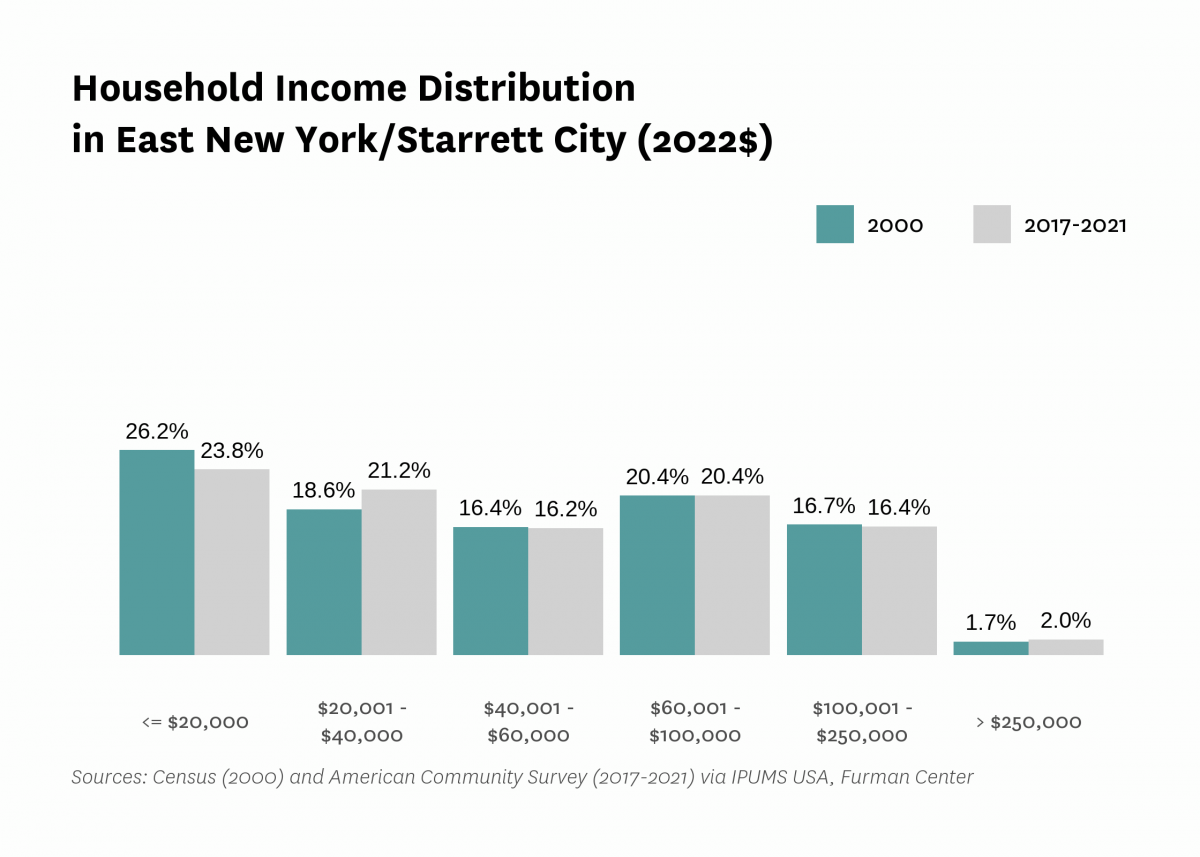
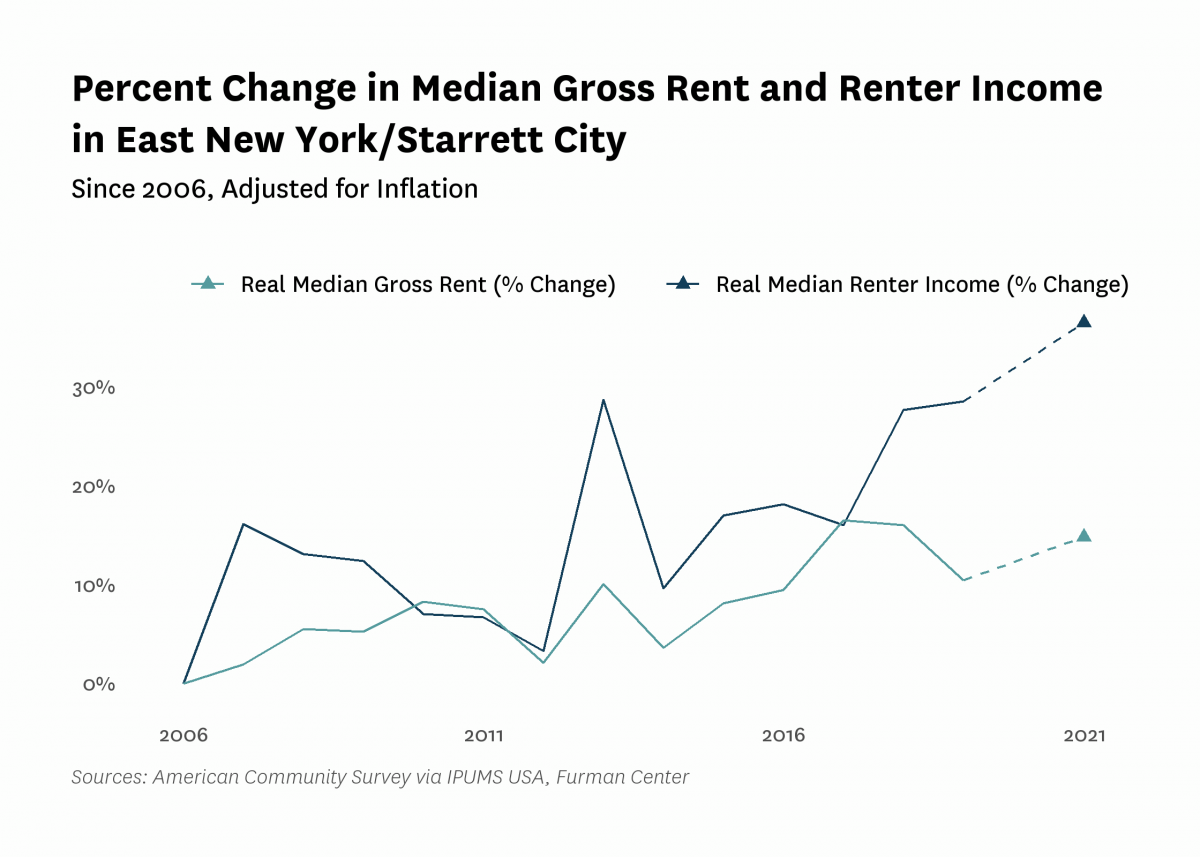
| Median household income (2022$) | $48,010 | $39,440 | $40,640 | $51,280 | $55,880 | |
| Median household income, homeowners (2022$) | $84,340 | $66,160 | $99,350 | $89,520 | ||
| Median household income, renters (2022$) | $30,540 | $32,690 | $39,260 | $41,700 | ||
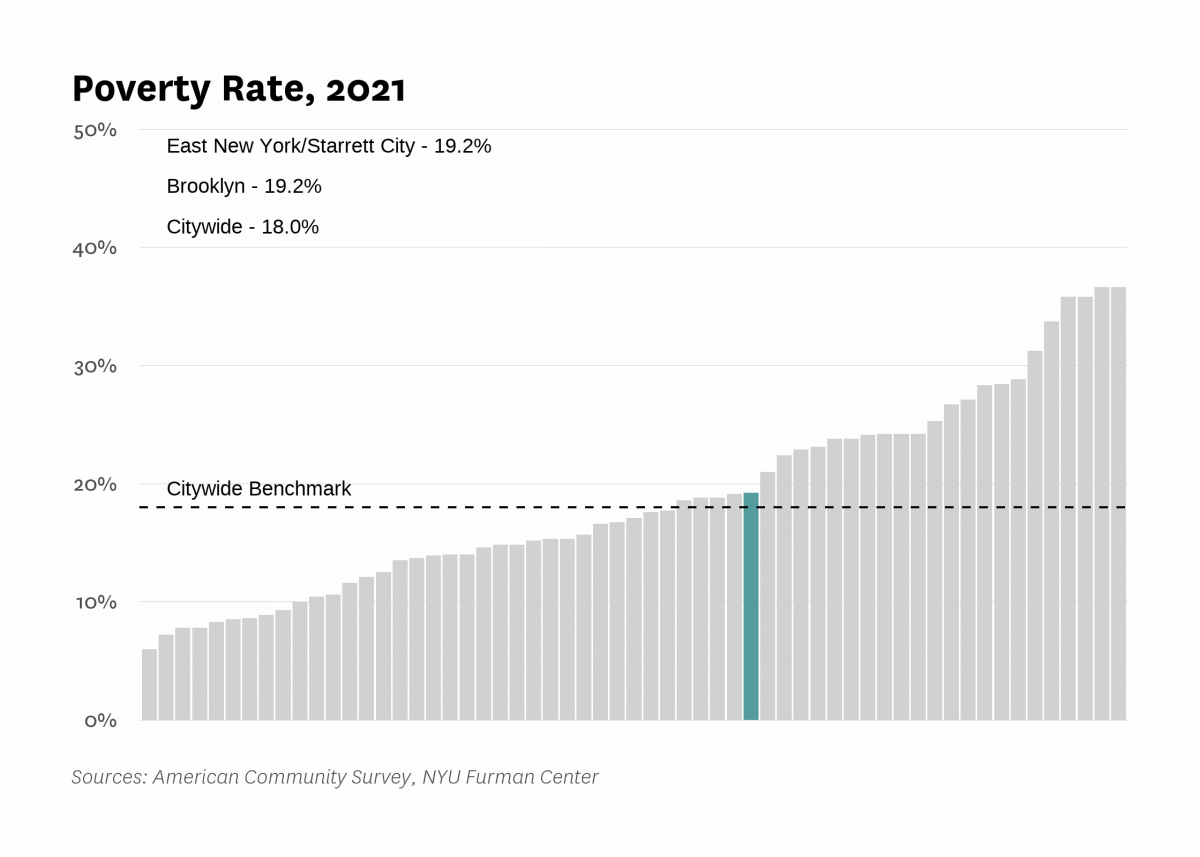
| Poverty rate | 31.3% | 27.8% | 36.0% | 23.3% | 19.2% | |
| Poverty rate, population aged 65+ | 31.9% | 31.5% | 23.0% | 21.7% | ||
| Poverty rate, population under 18 years old | 32.4% | 49.1% | 31.6% | 23.4% | ||
| Labor Market | ||||||
| Labor force participation rate | 54.2% | 51.9% | 54.5% | 55.4% | ||
| Population aged 25+ without a high school diploma | 21.0% | 25.2% | 15.9% | 19.2% | ||
| Unemployment rate | 15.22% | 7.21% | 12.29% | 3.85% | 12.80% | |
| Indicator | 2000 | 2006 | 2010 | 2019 | 2021 | 2022 |
|---|---|---|---|---|---|---|
| Housing Stock | ||||||
| Homeownership rate | 23.4% | 24.8% | 23.1% | 26.0% | 29.1% | |
| Housing units | 54,000 | 57,200 | 71,022 | 62,776 | ||
| Rental vacancy rate | 4.8% | 5.0% | 3.6% | |||
| Serious housing code violations (per 1,000 privately owned rental units) | 94.0 | 132.7 | 131.7 | 123.5 | 121.2 | |
| Severe crowding rate (% of renter households) | 4.1% | 4.7% | 5.4% | |||
| Total housing code violations (per 1,000 privately owned rental units) | 442.8 | 431.9 | 496.0 | 486.5 | 448.6 | |
| Finance - Distress | ||||||
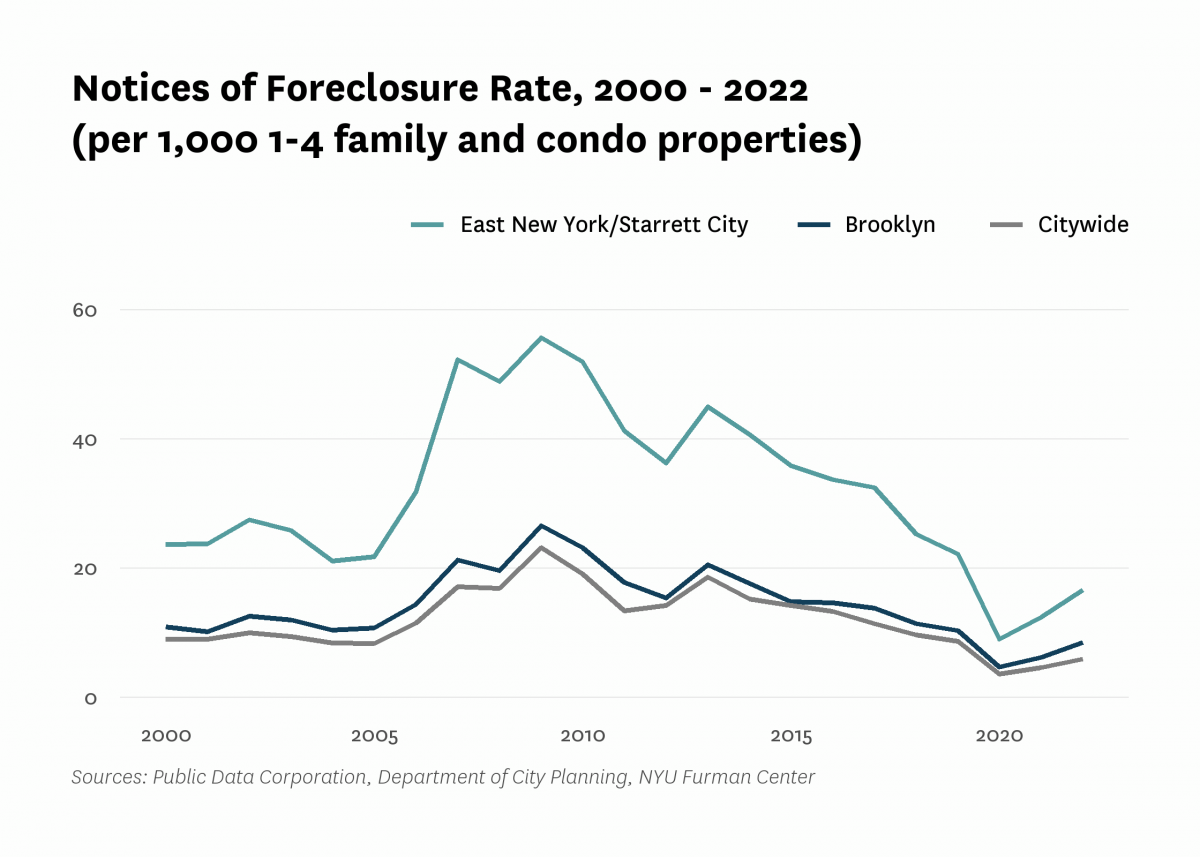
| Notices of foreclosure rate (per 1,000 1-4 family and condo properties) | 23.7 | 31.8 | 52.0 | 22.2 | 12.4 | 16.6 |
| Notices of foreclosure, all residential properties | 387 | 561 | 939 | 400 | 231 | 302 |
| Notices of foreclosure, initial, 1-4 family and condo properties | 299 | 454 | 532 | 157 | 63 | 110 |
| Notices of foreclosure, repeat, 1-4 family and condo properties | 57 | 76 | 354 | 226 | 151 | 177 |
| Pre-foreclosure notice rate (per 1,000 1-4 family and condo properties) | 90.0 | 43.7 | 88.4 | |||
| Pre-foreclosure notices, 1-4 family and condo properties | 1,552 | 754 | 1,525 | |||
| Properties entering REO, 1-4 family | 93 | 16 | 55 | |||
| Finance - Lending | ||||||
| FHA/VA-backed home purchase loans (% of home purchase loans) | 1.2% | 62.7% | 41.8% | 44.6% | ||
| Higher-cost home purchase loans (% of home purchase loans) | 50.7% | 1.3% | 17.0% | 10.3% | ||
| Higher-cost refinance loans (% of refinance loans) | 43.4% | 6.8% | 6.3% | 2.1% | ||
| Home purchase loan rate (per 1,000 properties) | 93.4 | 25.5 | 22.2 | 24.7 | ||
| Home purchase loans in LMI tracts (% of home purchase loans) | 89.6% | 24.1% | 70.6% | 63.6% | ||
| Home purchase loans to LMI borrowers (% of home purchase loans) | 1.5% | 64.3% | 6.1% | 12.7% | ||
| Refinance loan rate (per 1,000 properties) | 112.8 | 9.9 | 24.4 | 45.6 | ||
| Sales - Volume | ||||||
| Sales volume, 1 family building | 271 | 241 | 64 | 91 | 74 | 98 |
| Sales volume, 2-4 family building | 659 | 1,377 | 329 | 367 | 183 | 307 |
| Sales volume, 5+ family building | 25 | 38 | 13 | 19 | 12 | 16 |
| Sales volume, condominium | 2 | 11 | 116 | 36 | 57 | 34 |
| Sales volume, all property types | 957 | 1,667 | 522 | 513 | 326 | 455 |
| Sales - Median Prices | ||||||
| Median sales price per unit, 1 family building (2022$) | $187,680 | $519,950 | $370,960 | $535,180 | $580,570 | $592,500 |
| Median sales price per unit, 2-4 family building (2022$) | $152,950 | $333,750 | $208,140 | $319,710 | $392,580 | $350,000 |
| Median sales price per unit, 5+ family building (2022$) | $52,580 | $129,990 | $96,570 | $198,740 | $180,820 | $200,000 |
| Median sales price per unit, condominium (2022$) | $97,720 | $238,890 | $252,860 | $362,360 | $334,590 | $340,000 |
| Sales - Housing Price Index | ||||||
| Index of housing price appreciation, 1 family building | 100.0 | 227.8 | 164.3 | 324.9 | 370.5 | 378.1 |
| Index of housing price appreciation, 2-4 family building | 100.0 | 258.3 | 151.2 | 290.2 | 373.5 | 335.2 |
| Index of housing price appreciation, 5+ family building | 100.0 | 211.7 | 193.7 | 315.1 | 390.4 | 432.7 |
| Index of housing price appreciation, condominium | 100.0 | 45.0 | 66.2 | 87.3 | 88.0 | |
| Index of housing price appreciation, all property types | 100.0 | 253.8 | 161.2 | 296.6 | 363.2 | 345.3 |
| Subsidized Housing | ||||||
| Total number of subsidized properties (properties) | 625 | |||||
| HUD Financing or Insurance (properties) | 4 | |||||
| HUD Financing or Insurance (units) | 393 | |||||
| HUD Project-based Rental Assistance Program (properties) | 40 | |||||
| HUD Project-based Rental Assistance Program (units) | 8,828 | |||||
| Low Income Housing Tax Credit (properties) | 132 | |||||
| Low Income Housing Tax Credit (units) | 4,759 | |||||
| Public Housing (properties) | 18 | |||||
| Public Housing (units) | 4,667 | |||||
| Mitchell-Lama (properties) | 9 | |||||
| Mitchell-Lama (units) | 6,077 | |||||
| 421-a Tax Exemption (properties) | 34 | |||||
| 421-a Tax Exemption (units) | 798 | |||||
| 420-c Tax Exemption (properties) | 164 | |||||
| 420-c Tax Exemption (units) | 5,407 | |||||
| NYC Housing Production Programs and Zoning Incentives or Requirements (properties) | 211 | |||||
| Eligible to expire from housing programs between 2023 and 2028 (properties) | 10 | |||||
| Eligible to expire from housing programs between 2023 and 2028 (units) | 515 | |||||
| Eligible to expire from housing programs between 2029 and 2038 (properties) | 41 | |||||
| Eligible to expire from housing programs between 2029 and 2038 (units) | 2,397 | |||||
| Eligible to expire from housing programs in 2039 and later (properties) | 133 | |||||
| Eligible to expire from housing programs in 2039 and later (units) | 10,926 | |||||
| Indicator | 2000 | 2006 | 2010 | 2019 | 2021 | 2022 |
|---|---|---|---|---|---|---|
| Density | ||||||
| Population density (1,000 persons per square mile) | 26.5 | 24.2 | 29.8 | 29.5 | ||
| Development | ||||||
| Units authorized by new residential building permits | 392 | 0 | 390 | 682 | 1,343 | 2,596 |
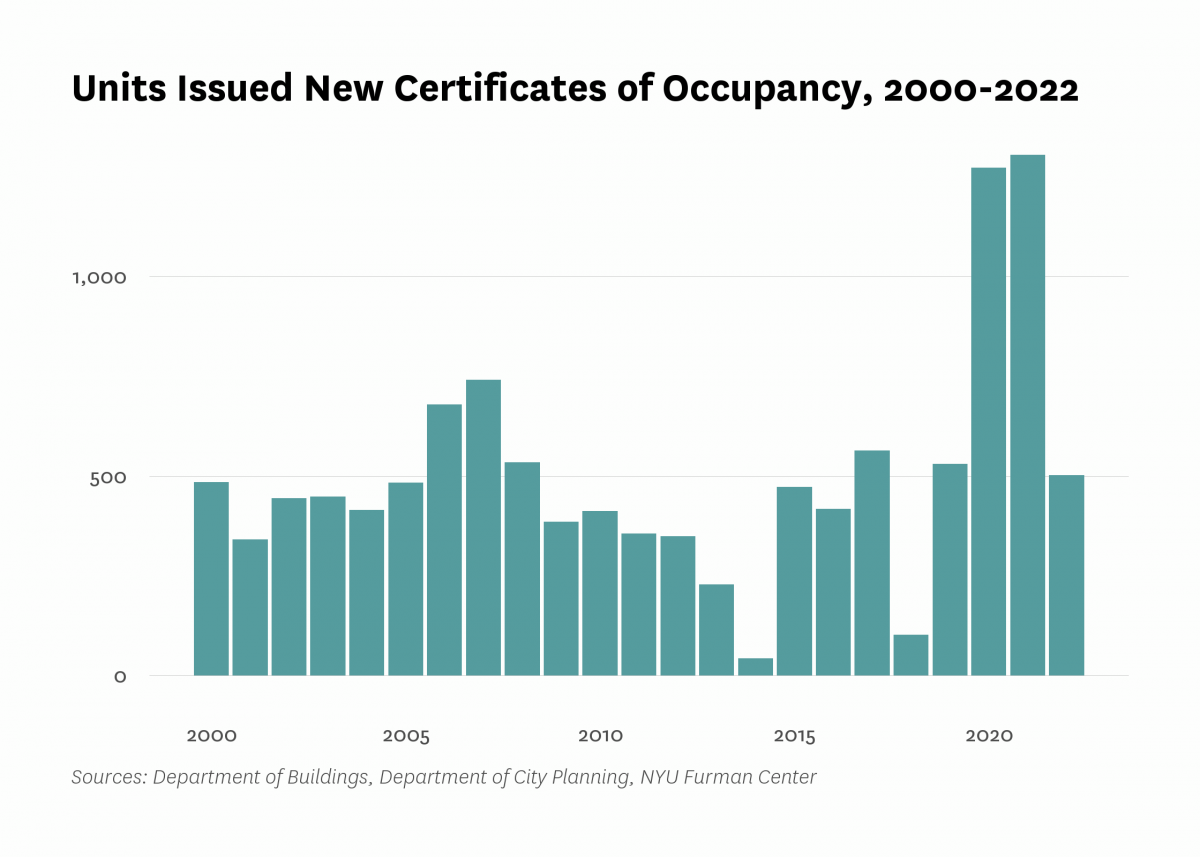
| Units issued new certificates of occupancy | 485 | 679 | 412 | 531 | 1,305 | 503 |
| Indicator | 2000 | 2006 | 2010 | 2019 | 2021 | 2022 |
|---|---|---|---|---|---|---|
| Commute | ||||||
| Car-free commute (% of commuters) | 63.0% | 71.1% | 76.7% | 68.9% | 61.8% | |
| Mean travel time to work (minutes) | 48.2 | 47.0 | 42.1 | 48.3 | 47.2 | |
| Crime and Incarceration | ||||||
| Serious crime rate (per 1,000 residents) | 17.7 | 16.7 | 18.6 | 17.9 | 19.8 | |
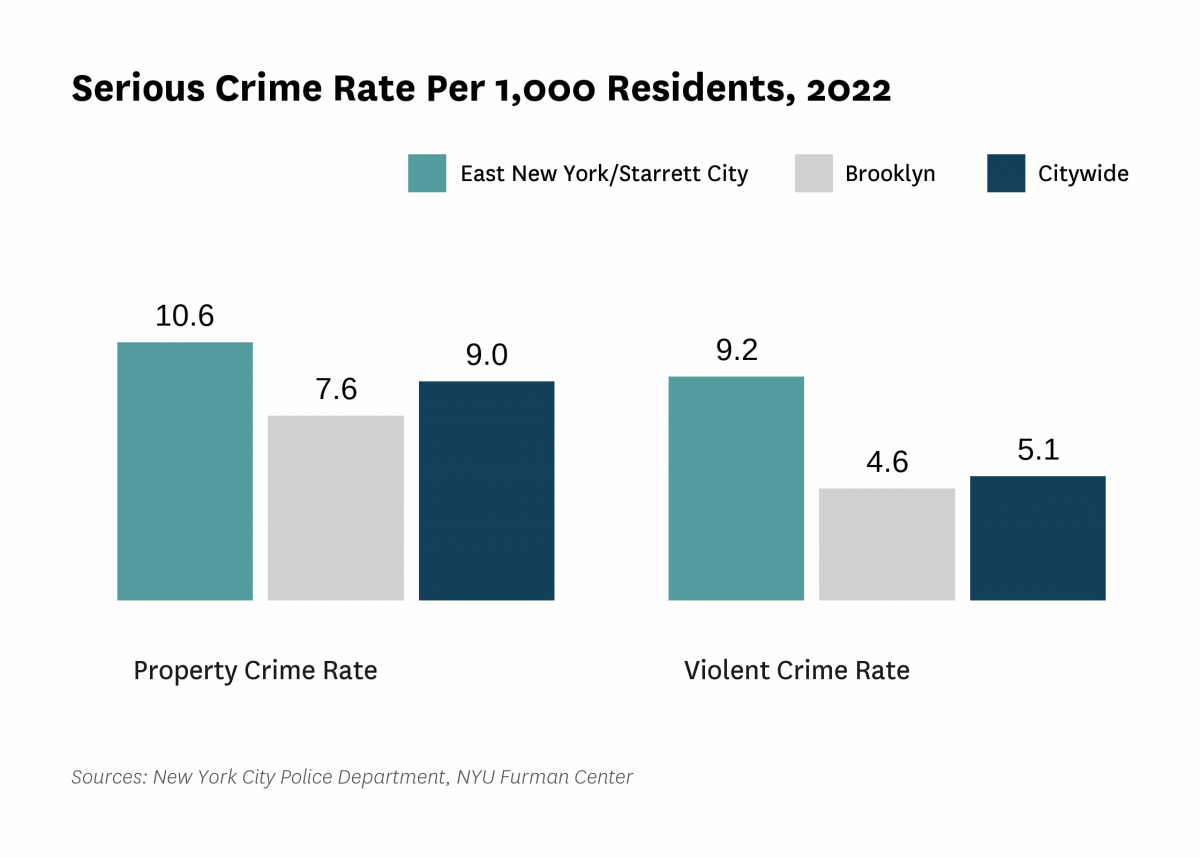
| Serious crime rate, property (per 1,000 residents) | 9.4 | 8.2 | 9.7 | 9.9 | 10.6 | |
| Serious crime rate, violent (per 1,000 residents) | 8.3 | 8.4 | 8.9 | 8.0 | 9.2 | |
| Schools | ||||||
| Students performing at grade level in English language arts, 4th grade | 40.1% | 31.9% | ||||
| Students performing at grade level in math, 4th grade | 38.6% | 31.0% | ||||
| Indicator | 2000 | 2006 | 2010 | 2019 | 2021 | 2022 |
|---|---|---|---|---|---|---|
| Median Rent | ||||||
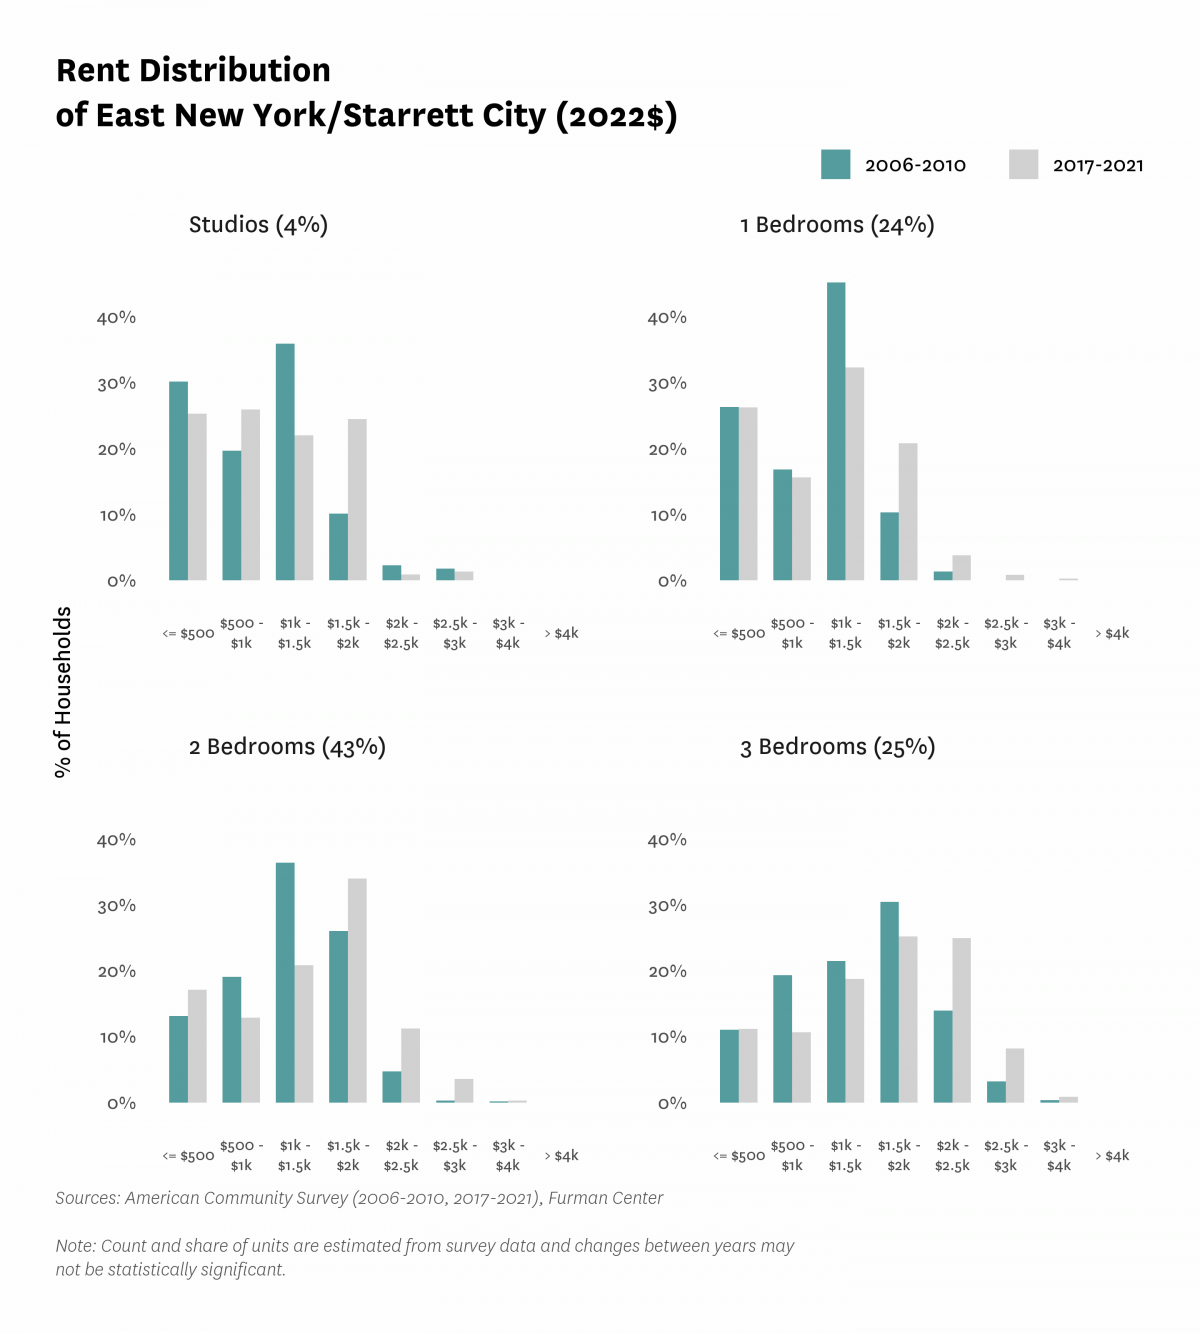
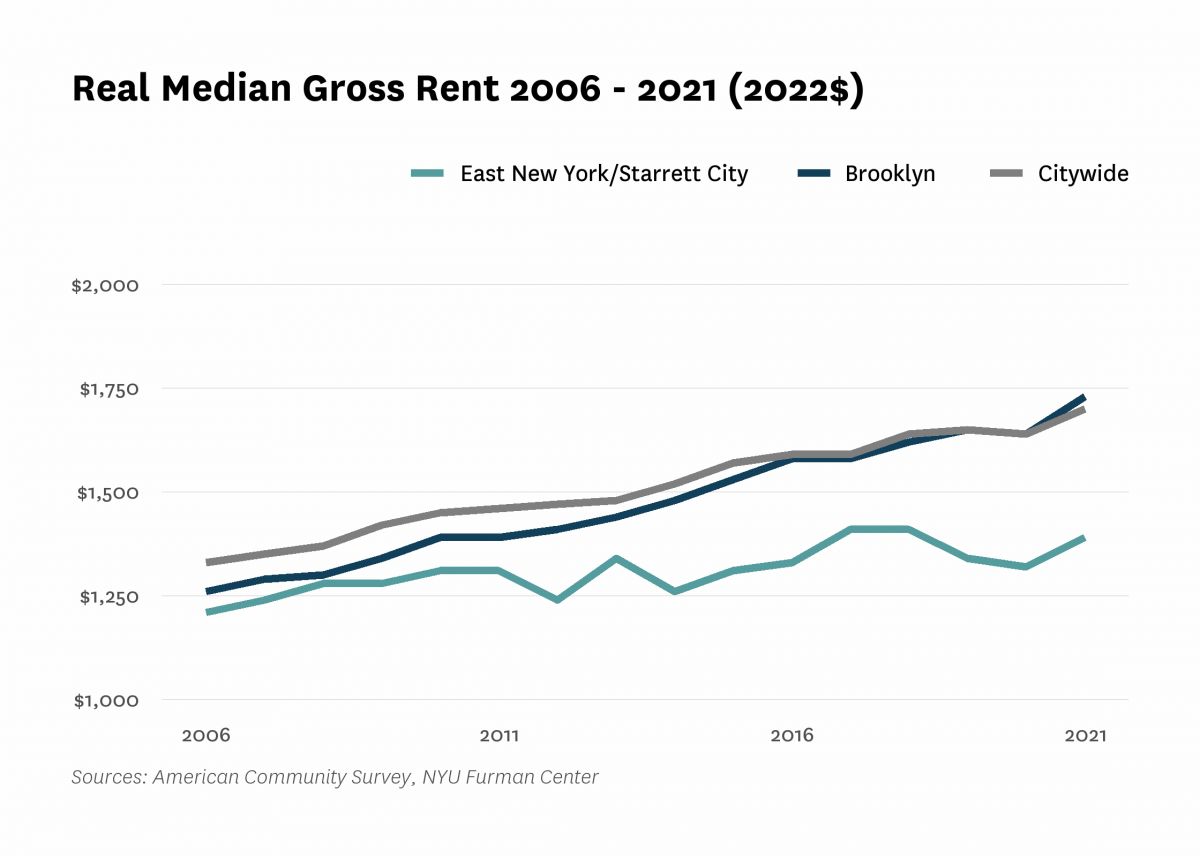
| Median rent, 2- and 3-bedrooms (2022$) | $1,350 | $1,440 | $1,590 | |||
| Median rent, all (2022$) | $1,050 | $1,210 | $1,310 | $1,340 | $1,390 | |
| Median rent, recent movers (2022$) | $1,450 | $1,340 | $1,350 | |||
| Median rent, studios and 1-bedrooms (2022$) | $1,070 | $1,140 | $1,160 | |||
| Change in collected rent (2019-2020) | 2.6% | |||||
| Affordability | ||||||
| Rental units affordable at 30% AMI (% of recently available units) | 13.7% | 22.5% | 21.3% | |||
| Rental units affordable at 80% AMI (% of recently available units) | 81.3% | 89.1% | 87.4% | |||
| Rental units affordable at 120% AMI (% of recently available units) | 99.0% | 99.5% | 100.0% | |||
| Rent Burden | ||||||
| Moderately rent-burdened households | 22.8% | 21.1% | 29.0% | 21.3% | ||
| Moderately rent-burdened households, low income | 27.6% | 30.3% | 27.3% | |||
| Moderately rent-burdened households, moderate income | 4.8% | 5.5% | 5.7% | |||
| Severely rent-burdened households | 27.1% | 33.4% | 33.3% | 32.9% | ||
| Severely rent-burdened households, low income | 41.6% | 40.7% | 39.2% | |||
| Severely rent-burdened households, moderate income | 0.8% | 0.0% | 0.0% | |||
| Rental Subsidy | ||||||
| Housing choice vouchers (% of occupied, privately owned rental units) | 15.4% | 12.2% | ||||
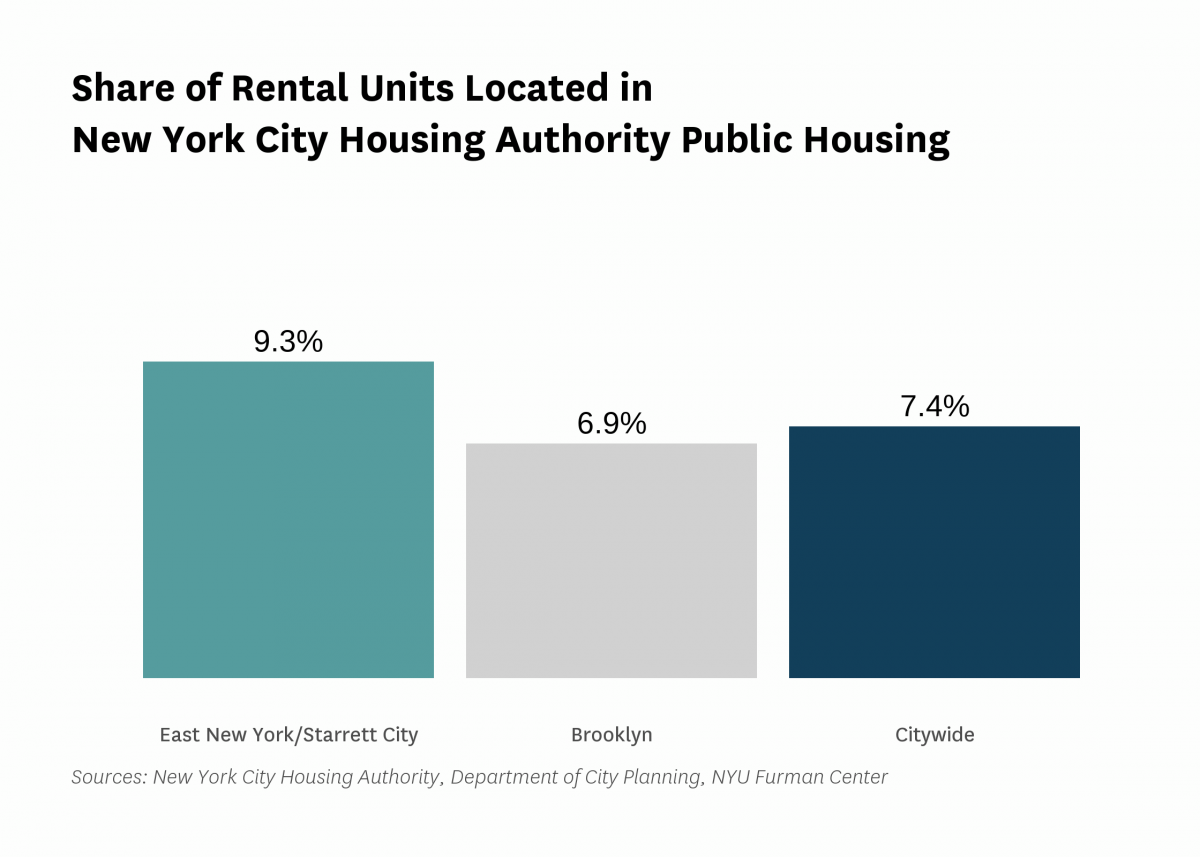
| Public housing (% of rental units) | 9.3% | |||||
Data Notes: See CoreData User Guide for more information about indicator definitions and methods.
Indicators: The rental vacancy rate, severe crowding rate, and the severely rent-burdened households indicators use five-year American Community Survey (ACS) estimates. Data under the 2010 heading comes from the 2006 – 2010 ACS, data under the 2019 heading comes from the 2015 – 2019 ACS and data under the 2021 heading comes from 2017 – 2021 ACS .
All content © 2005 – 2024 Furman Center for Real Estate and Urban Policy | Top of page | Contact Us