| Indicator | 2000 | 2006 | 2010 | 2019 | 2021 | 2022 |
|---|---|---|---|---|---|---|
| Population | ||||||
| Born in New York State | 38.2% | 40.6% | 43.9% | 42.3% | ||
| Disabled population | 6.1% | 5.5% | 5.3% | |||
| Foreign-born population | 54.5% | 53.5% | 52.6% | 48.1% | 50.6% | |
| Population | 145,263 | 147,390 | 140,285 | 136,009 | 139,133 | |
| Population aged 65+ | 9.1% | 11.2% | 11.7% | 17.0% | 18.0% | |
| Households | ||||||
| Households with children under 18 years old | 45.0% | 42.9% | 40.7% | 32.3% | 27.9% | |
| Single-person households | 26.0% | 26.5% | 27.7% | 28.4% | ||
| Race and Ethnicity | ||||||
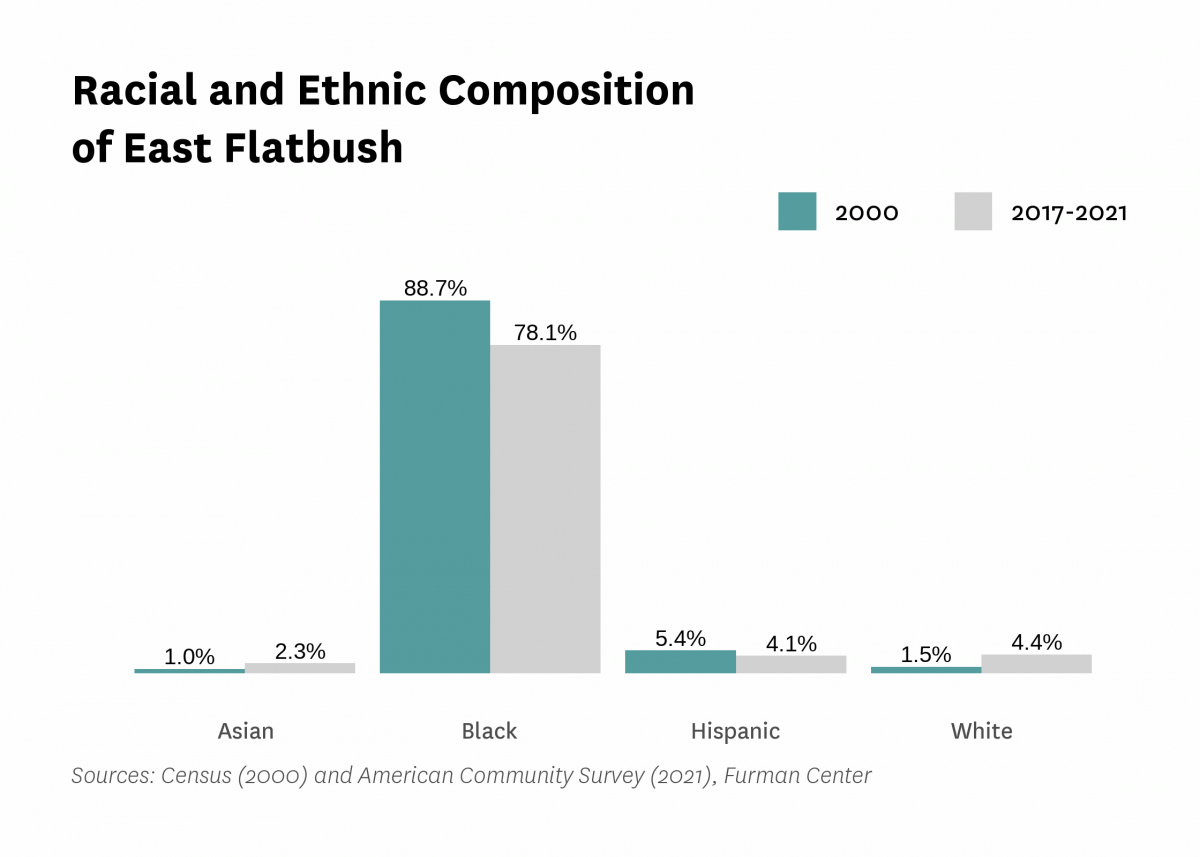
| Percent Asian | 1.0% | 0.3% | 0.8% | 2.3% | 2.3% | |
| Percent Black | 88.7% | 89.5% | 89.2% | 85.8% | 78.1% | |
| Percent Hispanic | 5.4% | 6.5% | 7.5% | 7.6% | 4.1% | |
| Percent white | 1.5% | 1.0% | 1.1% | 2.5% | 4.4% | |
| Racial diversity index | 0.21 | 0.19 | 0.20 | 0.26 | 0.39 | |
| Income and Poverty | ||||||
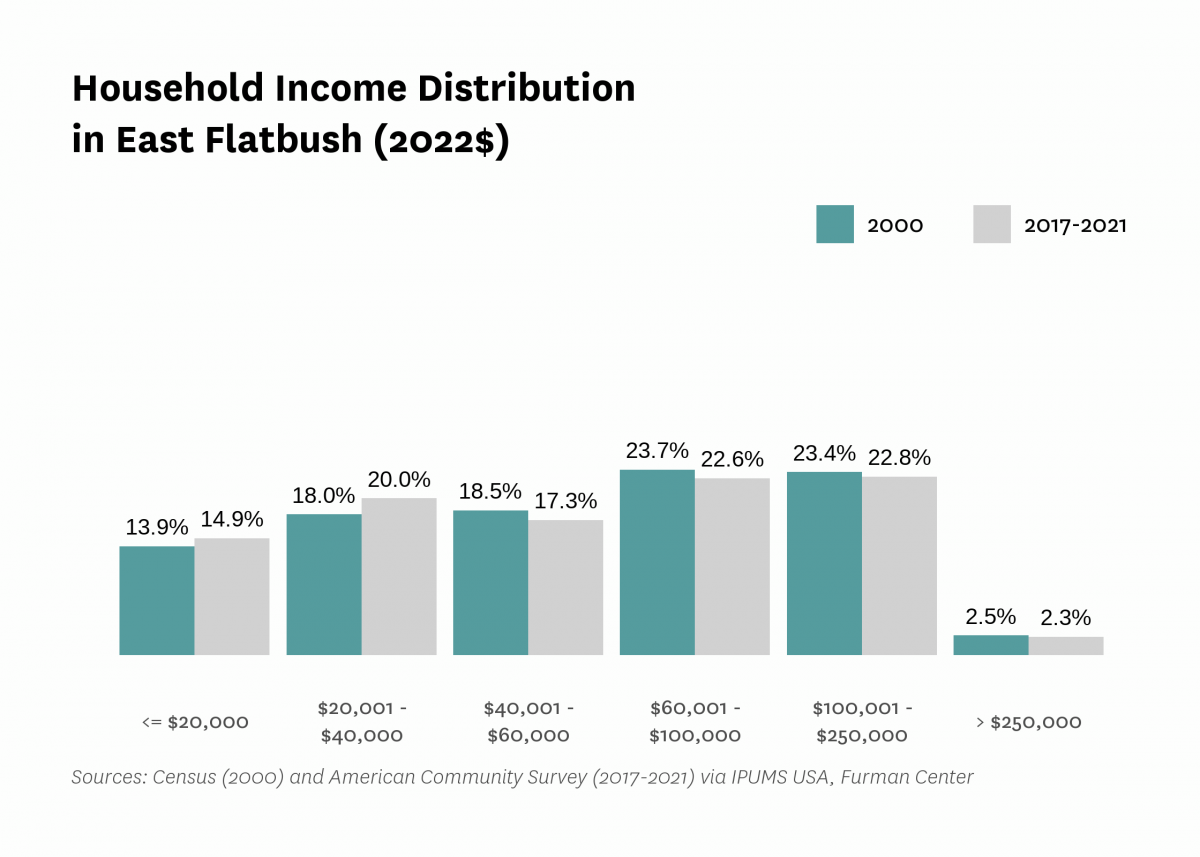
| Income diversity ratio | 3.9 | 5.0 | 4.5 | 7.5 | ||
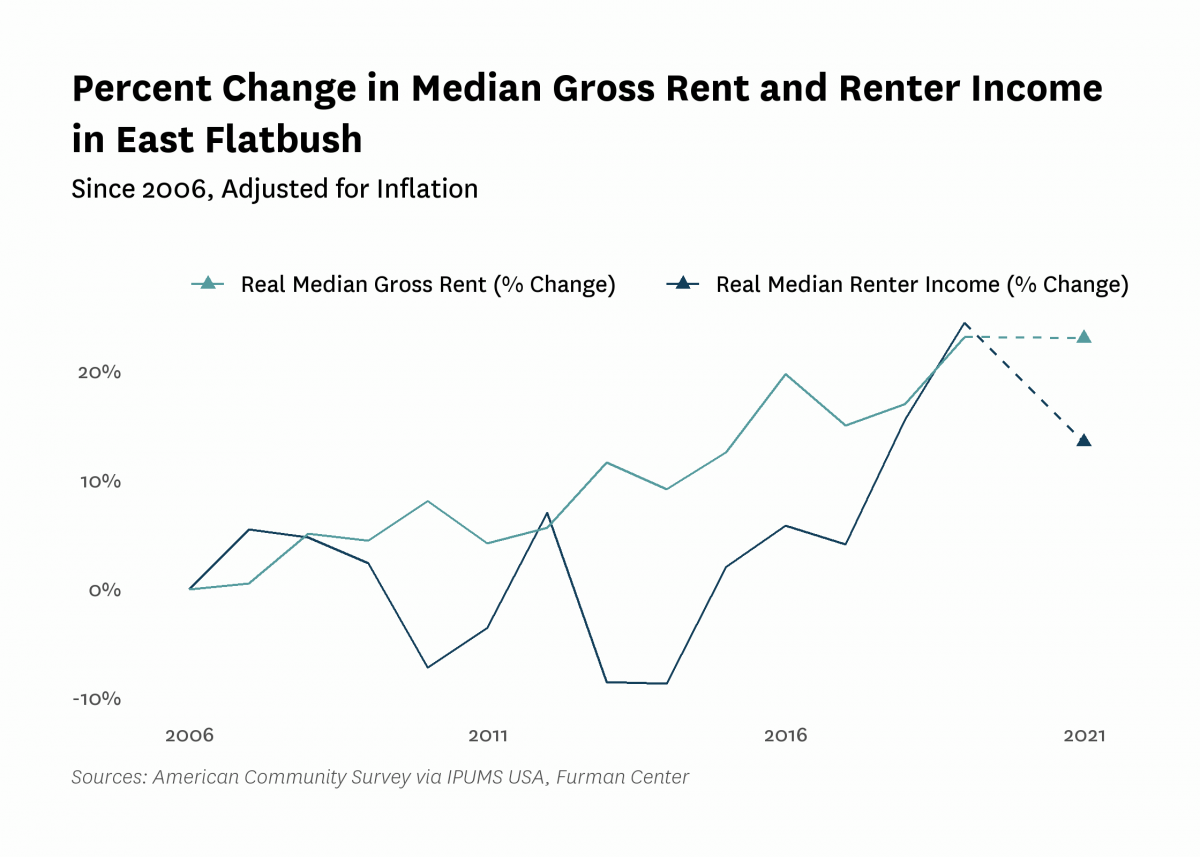
| Median household income (2022$) | $61,330 | $58,320 | $55,790 | $67,900 | $64,520 | |
| Median household income, homeowners (2022$) | $87,240 | $89,740 | $90,390 | $90,270 | ||
| Median household income, renters (2022$) | $46,440 | $43,100 | $57,820 | $52,730 | ||
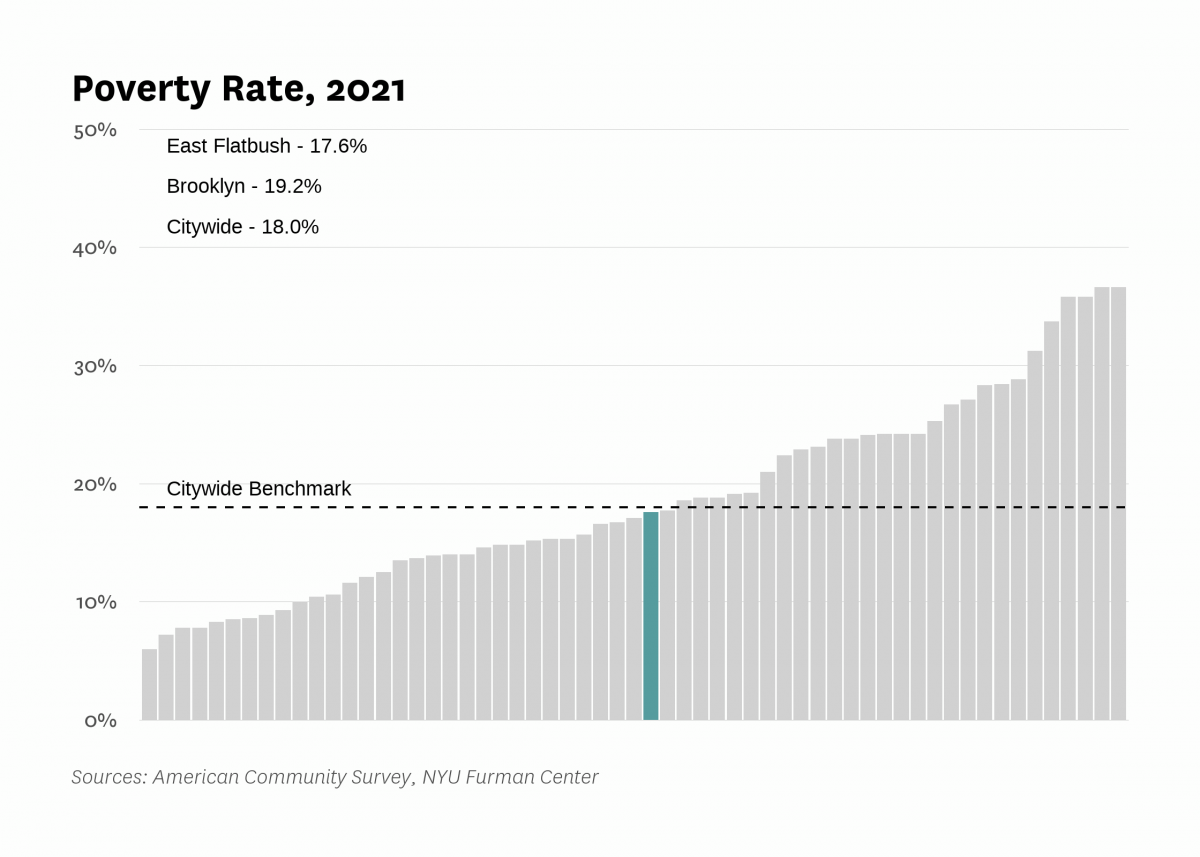
| Poverty rate | 19.4% | 19.1% | 15.4% | 9.9% | 17.6% | |
| Poverty rate, population aged 65+ | 18.8% | 17.9% | 10.3% | 18.9% | ||
| Poverty rate, population under 18 years old | 29.0% | 20.6% | 11.0% | 19.5% | ||
| Labor Market | ||||||
| Labor force participation rate | 63.8% | 64.2% | 61.8% | 61.2% | ||
| Population aged 25+ without a high school diploma | 17.9% | 15.1% | 14.1% | 15.1% | ||
| Unemployment rate | 12.49% | 8.35% | 12.77% | 5.01% | 12.72% | |
| Indicator | 2000 | 2006 | 2010 | 2019 | 2021 | 2022 |
|---|---|---|---|---|---|---|
| Housing Stock | ||||||
| Homeownership rate | 32.1% | 38.2% | 36.0% | 32.4% | 30.0% | |
| Housing units | 51,871 | 52,526 | 58,600 | 57,266 | ||
| Rental vacancy rate | 5.1% | 3.8% | 3.9% | |||
| Serious housing code violations (per 1,000 privately owned rental units) | 103.8 | 123.6 | 187.8 | 211.4 | 231.3 | |
| Severe crowding rate (% of renter households) | 3.4% | 3.6% | 3.8% | |||
| Total housing code violations (per 1,000 privately owned rental units) | 504.9 | 536.7 | 691.7 | 763.6 | 747.8 | |
| Finance - Distress | ||||||
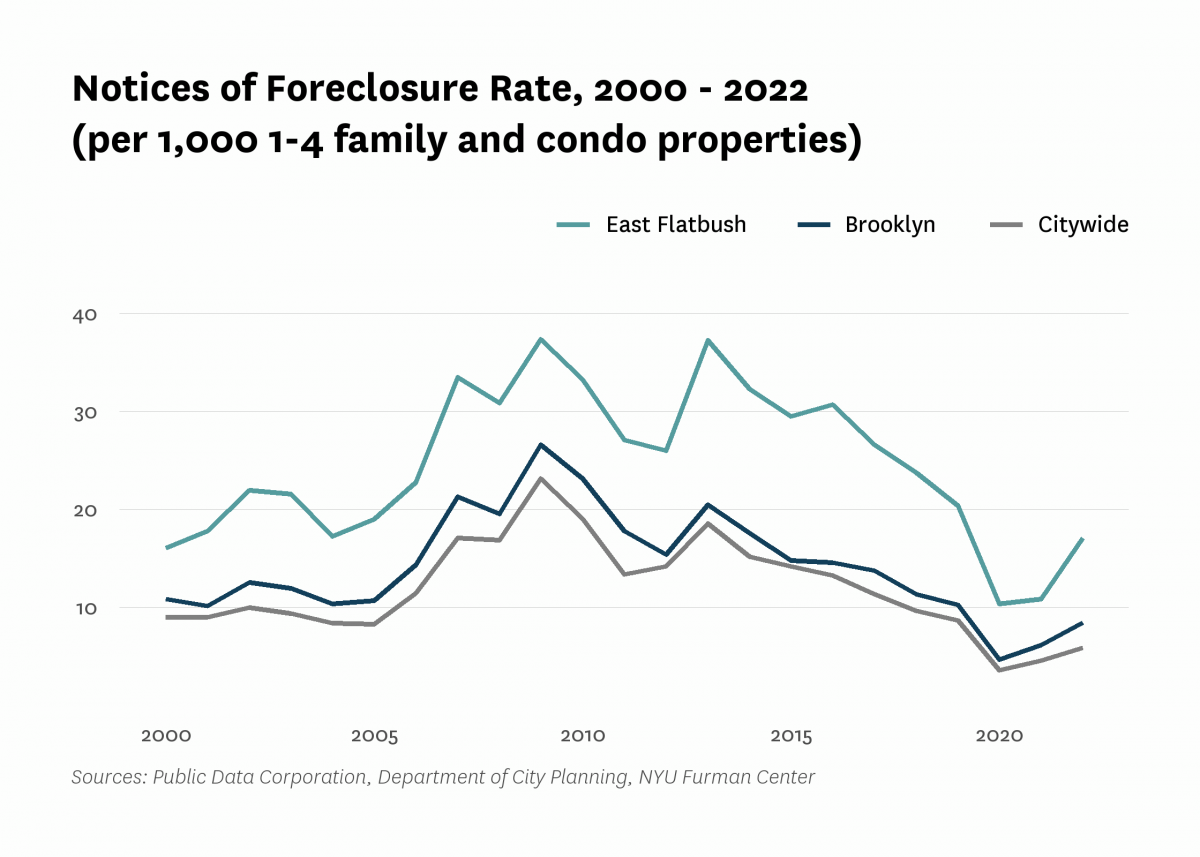
| Notices of foreclosure rate (per 1,000 1-4 family and condo properties) | 16.1 | 22.8 | 33.3 | 20.4 | 10.9 | 17.1 |
| Notices of foreclosure, all residential properties | 271 | 371 | 575 | 340 | 186 | 278 |
| Notices of foreclosure, initial, 1-4 family and condo properties | 185 | 273 | 341 | 136 | 44 | 97 |
| Notices of foreclosure, repeat, 1-4 family and condo properties | 55 | 71 | 168 | 175 | 121 | 162 |
| Pre-foreclosure notice rate (per 1,000 1-4 family and condo properties) | 106.5 | 37.1 | 90.6 | |||
| Pre-foreclosure notices, 1-4 family and condo properties | 1,623 | 563 | 1,374 | |||
| Properties entering REO, 1-4 family | 45 | 3 | 14 | |||
| Finance - Lending | ||||||
| FHA/VA-backed home purchase loans (% of home purchase loans) | 0.7% | 73.1% | 36.9% | 33.0% | ||
| Higher-cost home purchase loans (% of home purchase loans) | 54.8% | 1.6% | 16.7% | 9.9% | ||
| Higher-cost refinance loans (% of refinance loans) | 41.0% | 8.8% | 3.9% | 1.4% | ||
| Home purchase loan rate (per 1,000 properties) | 48.9 | 11.7 | 19.9 | 18.8 | ||
| Home purchase loans in LMI tracts (% of home purchase loans) | 48.7% | 9.4% | 44.2% | 40.5% | ||
| Home purchase loans to LMI borrowers (% of home purchase loans) | 2.8% | 52.2% | 7.1% | 8.2% | ||
| Refinance loan rate (per 1,000 properties) | 110.9 | 14.5 | 24.5 | 49.5 | ||
| Sales - Volume | ||||||
| Sales volume, 1 family building | 173 | 289 | 60 | 137 | 101 | 131 |
| Sales volume, 2-4 family building | 313 | 592 | 143 | 249 | 134 | 235 |
| Sales volume, 5+ family building | 28 | 72 | 17 | 16 | 18 | 21 |
| Sales volume, condominium | 3 | 10 | 21 | 17 | 13 | 13 |
| Sales volume, all property types | 517 | 963 | 241 | 419 | 266 | 400 |
| Sales - Median Prices | ||||||
| Median sales price per unit, 1 family building (2022$) | $317,790 | $585,990 | $437,790 | $646,680 | $700,280 | $665,000 |
| Median sales price per unit, 2-4 family building (2022$) | $164,280 | $324,300 | $228,550 | $348,420 | $376,580 | $345,000 |
| Median sales price per unit, 5+ family building (2022$) | $64,440 | $112,720 | $91,210 | $195,740 | $155,620 | $158,330 |
| Median sales price per unit, condominium (2022$) | $217,520 | $415,370 | $390,000 | $602,080 | $557,040 | $585,000 |
| Sales - Housing Price Index | ||||||
| Index of housing price appreciation, 1 family building | 100.0 | 224.8 | 159.1 | 273.6 | 334.0 | 317.5 |
| Index of housing price appreciation, 2-4 family building | 100.0 | 227.2 | 163.7 | 286.3 | 322.3 | 305.6 |
| Index of housing price appreciation, 5+ family building | 100.0 | 198.2 | 195.3 | 499.5 | 351.7 | 354.1 |
| Index of housing price appreciation, condominium | 100.0 | 347.2 | 286.5 | 474.1 | 521.6 | 543.4 |
| Index of housing price appreciation, all property types | 100.0 | 224.6 | 164.7 | 290.4 | 330.9 | 314.4 |
| Subsidized Housing | ||||||
| Total number of subsidized properties (properties) | 129 | |||||
| HUD Financing or Insurance (properties) | 0 | |||||
| HUD Financing or Insurance (units) | 0 | |||||
| HUD Project-based Rental Assistance Program (properties) | 8 | |||||
| HUD Project-based Rental Assistance Program (units) | 314 | |||||
| Low Income Housing Tax Credit (properties) | 10 | |||||
| Low Income Housing Tax Credit (units) | 436 | |||||
| Public Housing (properties) | 4 | |||||
| Public Housing (units) | 143 | |||||
| Mitchell-Lama (properties) | 1 | |||||
| Mitchell-Lama (units) | 0 | |||||
| 421-a Tax Exemption (properties) | 130 | |||||
| 421-a Tax Exemption (units) | 3,029 | |||||
| 420-c Tax Exemption (properties) | 7 | |||||
| 420-c Tax Exemption (units) | 385 | |||||
| NYC Housing Production Programs and Zoning Incentives or Requirements (properties) | 97 | |||||
| Eligible to expire from housing programs between 2023 and 2028 (properties) | 9 | |||||
| Eligible to expire from housing programs between 2023 and 2028 (units) | 313 | |||||
| Eligible to expire from housing programs between 2029 and 2038 (properties) | 2 | |||||
| Eligible to expire from housing programs between 2029 and 2038 (units) | 101 | |||||
| Eligible to expire from housing programs in 2039 and later (properties) | 6 | |||||
| Eligible to expire from housing programs in 2039 and later (units) | 325 | |||||
| Indicator | 2000 | 2006 | 2010 | 2019 | 2021 | 2022 |
|---|---|---|---|---|---|---|
| Density | ||||||
| Population density (1,000 persons per square mile) | 47.9 | 45.6 | 44.2 | 45.2 | ||
| Development | ||||||
| Units authorized by new residential building permits | 26 | 0 | 7 | 678 | 653 | 1,142 |
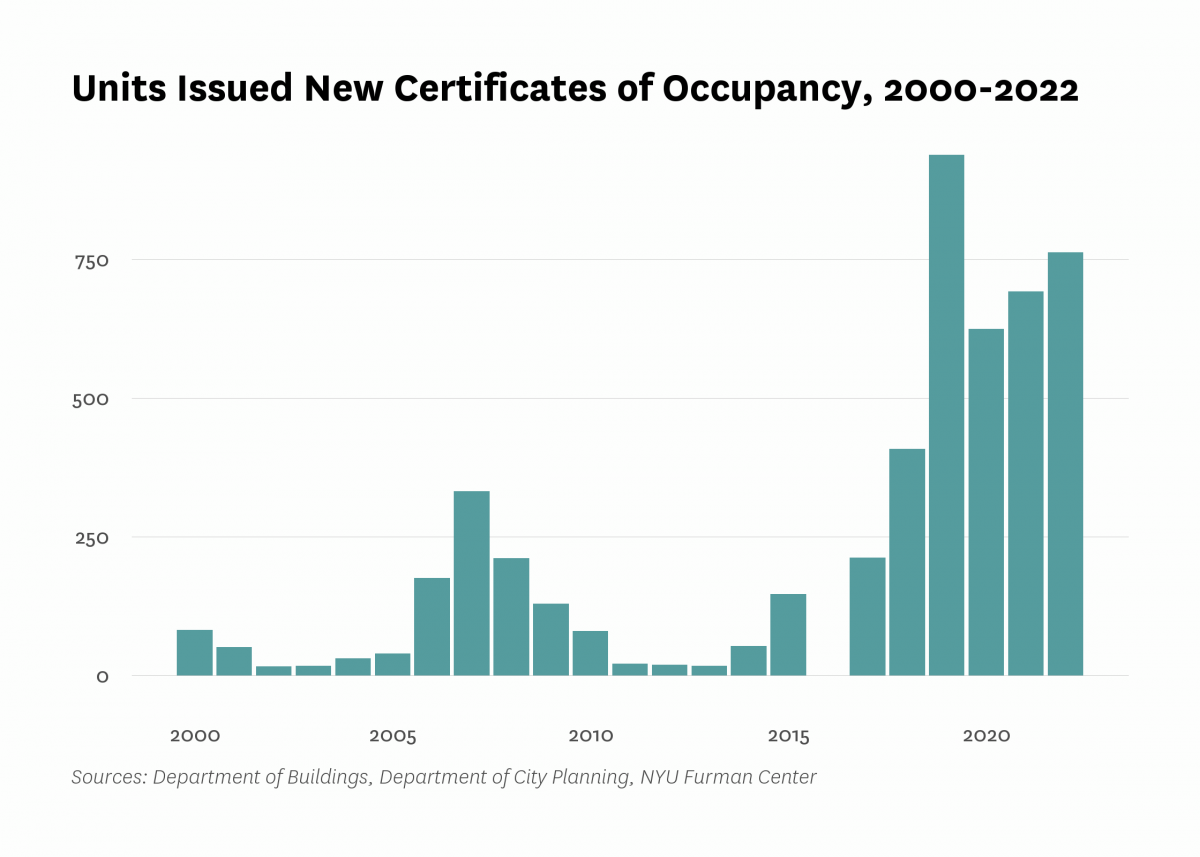
| Units issued new certificates of occupancy | 82 | 176 | 80 | 938 | 692 | 763 |
| Indicator | 2000 | 2006 | 2010 | 2019 | 2021 | 2022 |
|---|---|---|---|---|---|---|
| Commute | ||||||
| Car-free commute (% of commuters) | 67.7% | 72.2% | 69.9% | 72.6% | 65.0% | |
| Mean travel time to work (minutes) | 50.1 | 45.6 | 46.6 | 47.8 | 45.9 | |
| Crime and Incarceration | ||||||
| Serious crime rate (per 1,000 residents) | 14.7 | 13.5 | 10.0 | 10.9 | 12.9 | |
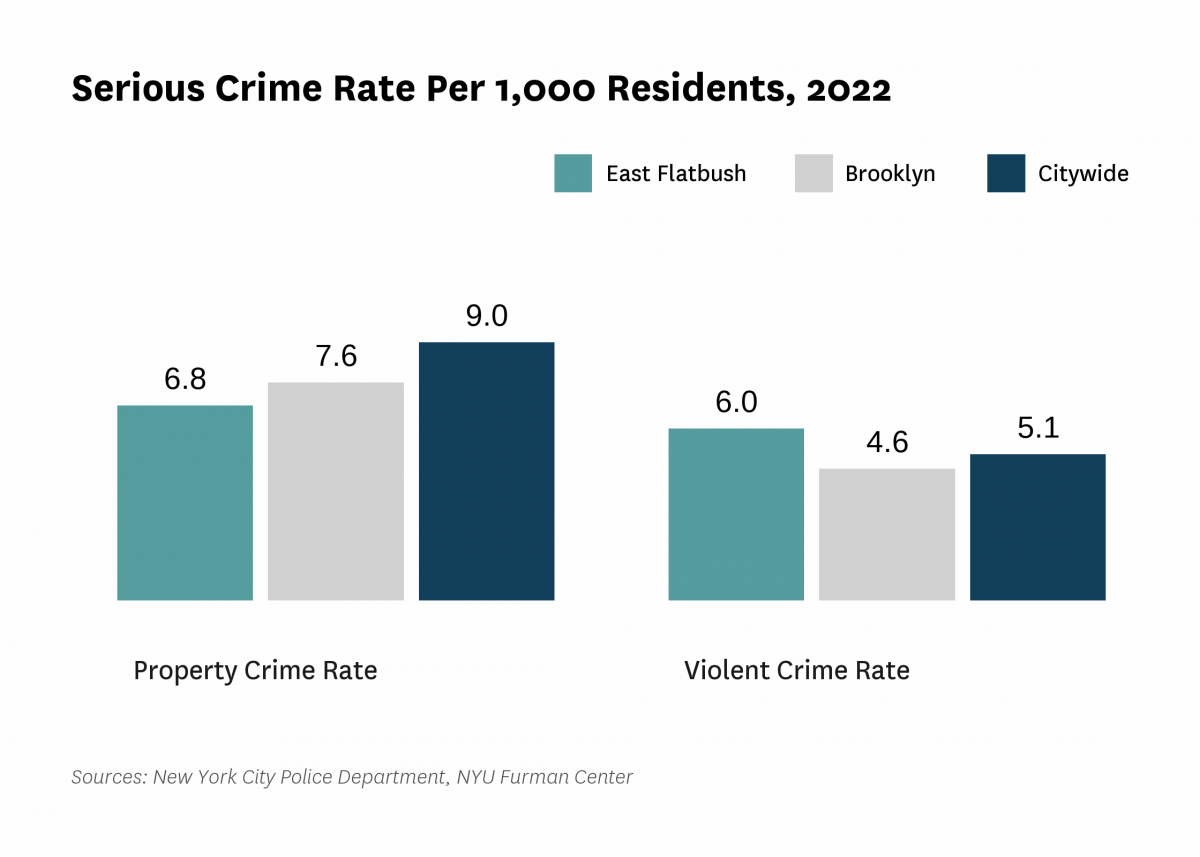
| Serious crime rate, property (per 1,000 residents) | 9.0 | 7.8 | 5.4 | 5.4 | 6.8 | |
| Serious crime rate, violent (per 1,000 residents) | 5.7 | 5.7 | 4.7 | 5.5 | 6.0 | |
| Schools | ||||||
| Students performing at grade level in English language arts, 4th grade | 43.3% | 42.5% | ||||
| Students performing at grade level in math, 4th grade | 36.3% | 32.7% | ||||
| Indicator | 2000 | 2006 | 2010 | 2019 | 2021 | 2022 |
|---|---|---|---|---|---|---|
| Median Rent | ||||||
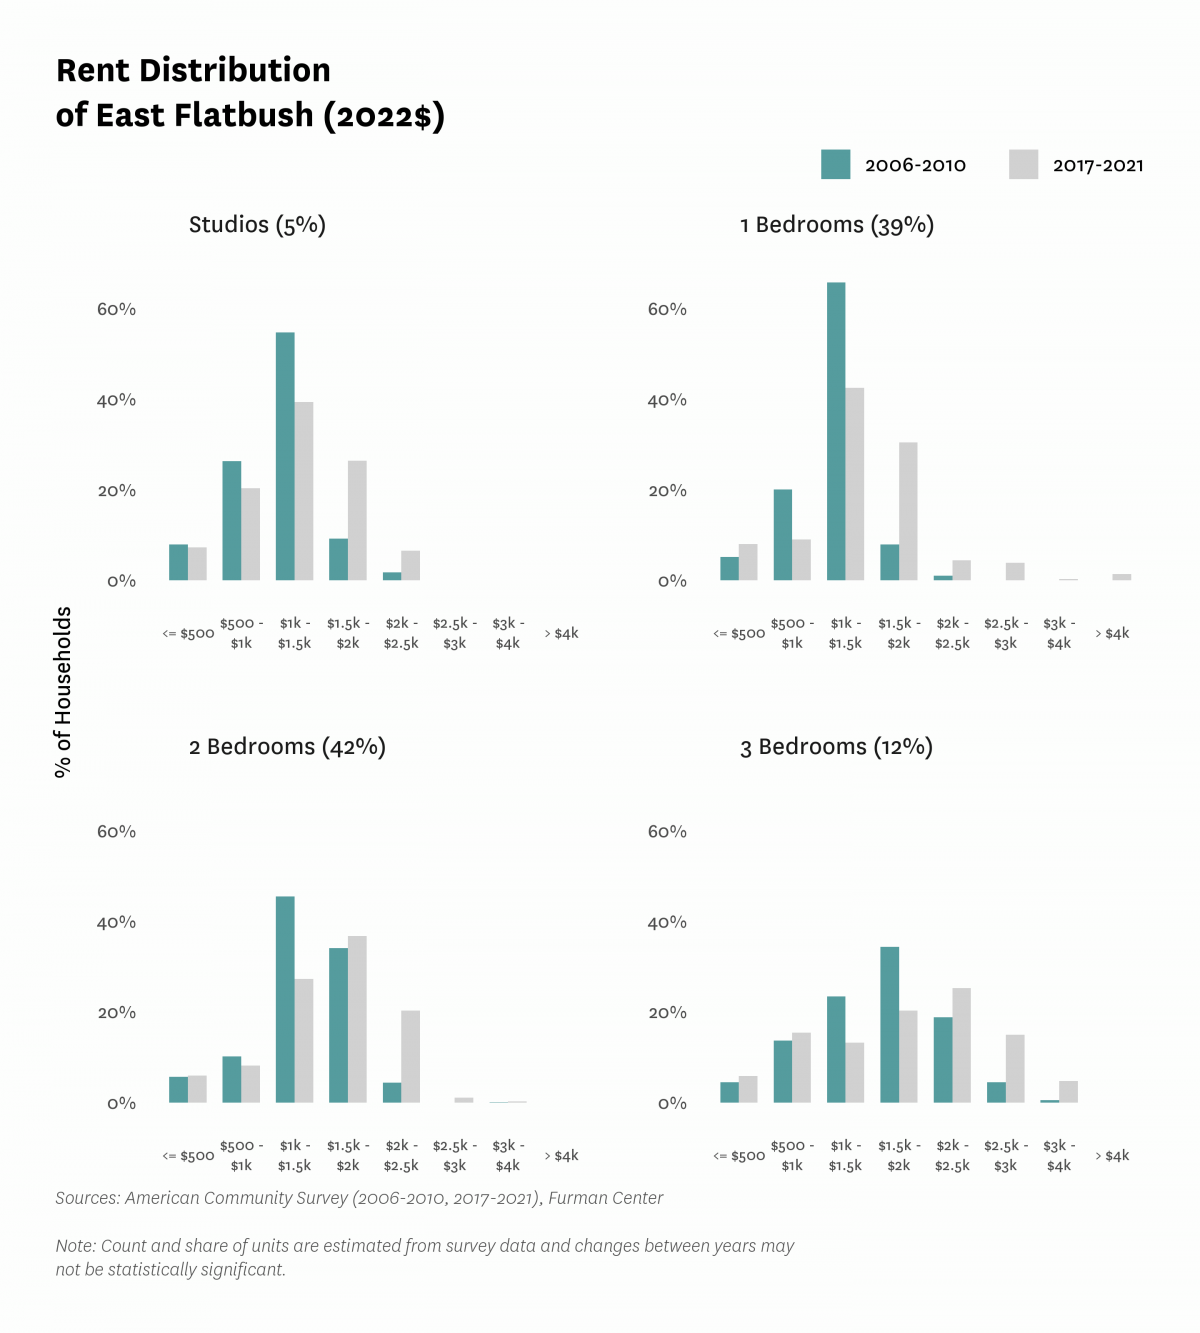
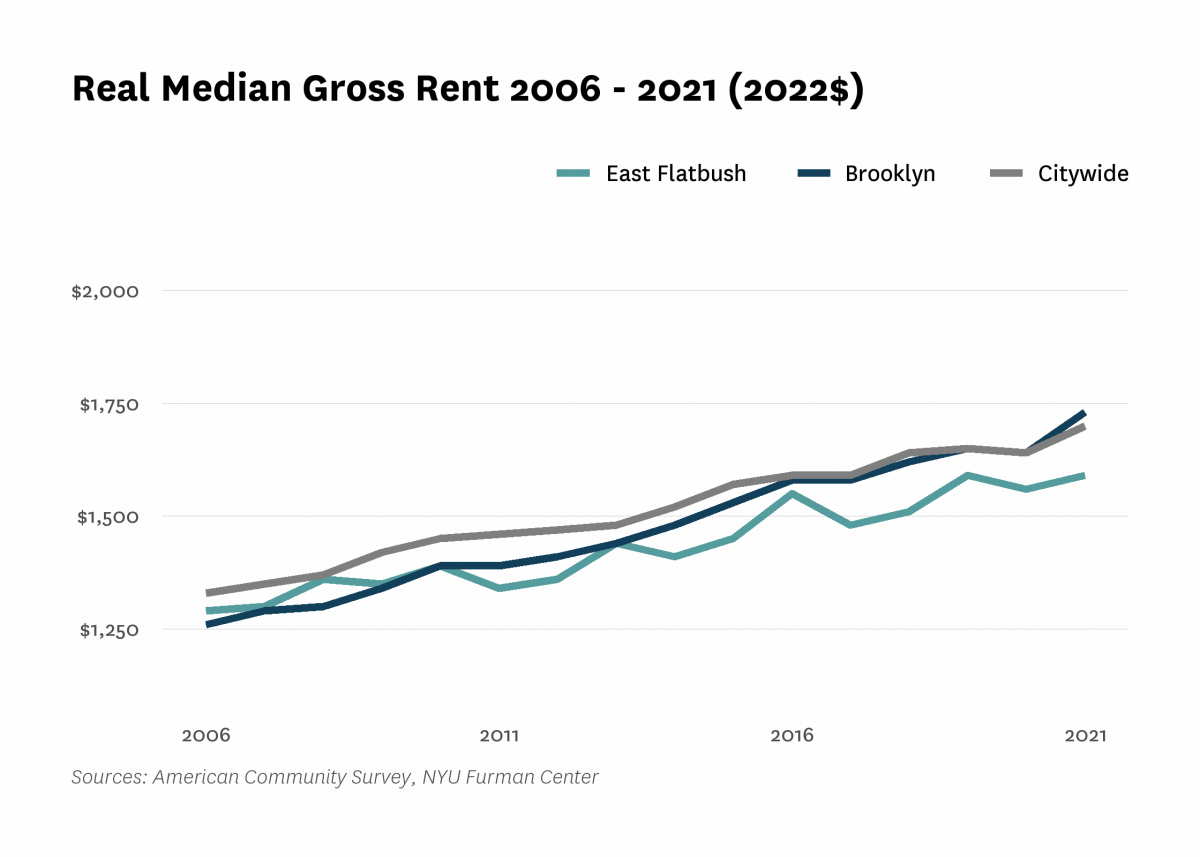
| Median rent, 2- and 3-bedrooms (2022$) | $1,460 | $1,580 | $1,680 | |||
| Median rent, all (2022$) | $1,170 | $1,290 | $1,390 | $1,590 | $1,590 | |
| Median rent, recent movers (2022$) | $1,340 | $1,620 | $1,770 | |||
| Median rent, studios and 1-bedrooms (2022$) | $1,200 | $1,330 | $1,420 | |||
| Change in collected rent (2019-2020) | 3.5% | |||||
| Affordability | ||||||
| Rental units affordable at 30% AMI (% of recently available units) | 4.8% | 11.0% | 9.2% | |||
| Rental units affordable at 80% AMI (% of recently available units) | 85.6% | 85.6% | 87.0% | |||
| Rental units affordable at 120% AMI (% of recently available units) | 99.7% | 99.0% | 98.8% | |||
| Rent Burden | ||||||
| Moderately rent-burdened households | 27.4% | 26.3% | 27.5% | 19.4% | ||
| Moderately rent-burdened households, low income | 34.4% | 33.7% | 32.5% | |||
| Moderately rent-burdened households, moderate income | 6.7% | 7.1% | 7.2% | |||
| Severely rent-burdened households | 26.1% | 30.7% | 31.6% | 31.8% | ||
| Severely rent-burdened households, low income | 43.2% | 41.9% | 45.0% | |||
| Severely rent-burdened households, moderate income | 0.0% | 0.2% | 1.2% | |||
| Rental Subsidy | ||||||
| Housing choice vouchers (% of occupied, privately owned rental units) | 5.4% | 3.8% | ||||
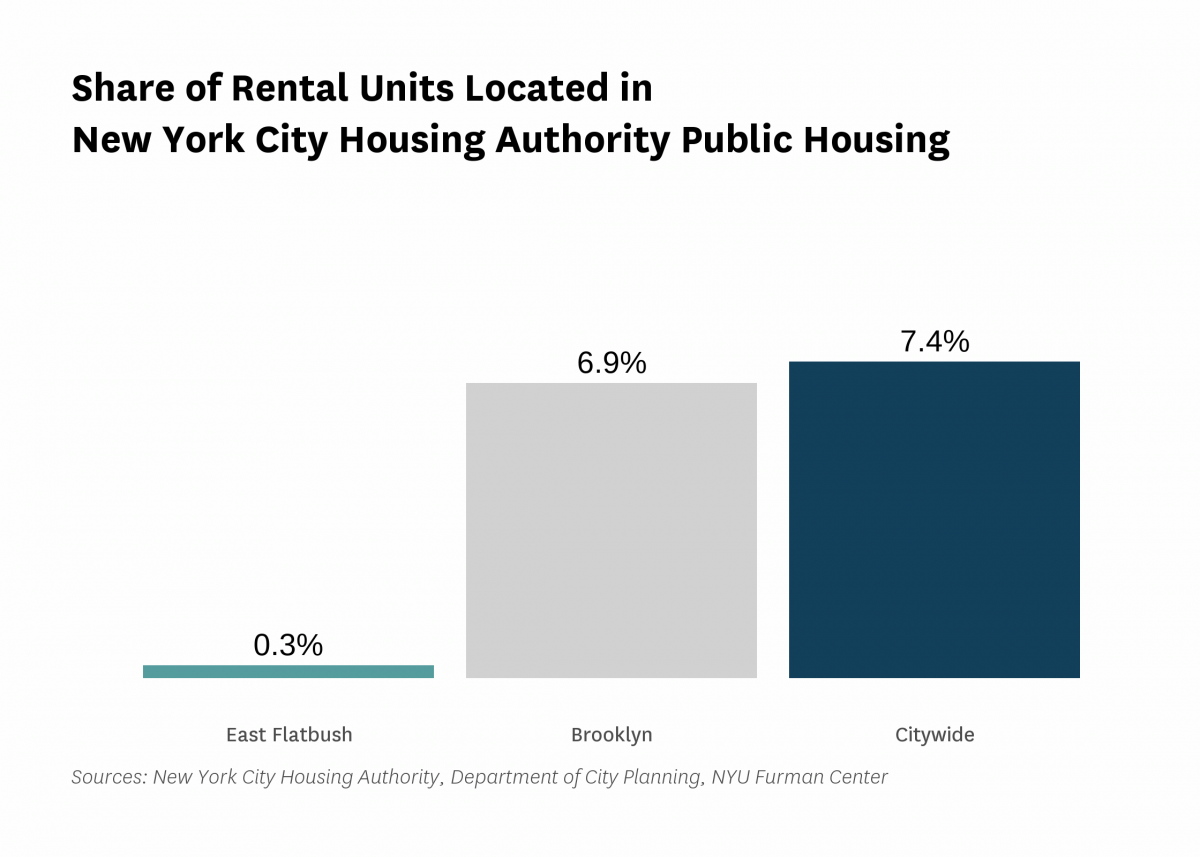
| Public housing (% of rental units) | 0.3% | |||||
Data Notes: See CoreData User Guide for more information about indicator definitions and methods.
Indicators: The rental vacancy rate, severe crowding rate, and the severely rent-burdened households indicators use five-year American Community Survey (ACS) estimates. Data under the 2010 heading comes from the 2006 – 2010 ACS and data under the 2019 heading comes from the 2015 – 2019 ACS.
Rankings: We report rankings out of all neighborhoods for which the indicator can be calculated. Rankings are listed for community districts, though some indicators are reported at the sub-borough area level.
All content © 2005 – 2024 Furman Center for Real Estate and Urban Policy | Top of page | Contact Us